

asbe/iStock via Getty Images
Hope for the best but prepare for the worst. This is good advice in a bear market.
The barometer for the economy and the markets in general is the Nasdaq. Stock markets have been ‘tech heavy’ ever since the days of yore, and it is this segment that goes up more and down more than any other market group.
Here is the example of the extra swing in tech versus the stodgier Dow.
NASDAQ and Dow (ADVFN)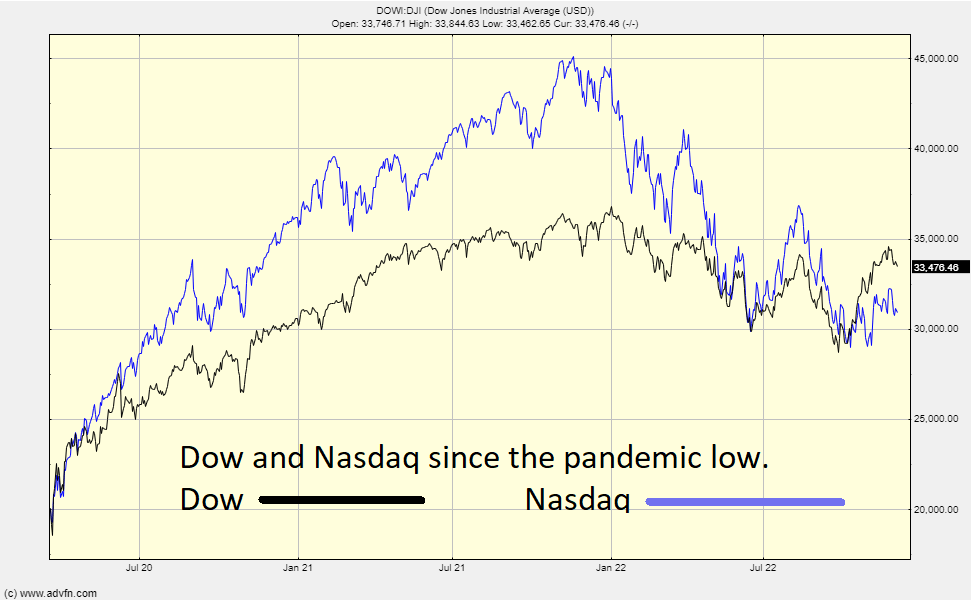
So here we are – after a year of bear market – entering into another calendar cycle. The current bear market started about this time last year and was caused by the imminent tightening telegraphed by the Federal Reserve which got underway at the start of 2022.
What is the call for 2023: more of the same or back to the bull?
For me, the first consideration is to hold the thought that the market is not looking at the situation today but is looking out 12 months. If things were going to get better in 2024 then the market would be moving up. Will another 12 months bring the global economy back to growth and back to economic normality?
I do not think so.
Like for the kid in the back seat crying ‘are we there yet?’ the answer is highly likely to be no.
So, what happens next? If it’s not up, then it’s sideways or down.
Sideways is better than down because it will support everyone, but that ‘soft landing’ is a rare thing indeed. The Federal Reserve – and its brother in Central Banks around the world – will have to pull off another herculean task to avoid a painful market capitulation which normally sign posts the road back to economic health.
That final leg down is not fate, but it is a mainline.
What would it look like? Here is a guide to the worst case scenario.
We are here:
ADVFN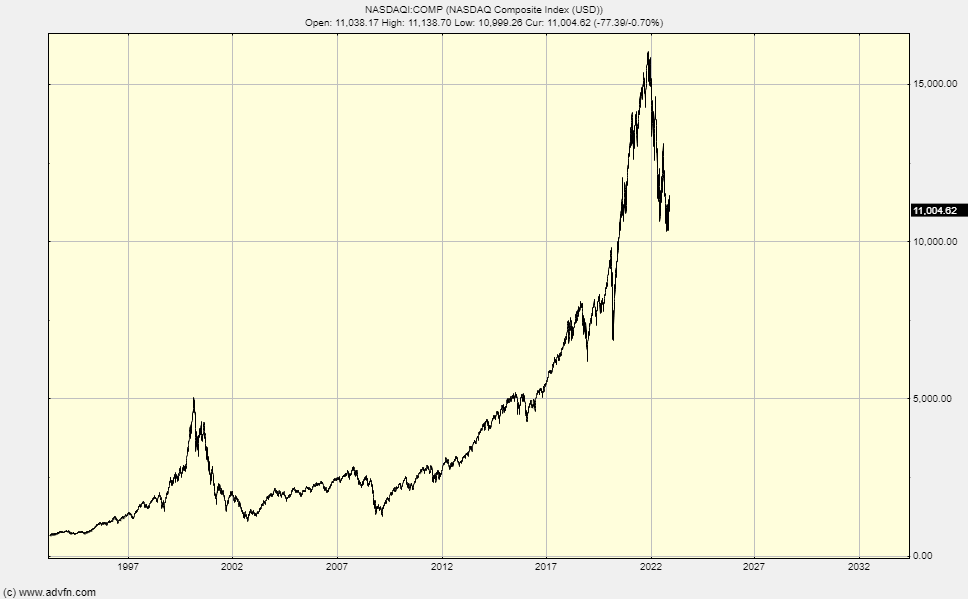
Worst case, this is where we are going:
ADVFN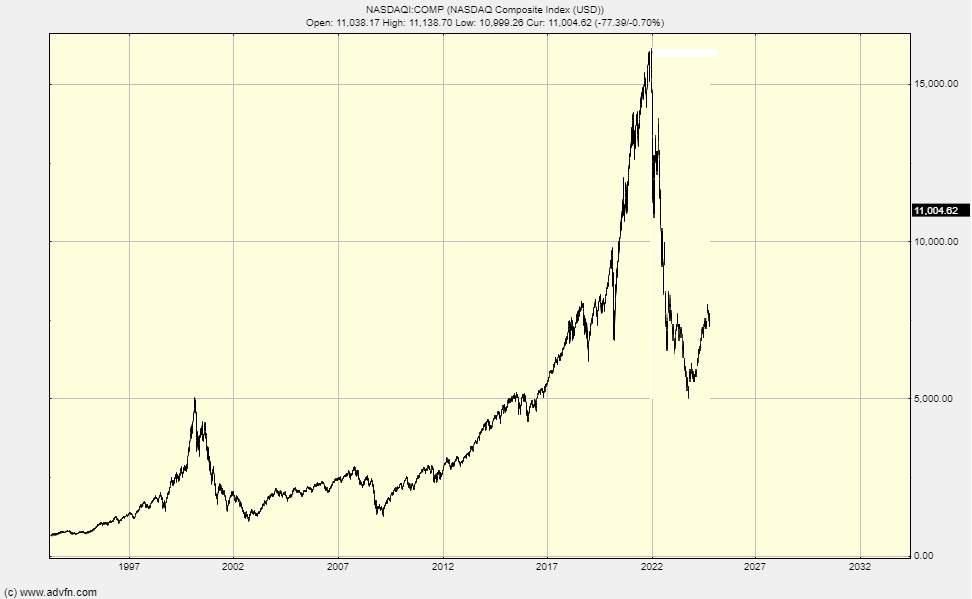
For this not to happen there probably needs to be a catalyst because the trend is clear. Here is the chart again to reiterate just how clear it is:
NASDAQ (ADVFN)
It is a non-random move because it is created by rising interest rates and Federal Reserve balance sheet run-off. Optically the trend will be hard to break and in the real world of politics and economics, it will need a global reversal of policy and an accommodation of elevated inflation to keep markets aloft.
The simple road to balancing the First World’s destabilised finances – by letting inflation do the dirty work – has been rejected.
Therefore, unless they say one thing and do another (never that unlikely in politics), the worst case can happen.
The big banks are planning for a deep, inflation-killing recession followed by more QE. They seem to think that will come to pass quite quickly. However, whether it is months or years, we all need to have a map of the worst case at hand, at the very least to be able to see when the narrative is diverging to a more positive outlook.
Be the first to comment