

AHMEDCO/iStock via Getty Images
A “golden cross” for the DJIA
Marketsmith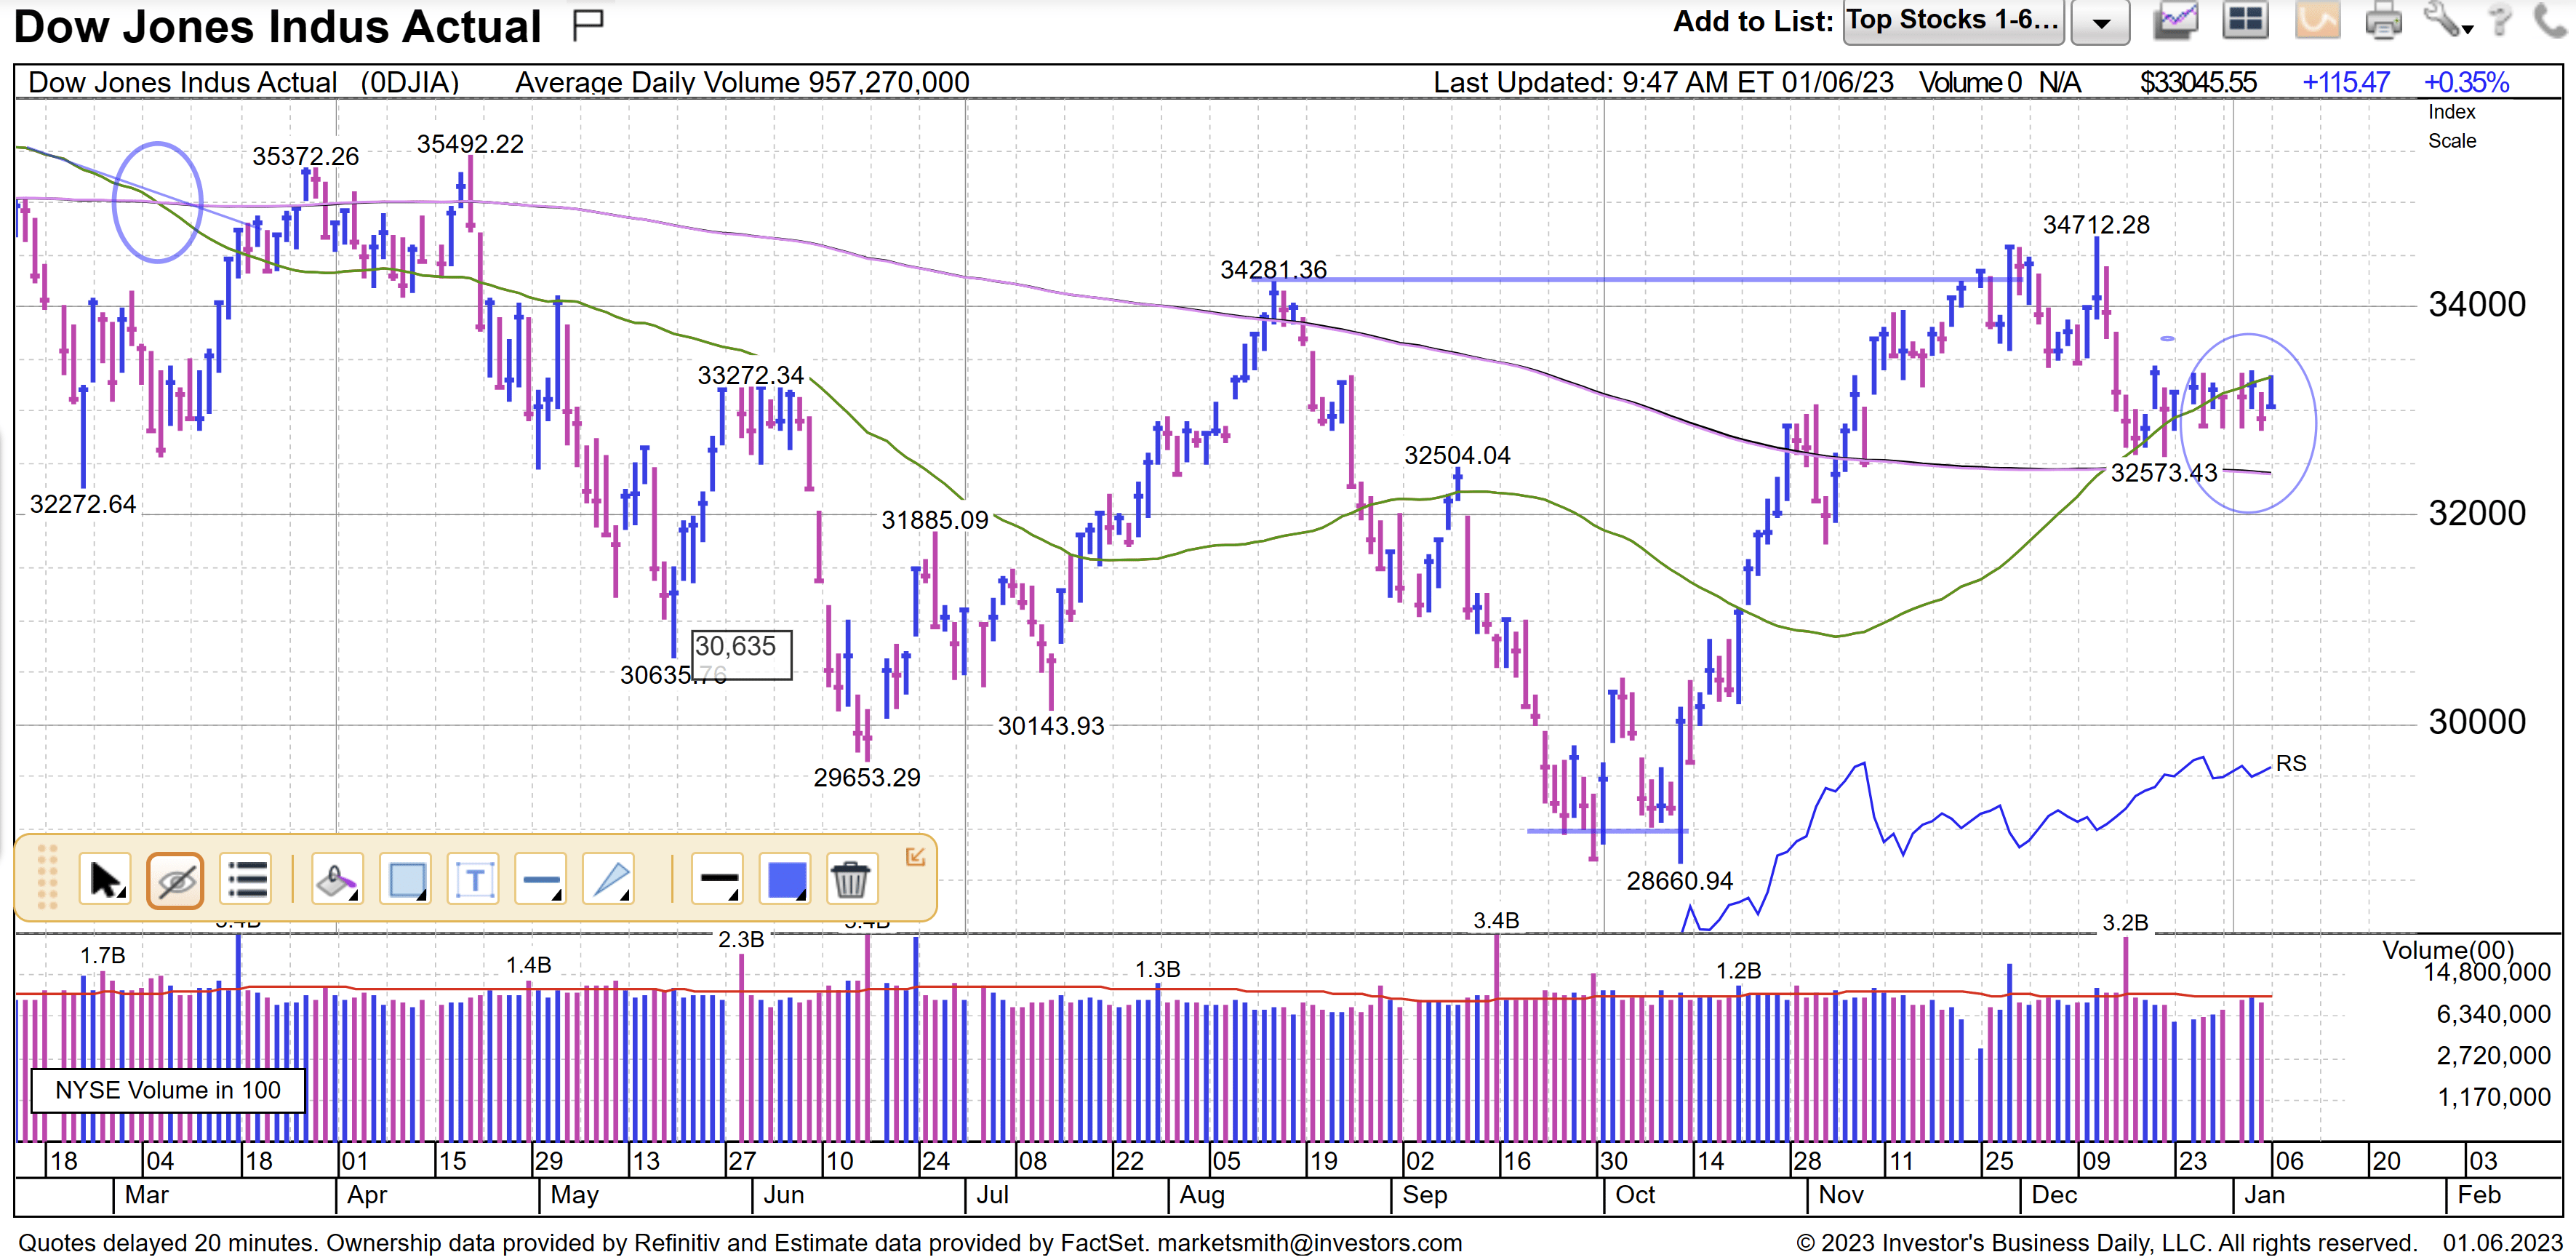
The markets had a constructive week despite some strong labor market reports. A tight labor market continues to be a problem in bringing inflation back to the Fed’s target of 2%. Inflation has been cooling down recently from the low double-digits to the 7%-8% range, however. We still think that the Fed will stop their rate hikes during this current cycle when they get to a terminal rate of 5.0%. The Fed is currently at 4.25%.
With a market that always looks ahead by 12-24 months, it could now be seeing rates topping out in the spring of this year and maybe even rate cuts by late 2023 or early 2024. For that reason, many DJIA-type, large-cap dividend payers have really started to take off in anticipation of a friendlier Fed down the road. As you can see from the chart above, the DJIA formed a “golden-cross” about four weeks ago and continues to strengthen.
DJIA stocks like Boeing (BA), Caterpillar (CAT), Disney (DIS), Merck (MRK), Nike (NKE), Raytheon (RTX), and Travelers (TRV) are breaking out right now. Boeing is an excellent example of this. See the chart below. The others that I just mentioned also look similar.
Marketsmith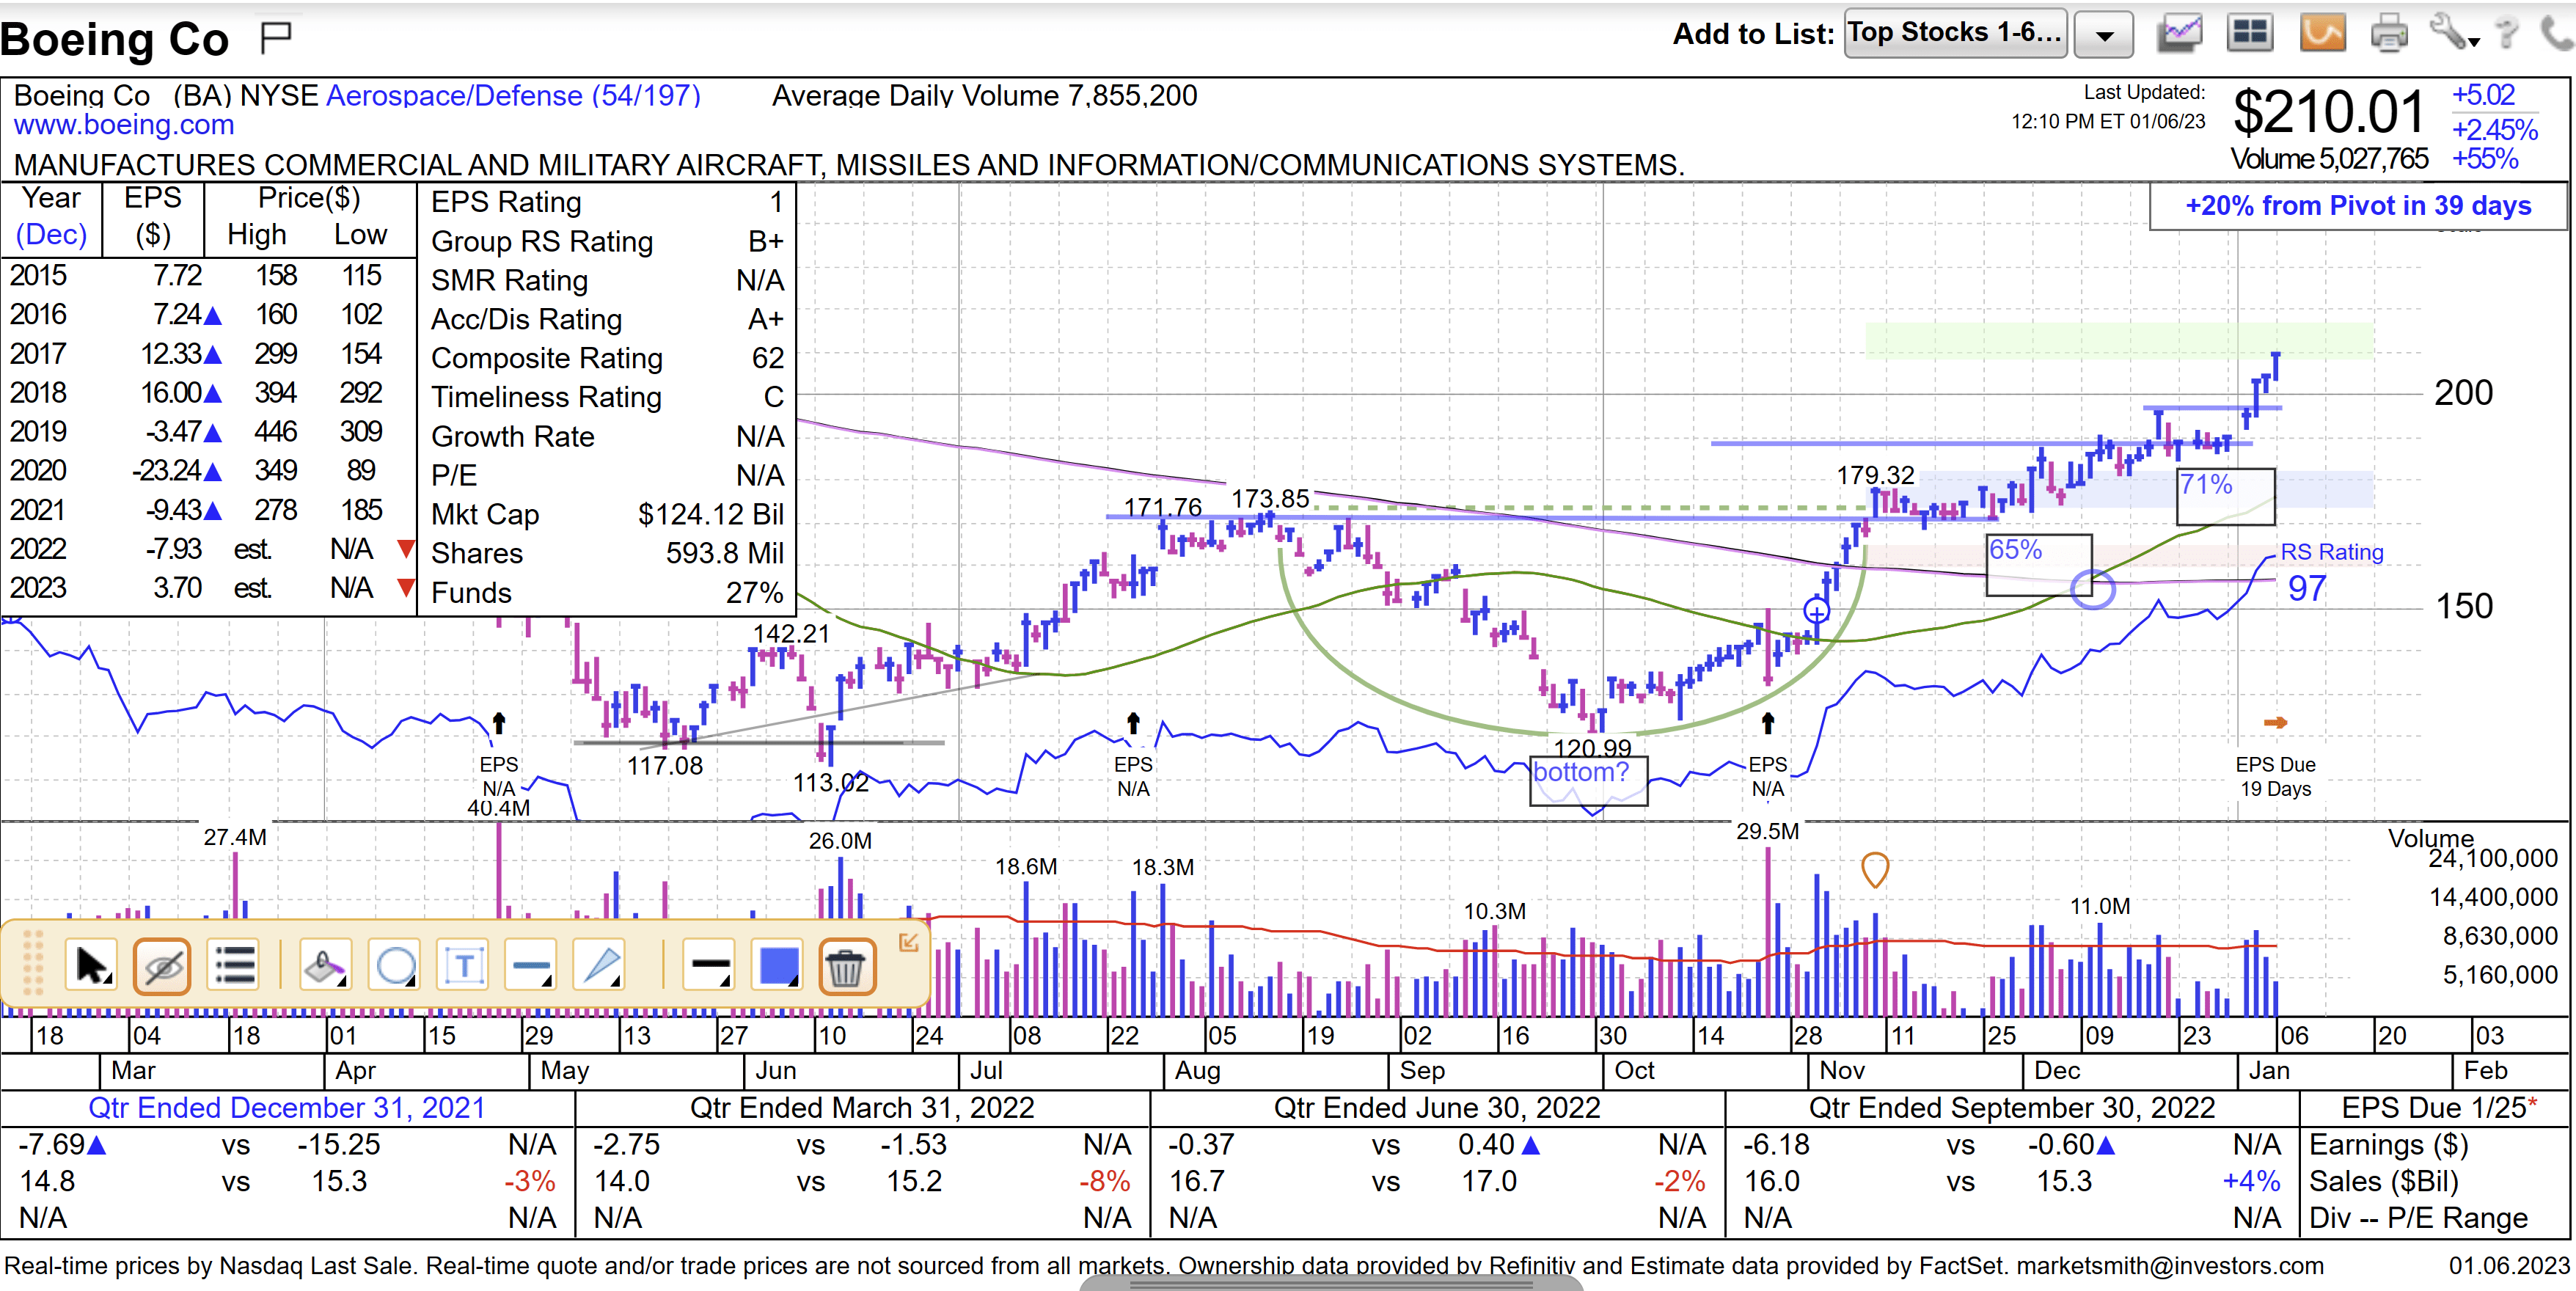
The S&P 500 has not produced a “golden-cross” yet, but it’s moving in that direction right now. Keep in mind that the forward PE ratio of the S&P 500 contracted from 23X to 17X during the rising rate cycle last year. That forward PE has probably stabilized in the 16-18 range for now, unless the Fed cannot get inflation under control. As of now, that scenario looks unlikely, however.
We can now focus on S&P 500 earnings growth or lack thereof in 2023 and 2024 to arrive at our 12-month target price for this index. We will do that in a bit. The damage to the S&P 500 this past year was done by the aforementioned multiple contractions, not a big drop in earnings.
The Nasdaq is now searching out a bottom and may be finding one just above 10,000. See the chart below. The DJIA was down 8.8% last year, while the Nasdaq was down 33.1%. Higher PE stocks were hurt much more than lower PE stocks in 2022 due to the shrinking multiples. Longer-duration stocks (Think Lucid (LCID), ChargePoint (CHPT), Rivian (RIVN), etc.) also fared much worse in 2022 than shorter-duration stocks. (Think large, mature growth stocks that pay a dividend.)
Marketsmith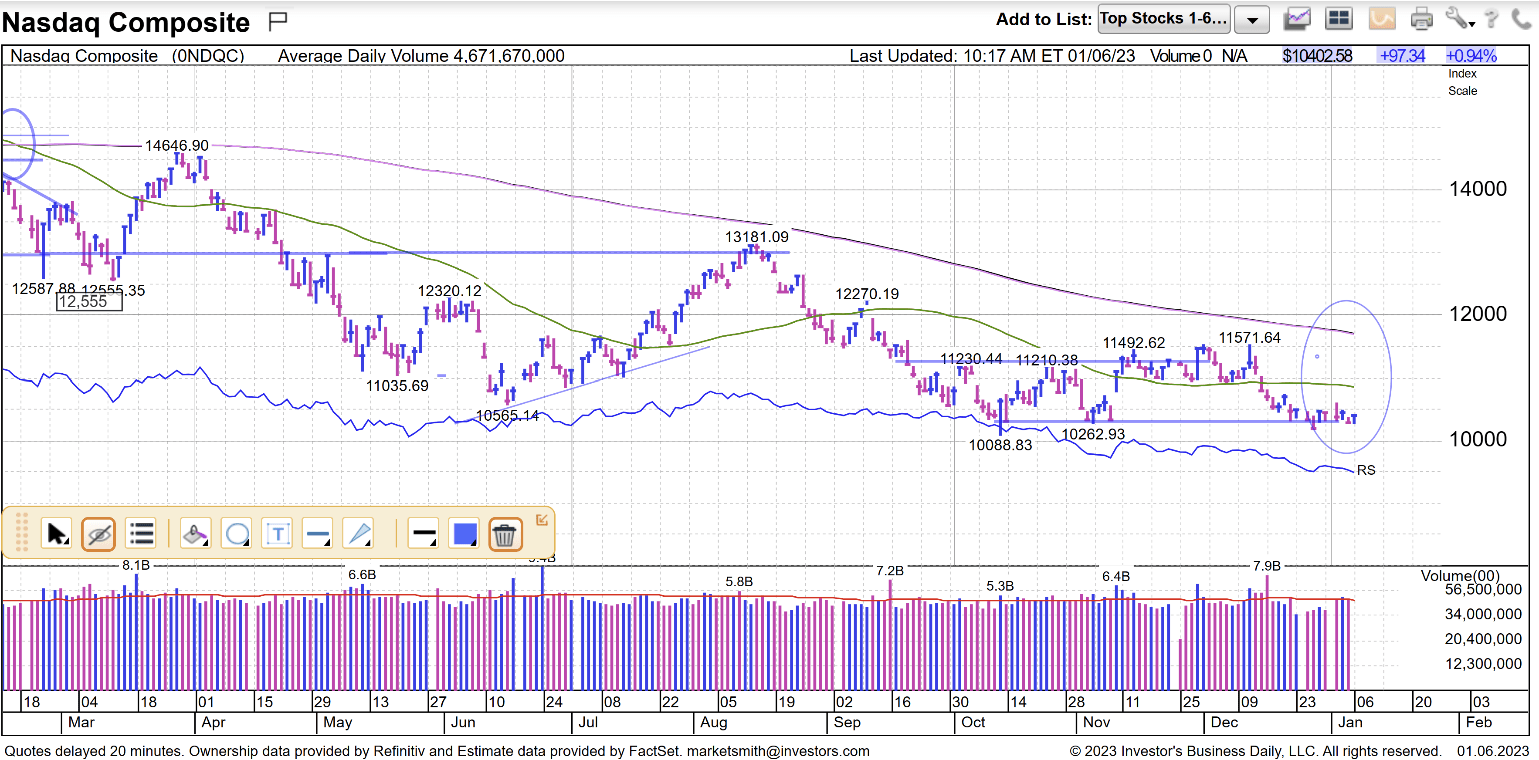
Going out further on the high PE (or in a lot of cases no PE) and longer duration curve, the greater the damage. Cathie Wood’s ARK Innovation fund (ARKK) was down a whopping 67% in 2022. Long-duration stocks were the worst place to be in last year. They and bitcoin (-66%) were the biggest losers for the year. Will they be the biggest winners in 2023? Don’t count on it.
Marketsmith
Wood needs Tesla (TSLA) to find a bottom for her fund to also find a bottom. Maybe it will finally bottom when it hits $100 per share. With all that’s going on with Elon Musk right now, it’s hard to tell when Tesla will finally overcome the negative sentiment that it has toward it right now, however. The stock is a lot cheaper than it was back in September, but it still trades at a PE ratio of 30X.
Marketsmith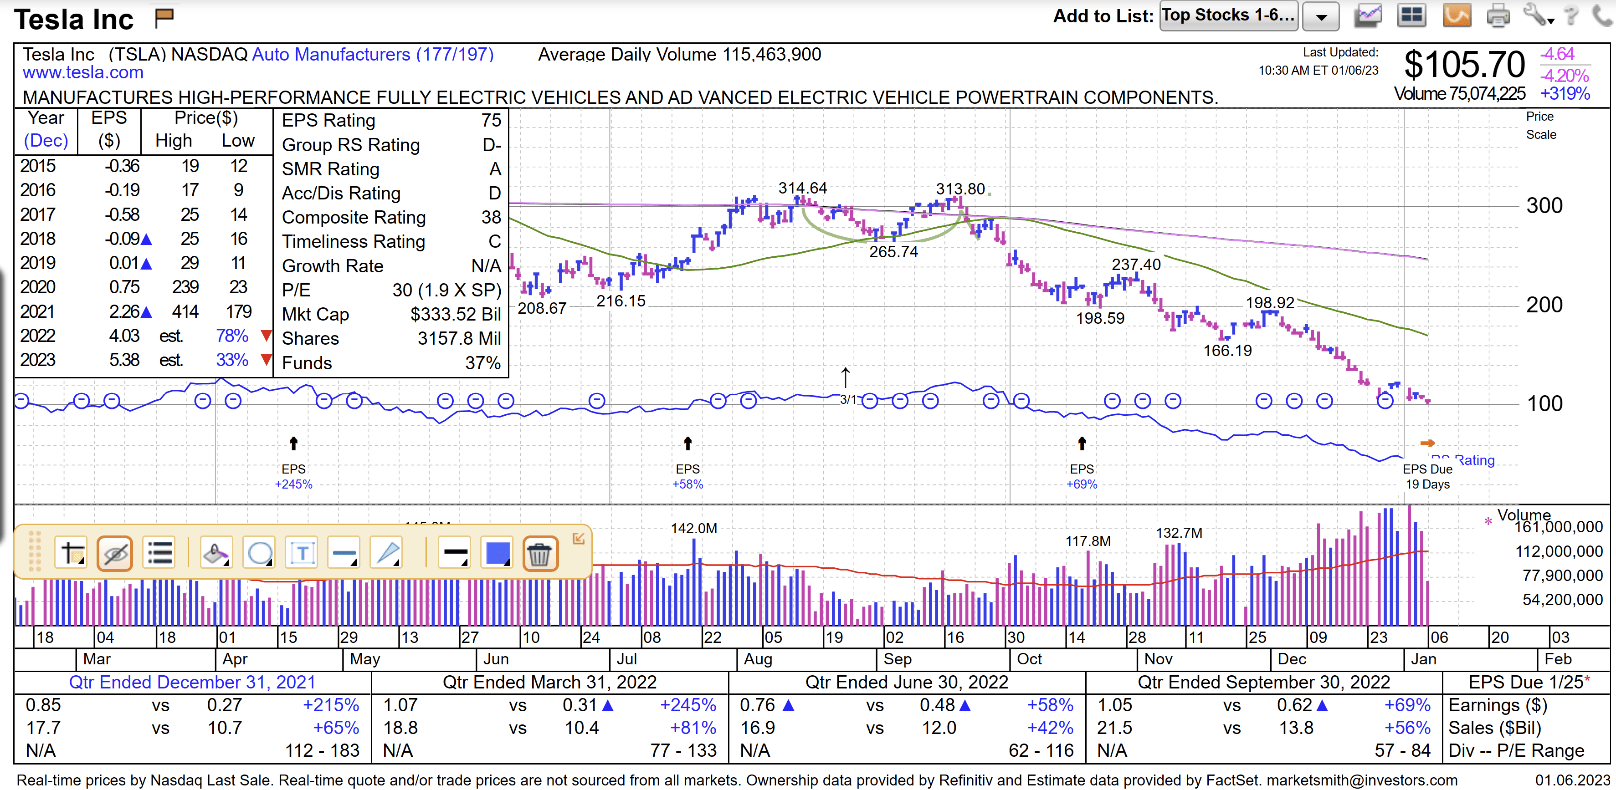
The prospects for the bond market look better this year, but we would still avoid bond funds as they are at the mercy of interest rates, which should continue to go higher for a while. We are finding very good yields in the 5%-6% area on individual 3-5 year bonds that are very attractive right now, however. We have been scooping several up for our risk-averse investors.
The long-duration bonds were hurt the most by rising interest rates last year. TLT was down 32% in 2022! But, as you can see from the chart below, it looks like the bond market may have finally bottomed back in late October of last year. We would still stick with holding 3-5 year duration corporate bonds to maturity right now.
Marketsmith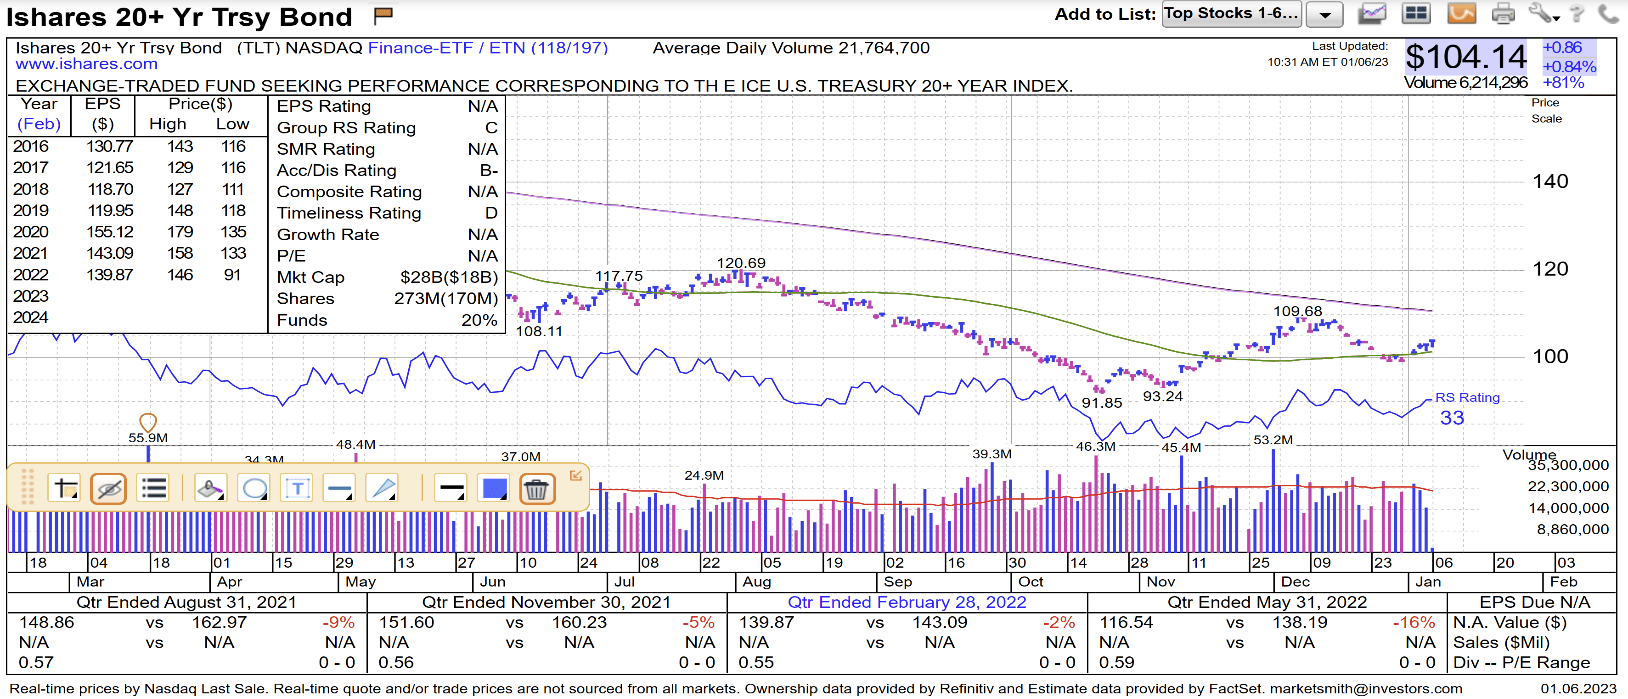
Last but not least, I have to mention the precious metals here. Gold has been stuck in the $1,800 per ounce area for a long, long time, but may be finally breaking out. As you can see from the chart below, gold is nearing a “golden-cross.” We have picked up a few precious metals stocks recently.
Marketsmith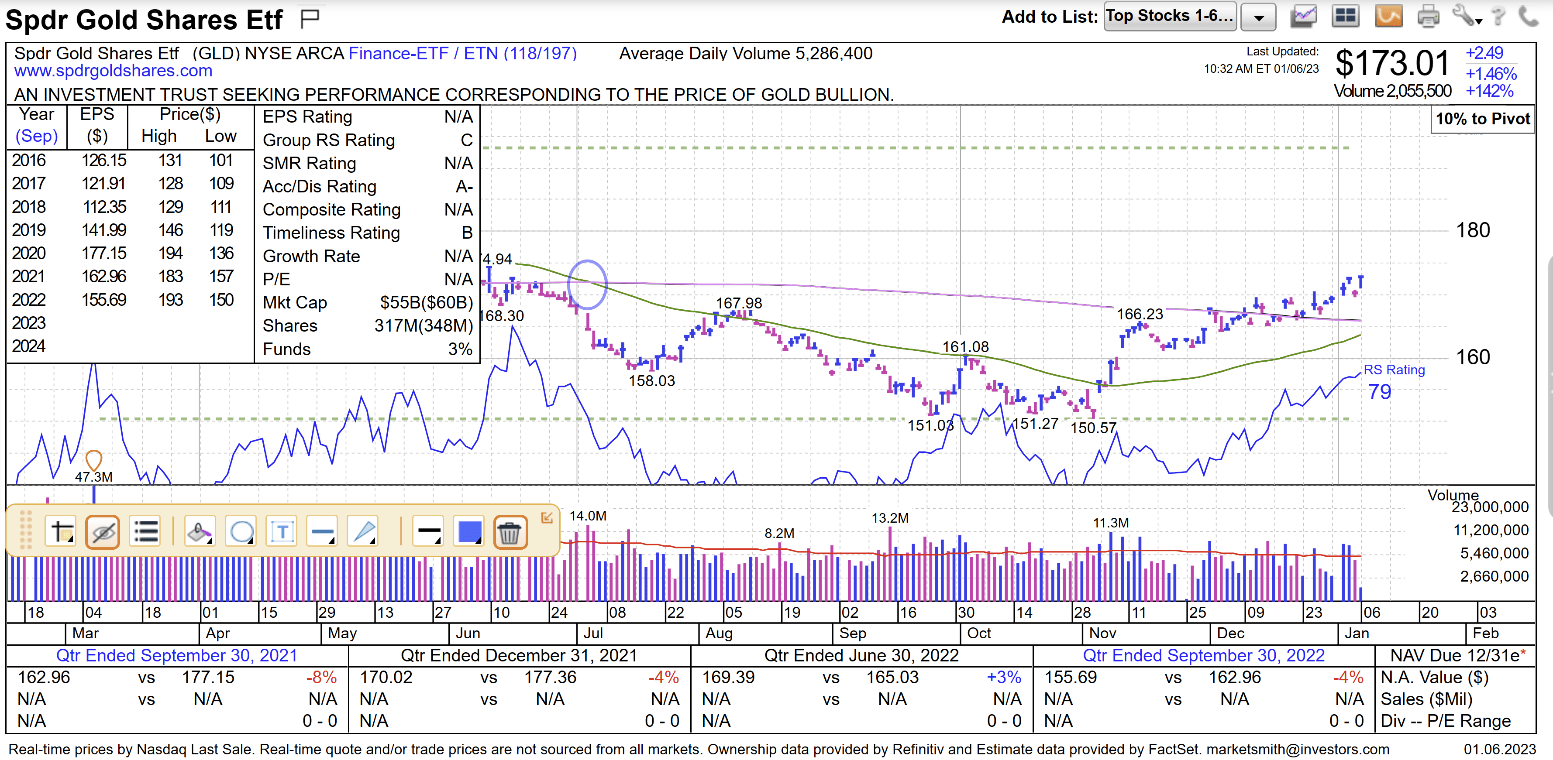
The U.S. dollar is finally weakening after topping out in late October of last year. A break below its support level could really set gold and silver prices off. With a record $32 trillion debt in America, it would seem that the dollar has to come under pressure at some point in the future.
Marketsmith
I will now finish our market outlook with the earnings picture for 2023 and 2024. S&P 500 earnings will come in at about $221 per share for 2022. This compares with $206 per share in earnings last year. We’re currently at an estimate of $228 per share for this year (2023) and $249 per share for 2024.
We’re not going to see a multiple of 23X again as we saw at the peak in early 2021. Rising interest rates have taken the froth off of that cup of zero interest rates by the Fed. We are now settling into a more normal multiple of 16-18X, which fits in closely with both the 5-year and 10-year averages. We are using 17X along with S&P 500 earnings of $249 to come up with a 12-month target price of just over 4,200 for the S&P 500.
The risk to earnings would be a recession or another black-swan event like COVID or the invasion of Ukraine by Russia. The risk to the multiple would be continued stubborn inflation and a continuation of the current rising interest rate environment. All in all, 2023 should be a lot better year for the market than 2022 was.
Be the first to comment