

richcano/E+ via Getty Images
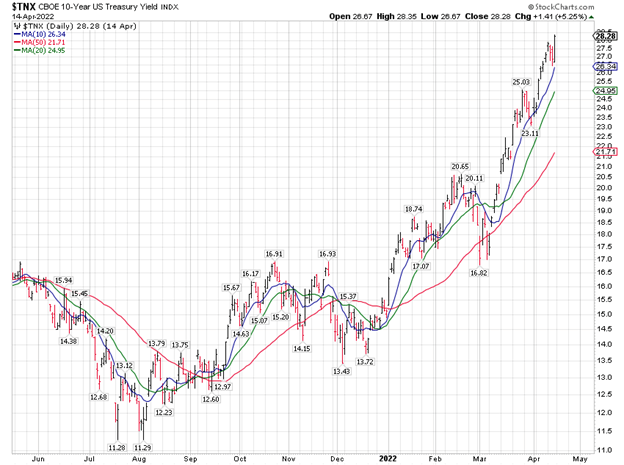
The last time the 10-year Treasury yield index touched its 20-day moving average was in early March, when the shell shock on the markets resulting from the Russian invasion of Ukraine was beginning to wear off. The war continues and looks like it will last quite a bit longer than investors originally expected. This causes problems for our inflation situation, as sanctions and a failed crop in the Ukraine are unlikely to worsen the inflation outlook, which ironically may mean a more aggressive Fed interest rate policy.
Graphs are for illustrative and discussion purposes only. Please read important disclosures at the end of this commentary.
The Fed may not be able to do anything about supply chain issues, but it sure can do something about demand, as rising mortgage rates and Treasury yields show. Mind you, quantitative tightening has not even started. Treasuries closed Thursday at 2.82%, which is just 43 basis points away from the high in the prior Fed tightening cycle in 2018 at 3.25%. Crossing 3.25% to the upside and getting traction over that level will mean that the 40-year downtrend in interest rates (since 1981) would be over.
In the past 40 years, Treasury yields have never risen above the high registered in a prior Fed tightening cycle. Doing so this time – and I am still not convinced it will happen – would be a momentous event.
The other side of this move in Treasury yields is that the next Fed meeting and coming QT announcement may mark a short-term top in Treasury yields, which this market is indicating may be closer to 3%.
Graphs are for illustrative and discussion purposes only. Please read important disclosures at the end of this commentary.
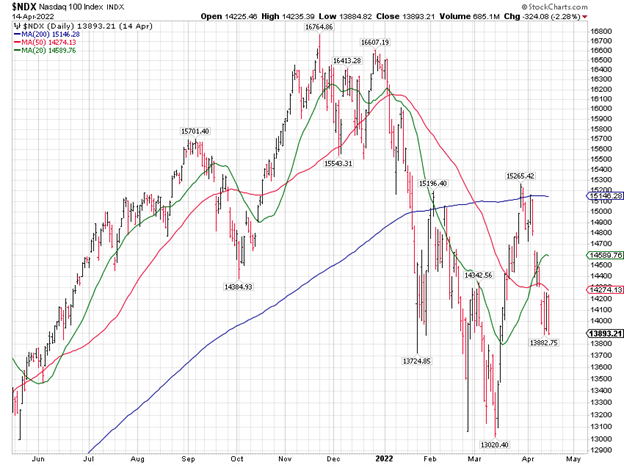
The momentum move in Treasury yields is beginning to affect the tech sector again, where in the past two weeks we saw the Nasdaq 100 Index trade down with two distinctive gap-down moves. (“Gap-downs” on a major index or liquid stock indicate selling pressure. “Gap-ups” indicate buying pressure.) Right now, Treasury yields are moving fast, which historically has been a problem for the technology sector.
As far as predicting the future goes, the Nasdaq 100 delivered a perfect upside target on the rebound, which ended at its 200-day moving average (see my column from March 1: “3-1-22: The Stock Market Delivers a Successful Retest”). A perfect downside target on the present swing lower would be 13,000.
The High-Yield Market Spread Still Reflects a Healthy Economy
I was surprised to see that the latest print available on the high-yield master index was a spread of only 368 basis points to Treasuries. That’s a healthy (“inside 400”) number that signifies a healthy economy.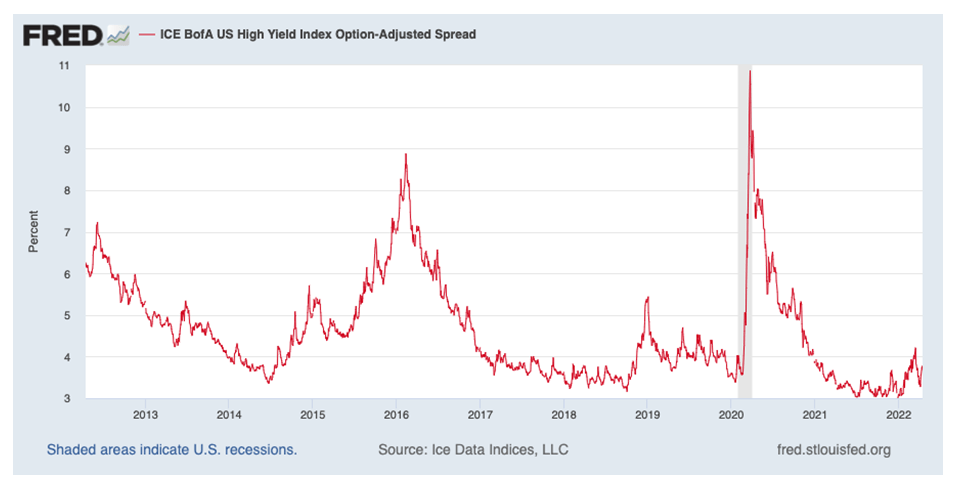
Graphs are for illustrative and discussion purposes only. Please read important disclosures at the end of this commentary.
I think junk bond spreads are headed higher since the Fed has stated that it wants to restrain aggregate demand in order to slow the economy. A “soft landing” is when the Fed manages to engineer a slowdown without a recession, while a “hard landing” ends in a recession. In any landing, there is some slowdown in demand, which means there will be more selling in junk bonds, which generally love a strong economy.
In the last Fed tightening in 2018, junk bond spreads topped out at 544 basis points. In the 2016 Chinese slowdown, they almost made it to 900. In both cases, there was no recession in the U.S. A good estimate would be that with a soft landing, we would be looking for junk bond spreads to end up in the 544-900 bps range, quite a bit away from present levels. With a hard landing, that number would be higher.
All content above represents the opinion of Ivan Martchev of Navellier & Associates, Inc.
Disclosure: *Navellier may hold securities in one or more investment strategies offered to its clients.
Disclaimer: Please click here for important disclosures located in the “About” section of the Navellier & Associates profile that accompany this article.
Be the first to comment