

SIphotography/iStock via Getty Images
Can I beat the market using dividend growth investing?
Is dividend growth investing (“DGI”) a strategy that is likely to outperform the broader markets? On average, the answer is “no” if you are talking about price performance and “yes” if you are talking about income growth.
Using PortfolioVisualizer.com, I compared the total performance of six of the top dividend growth ETFs against the Vanguard Total Stock Market ETF (VTI) over the entire lifetime of each dividend growth fund. I also compared the starting and ending dividend income for each dividend growth fund verses (VTI). In all cases, I assumed dividends are reinvested.
Here are my findings.
(1) The WisdomTree US Quality Dividend Growth ETF (DGRW). According to PortfolioVisualizer, (DGRW)’s annual performance trails the annual performance of (VTI) by just .27% per year since inception.
(DGRW) Returns vs. Market (Portfoliovisualizer.com)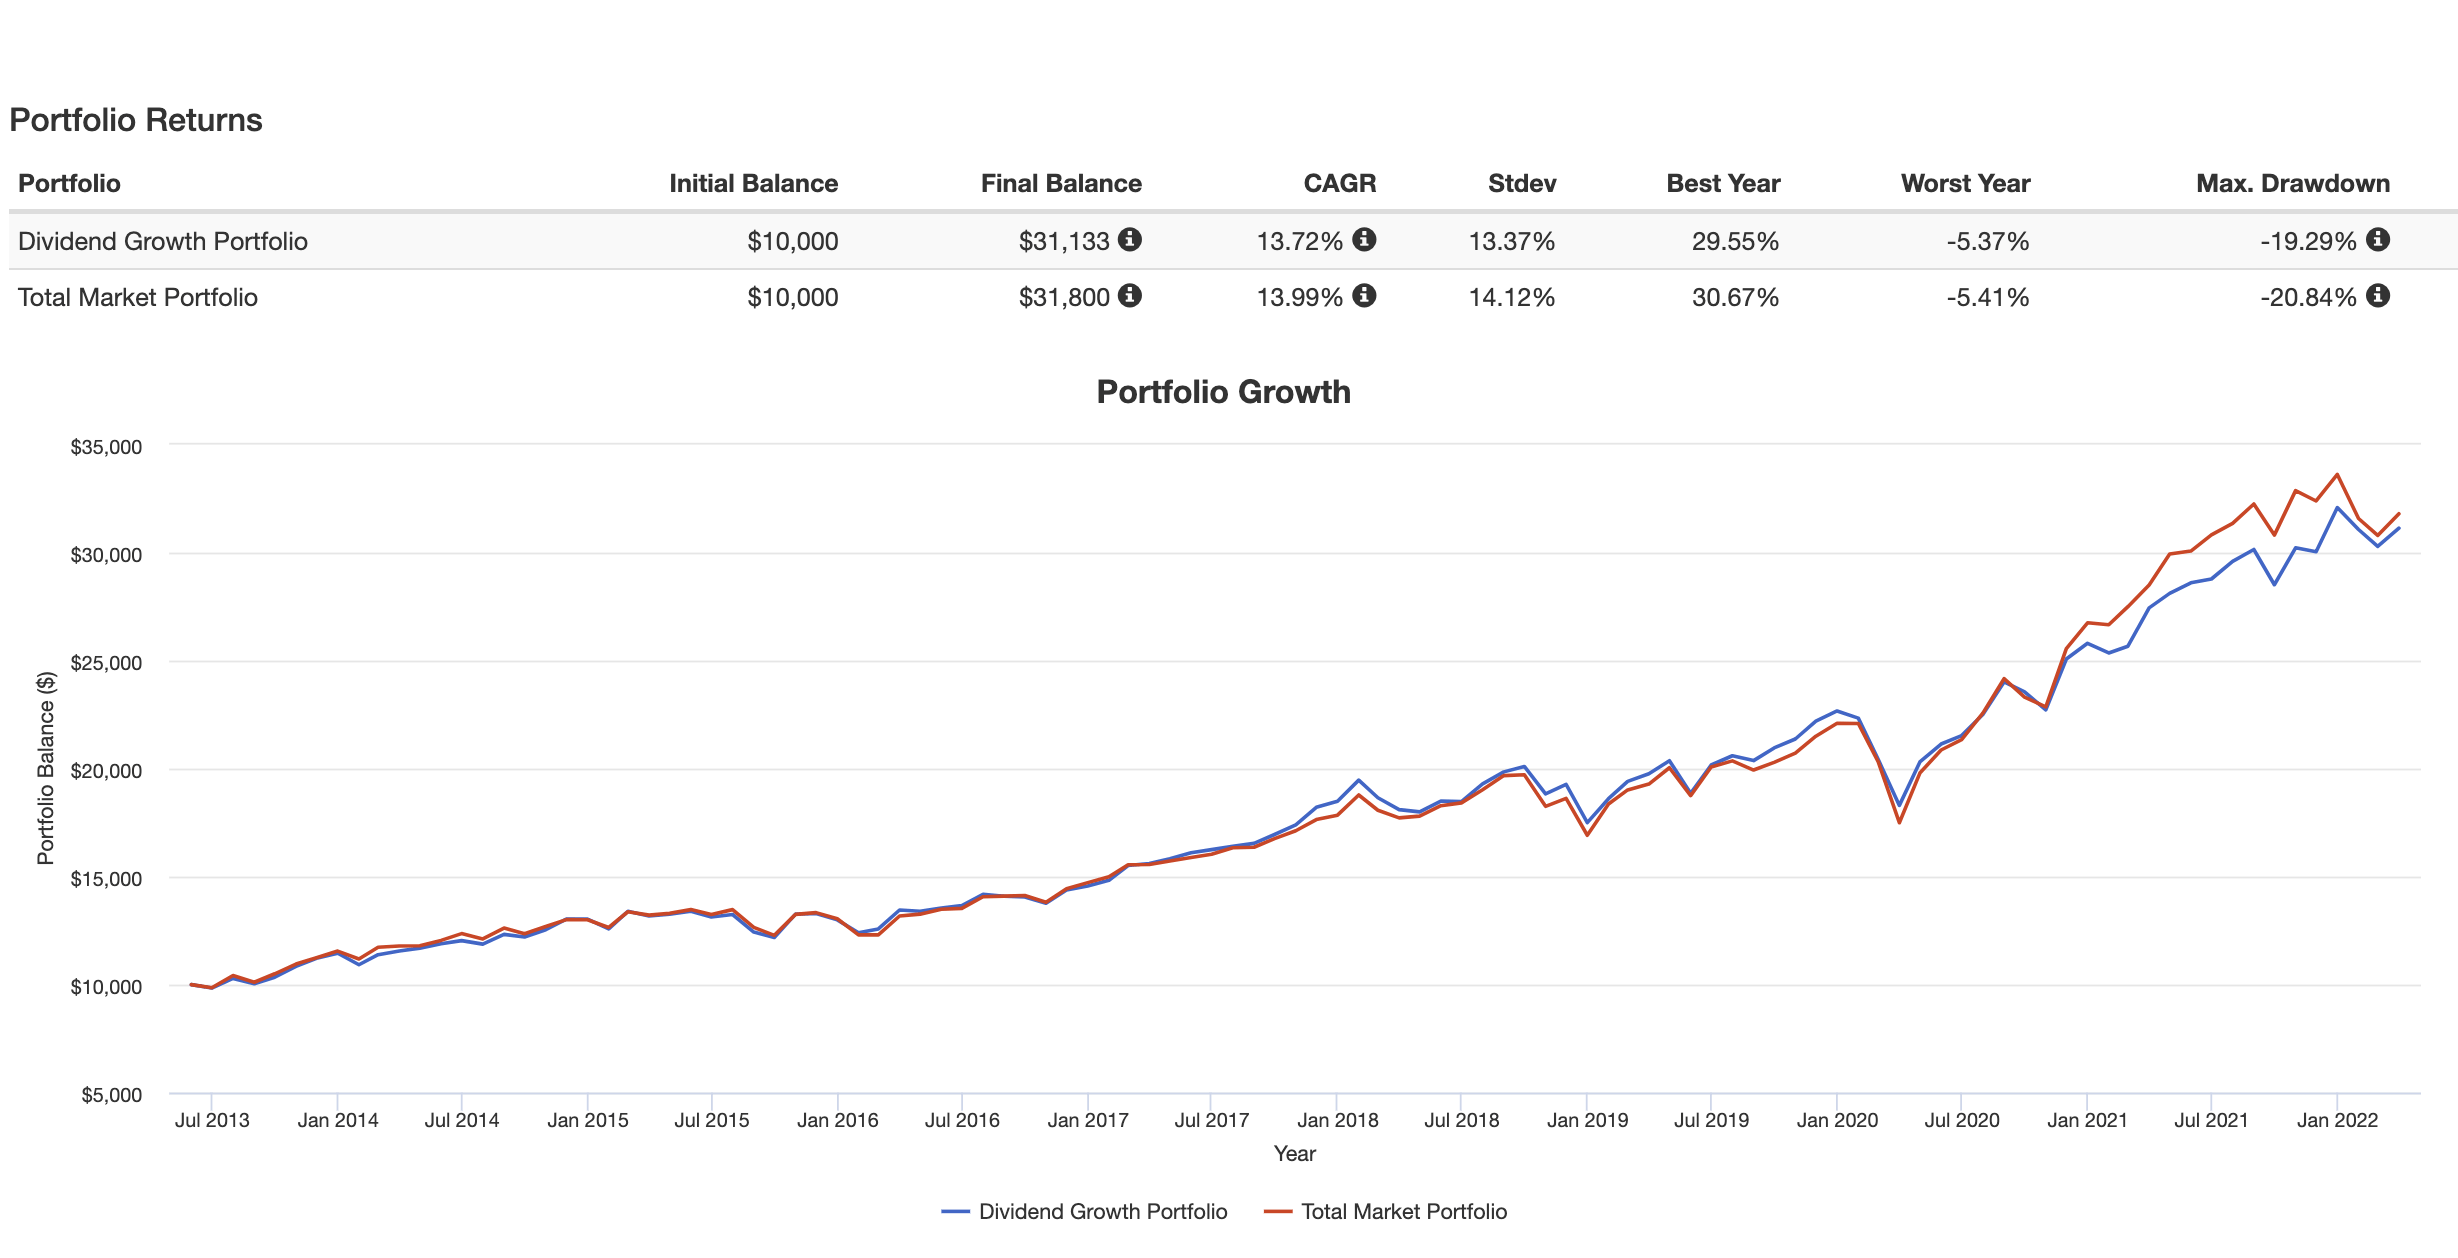
But a $10,000 investment in (DGRW) that yielded $231 for the fund’s first full year in 2014 would produce over $544 dollars of annual dividend income by year 2021. That’s an 11.3% annual income growth rate for the (DGRW) portfolio, compared to dividend growth of 7.5% for (VTI) over the same time period.
(DGRW) Income Growth (Portfoliovisualizer.com)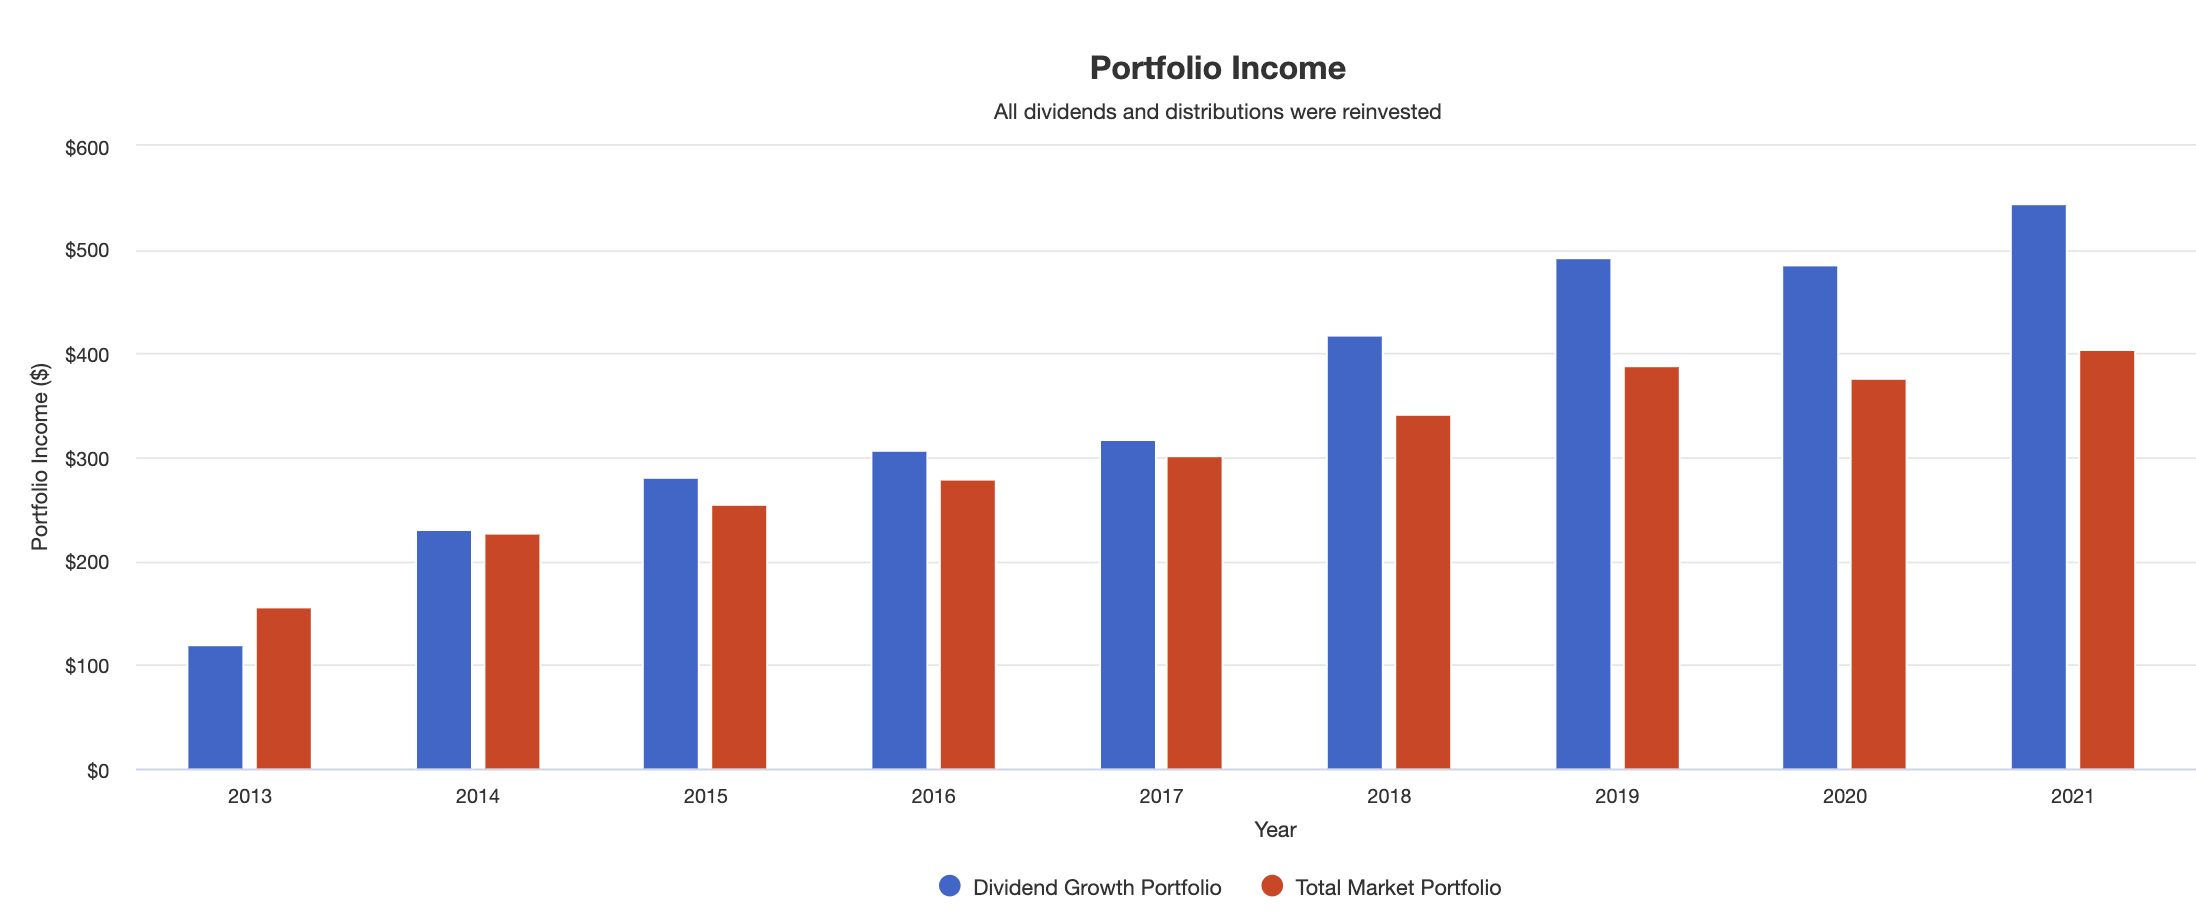
(2) The Schwab US Dividend Equity ETF (SCHD). According to PortfolioVisualizer, (SCHD)’s annual performance trails the annual performance of (VTI) by just .21% per year since inception.
(SCHD) Returns (Portfoliovisualizer.com)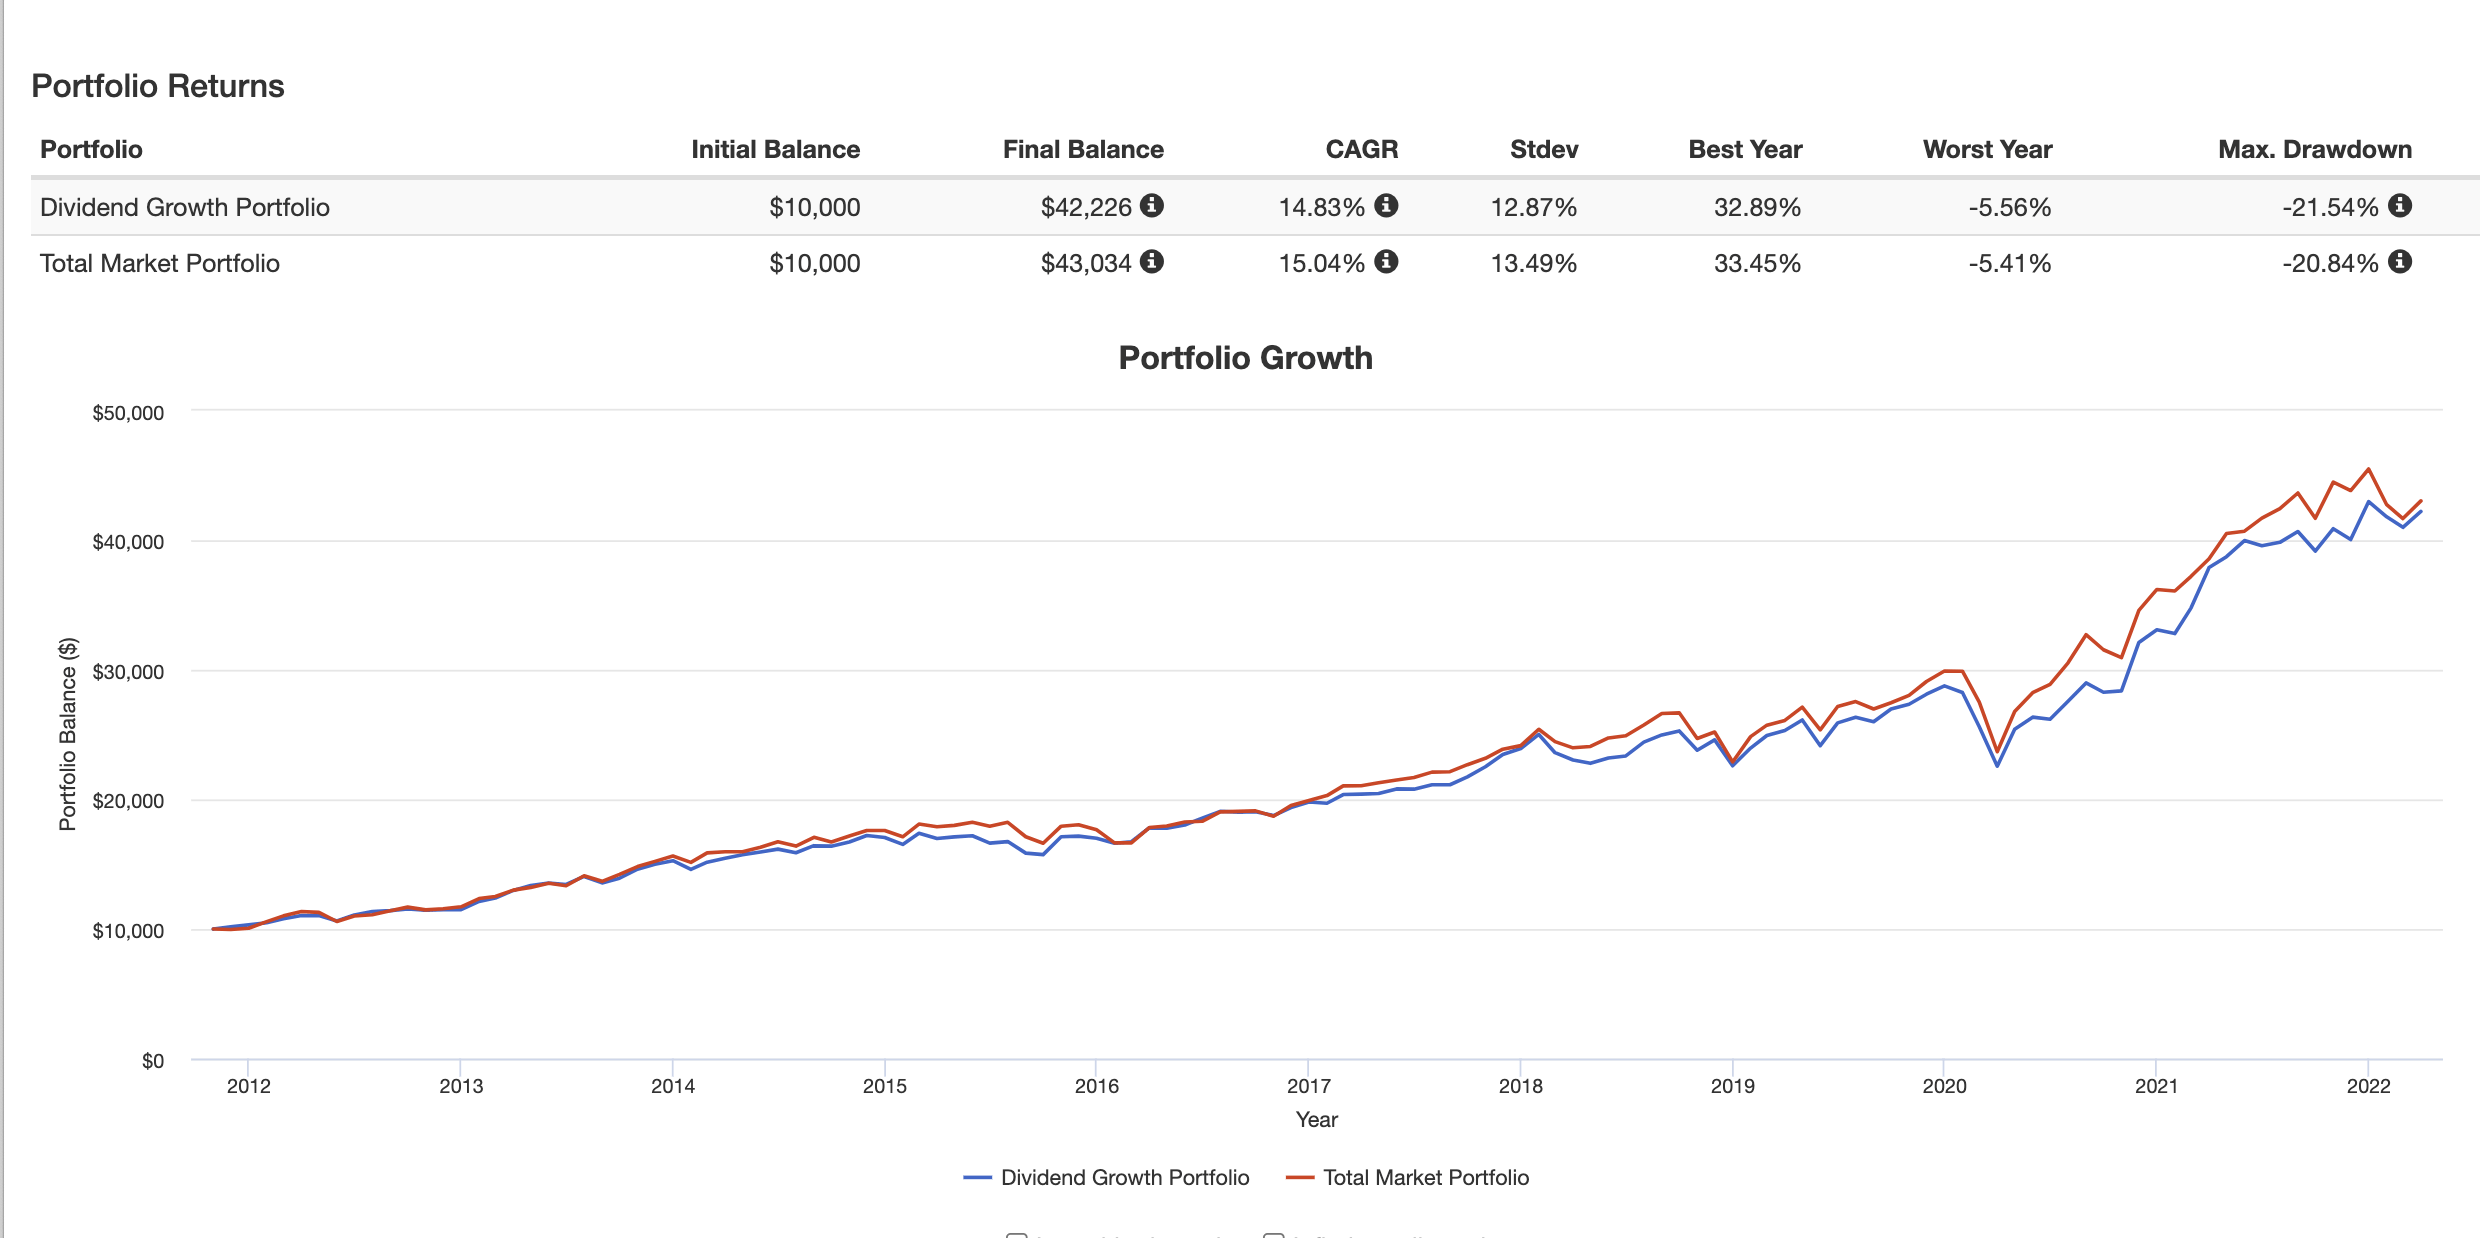
But a $10,000 investment in (SCHD) that yielded $323 per year by 2012 would produce over $1,174 dollars of annual dividend income by year 2021. That’s a 13.77% annual income growth rate for the (SCHD) portfolio, compared to dividend growth of 8.29% for (VTI) over the same time period.
(SCHD) Income growth (Portfoliovisualizer.com)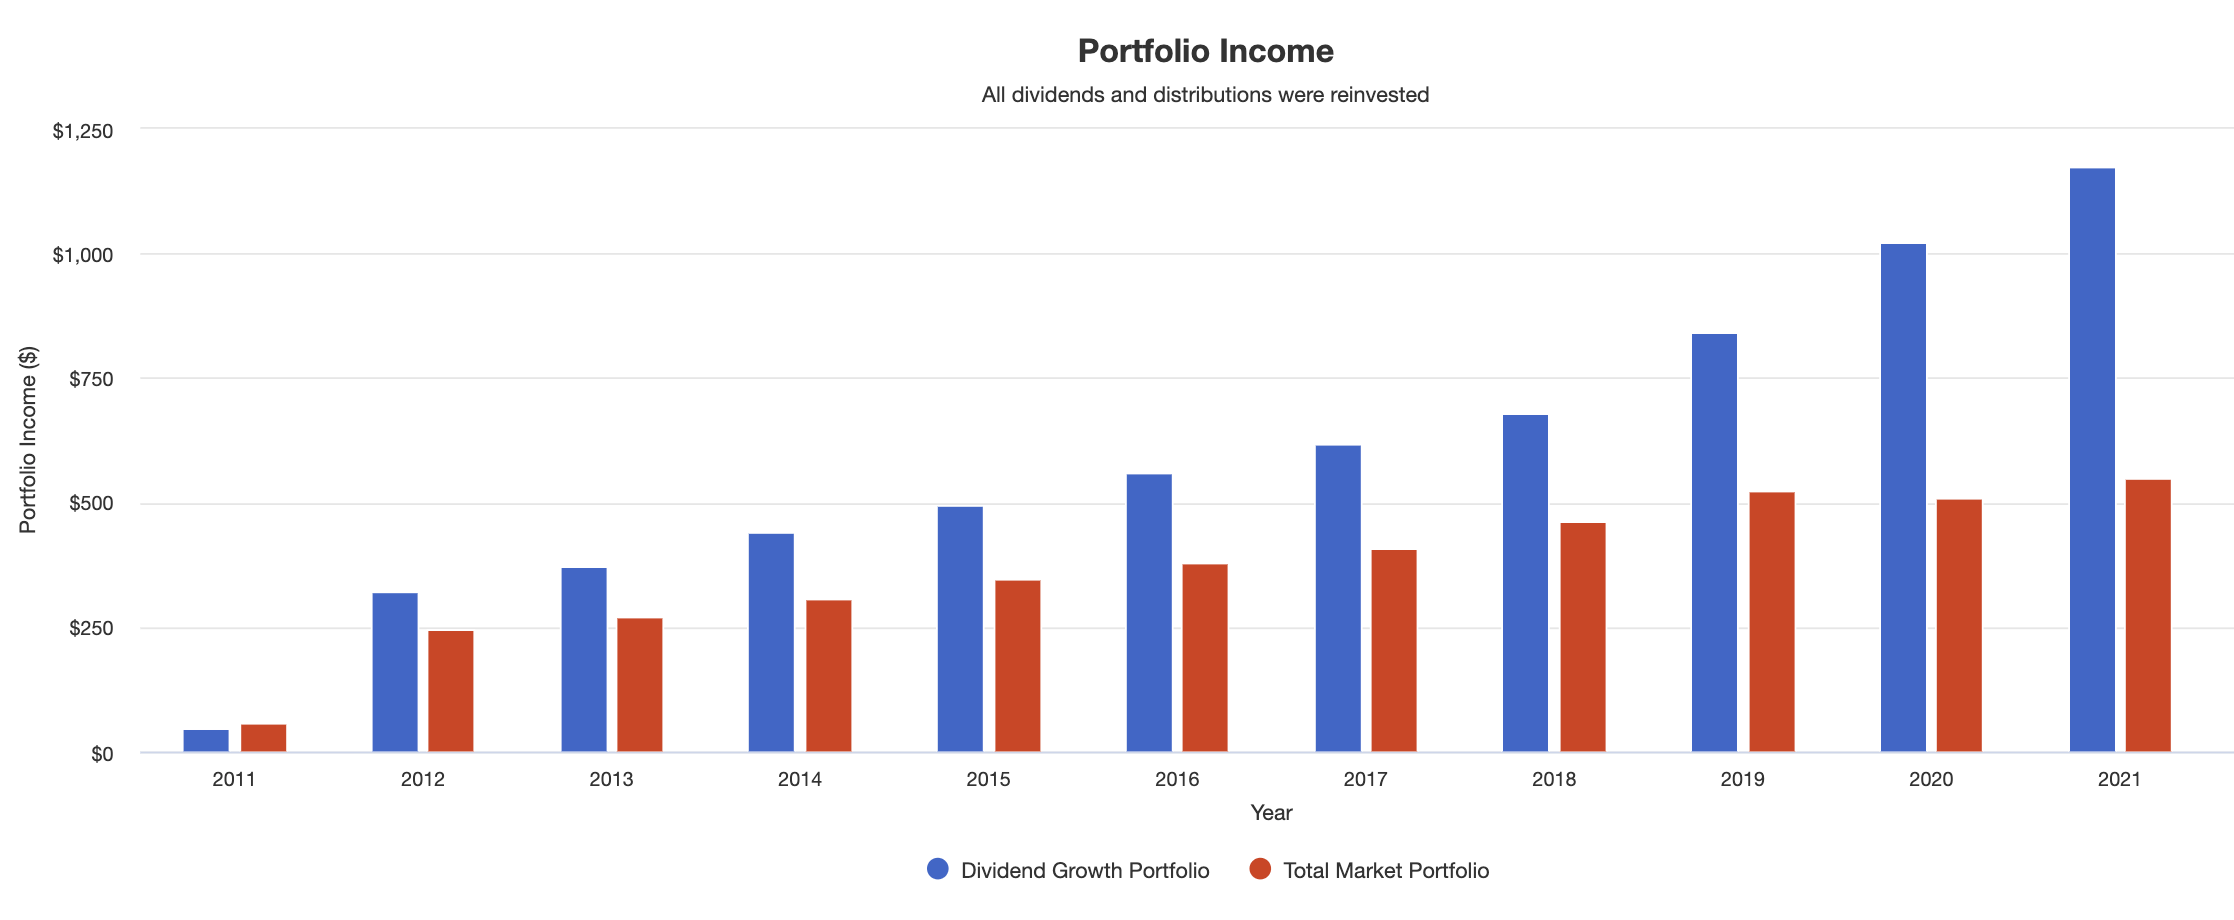
(3) The Vanguard Dividend Appreciation ETF (VIG). According to PortfolioVisualizer, (VIG)’s annual performance trails the annual performance of (VTI) by .49% per year since inception.
(VIG) Returns (Portfoliovisualizer.com)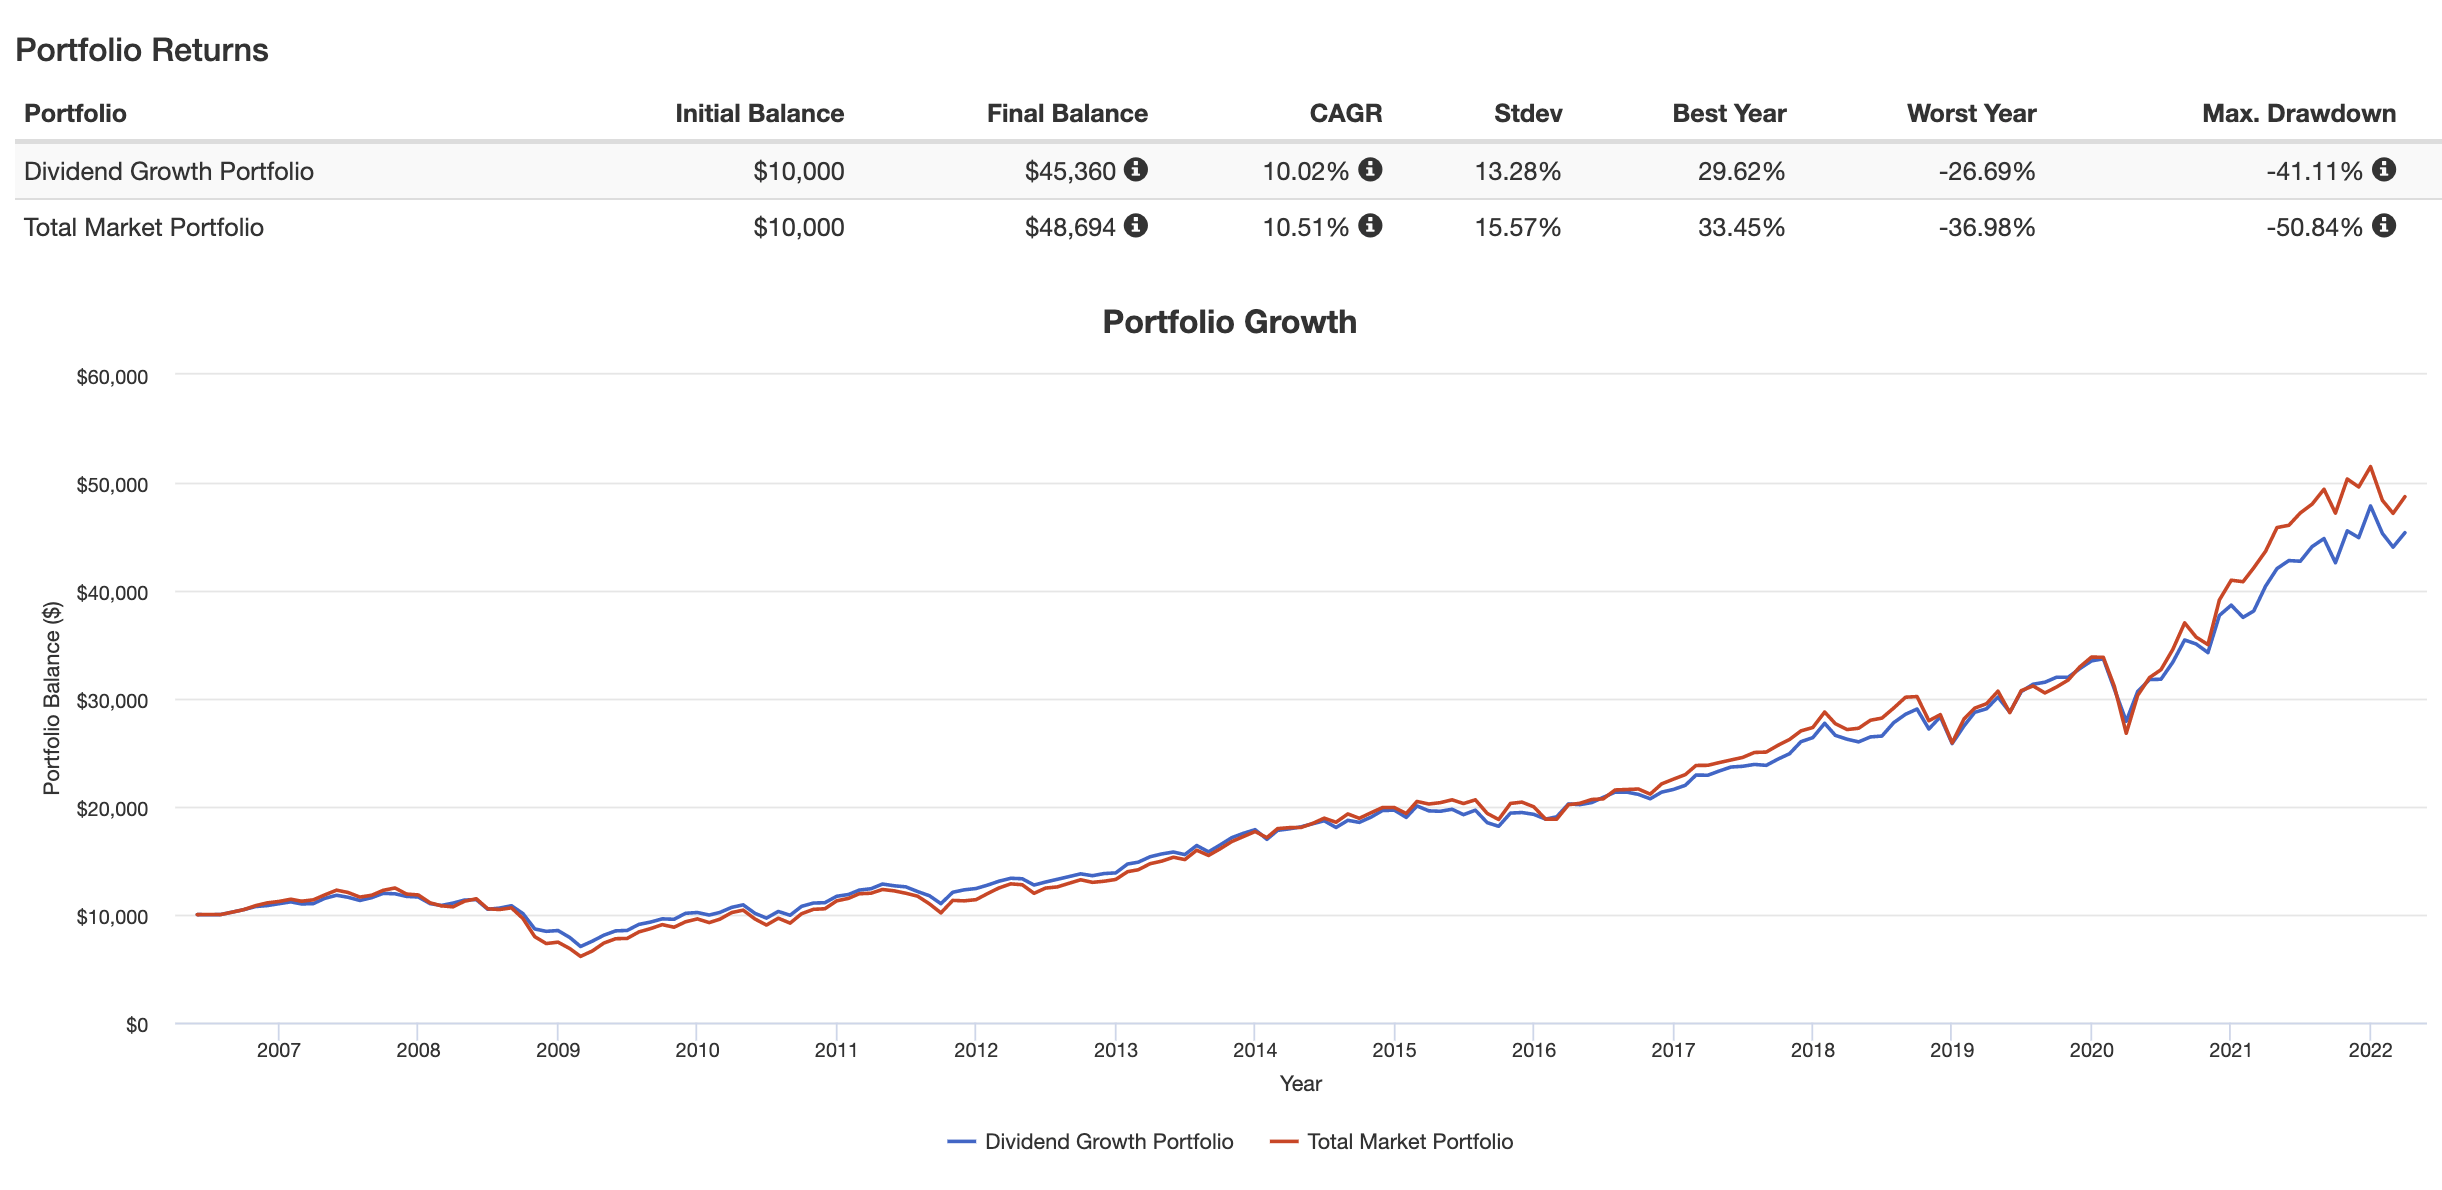
But a $10,000 investment in (VIG) that yielded $180 per year starting in 2007 would produce over $733 dollars of annual dividend income by year 2021. That’s a 9.81% annual income growth rate for the (VIG) portfolio, compared to dividend growth of 7.52% for (VTI) over the same time period.
(VIG) Income Growth (Portfoliovisualizer.com)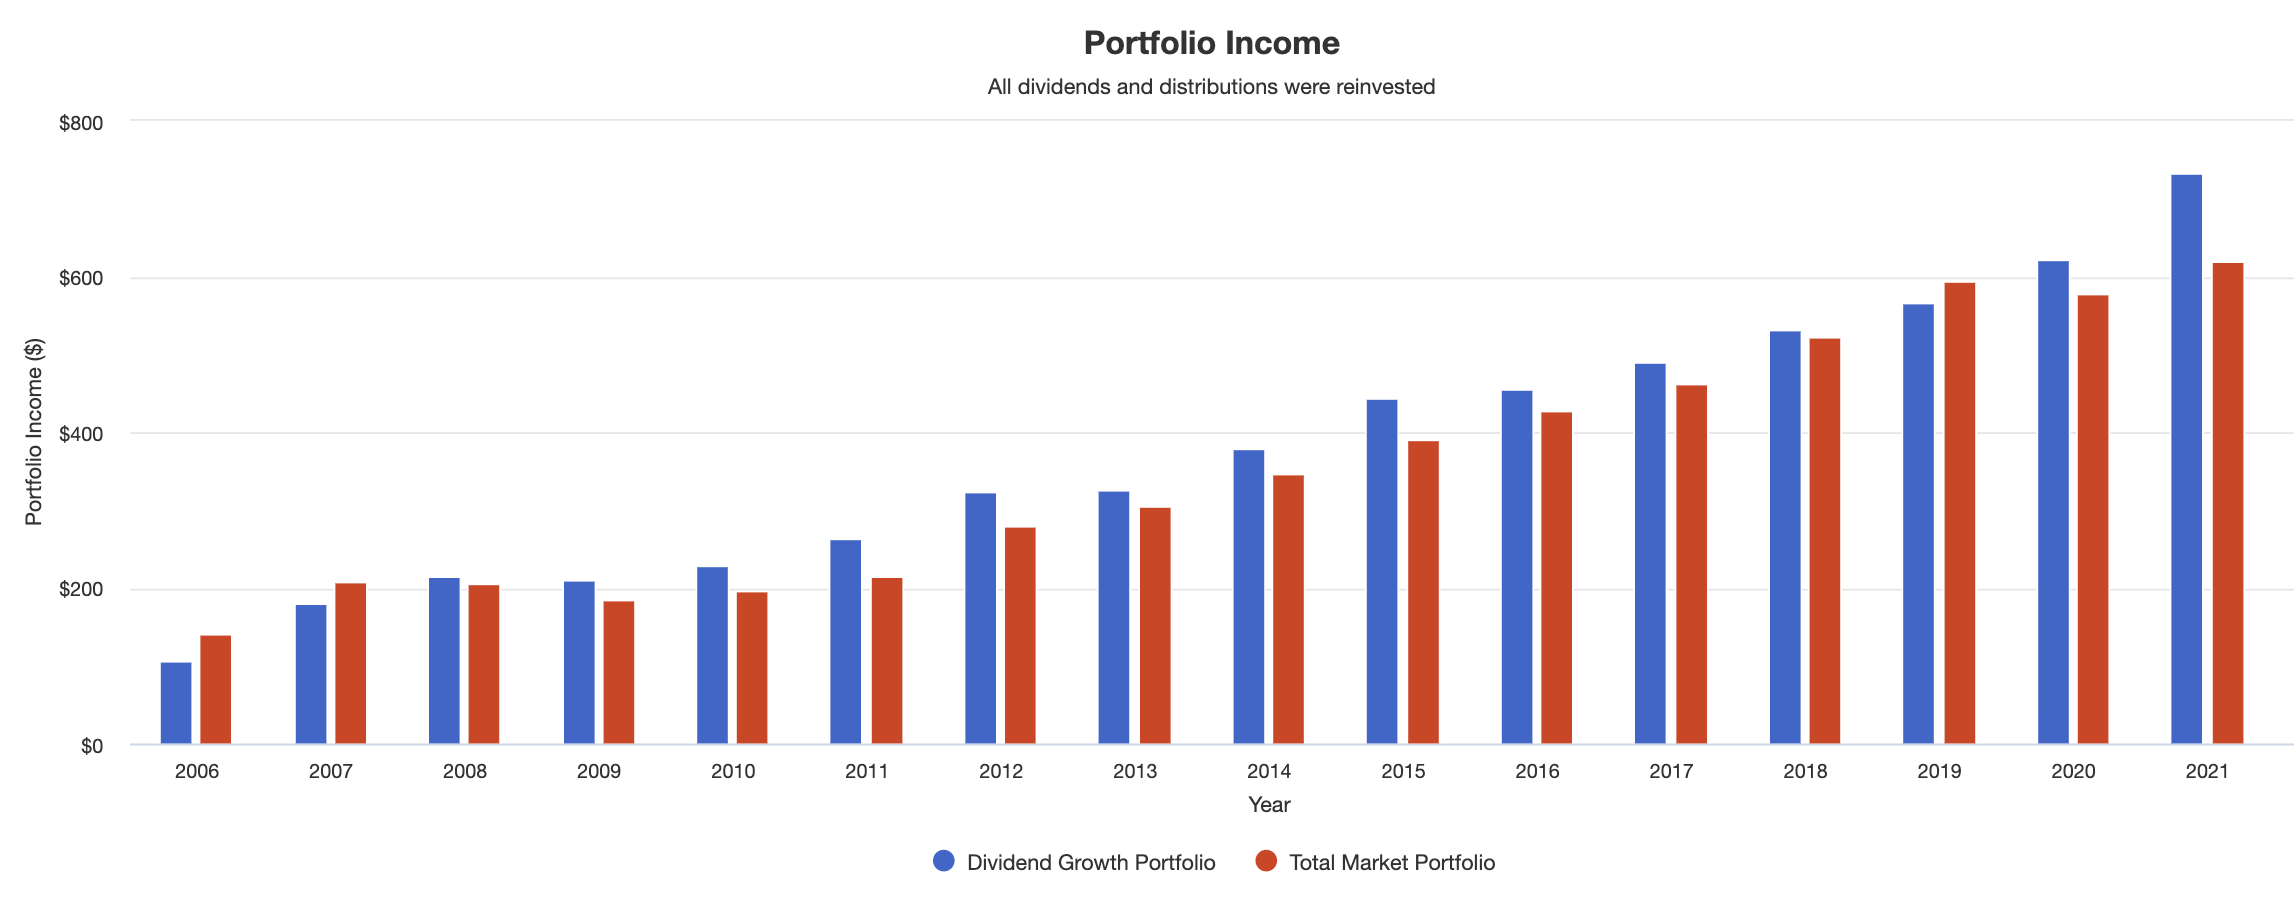
(4) The ProShares S&P 500 Dividend Aristocrats ETF (NOBL). According to PortfolioVisualizer, (NOBL)’s annual performance trails the annual performance of (VTI) by 1.39% per year since inception.
(NOBL) Returns (Portfoliovisualizer.com)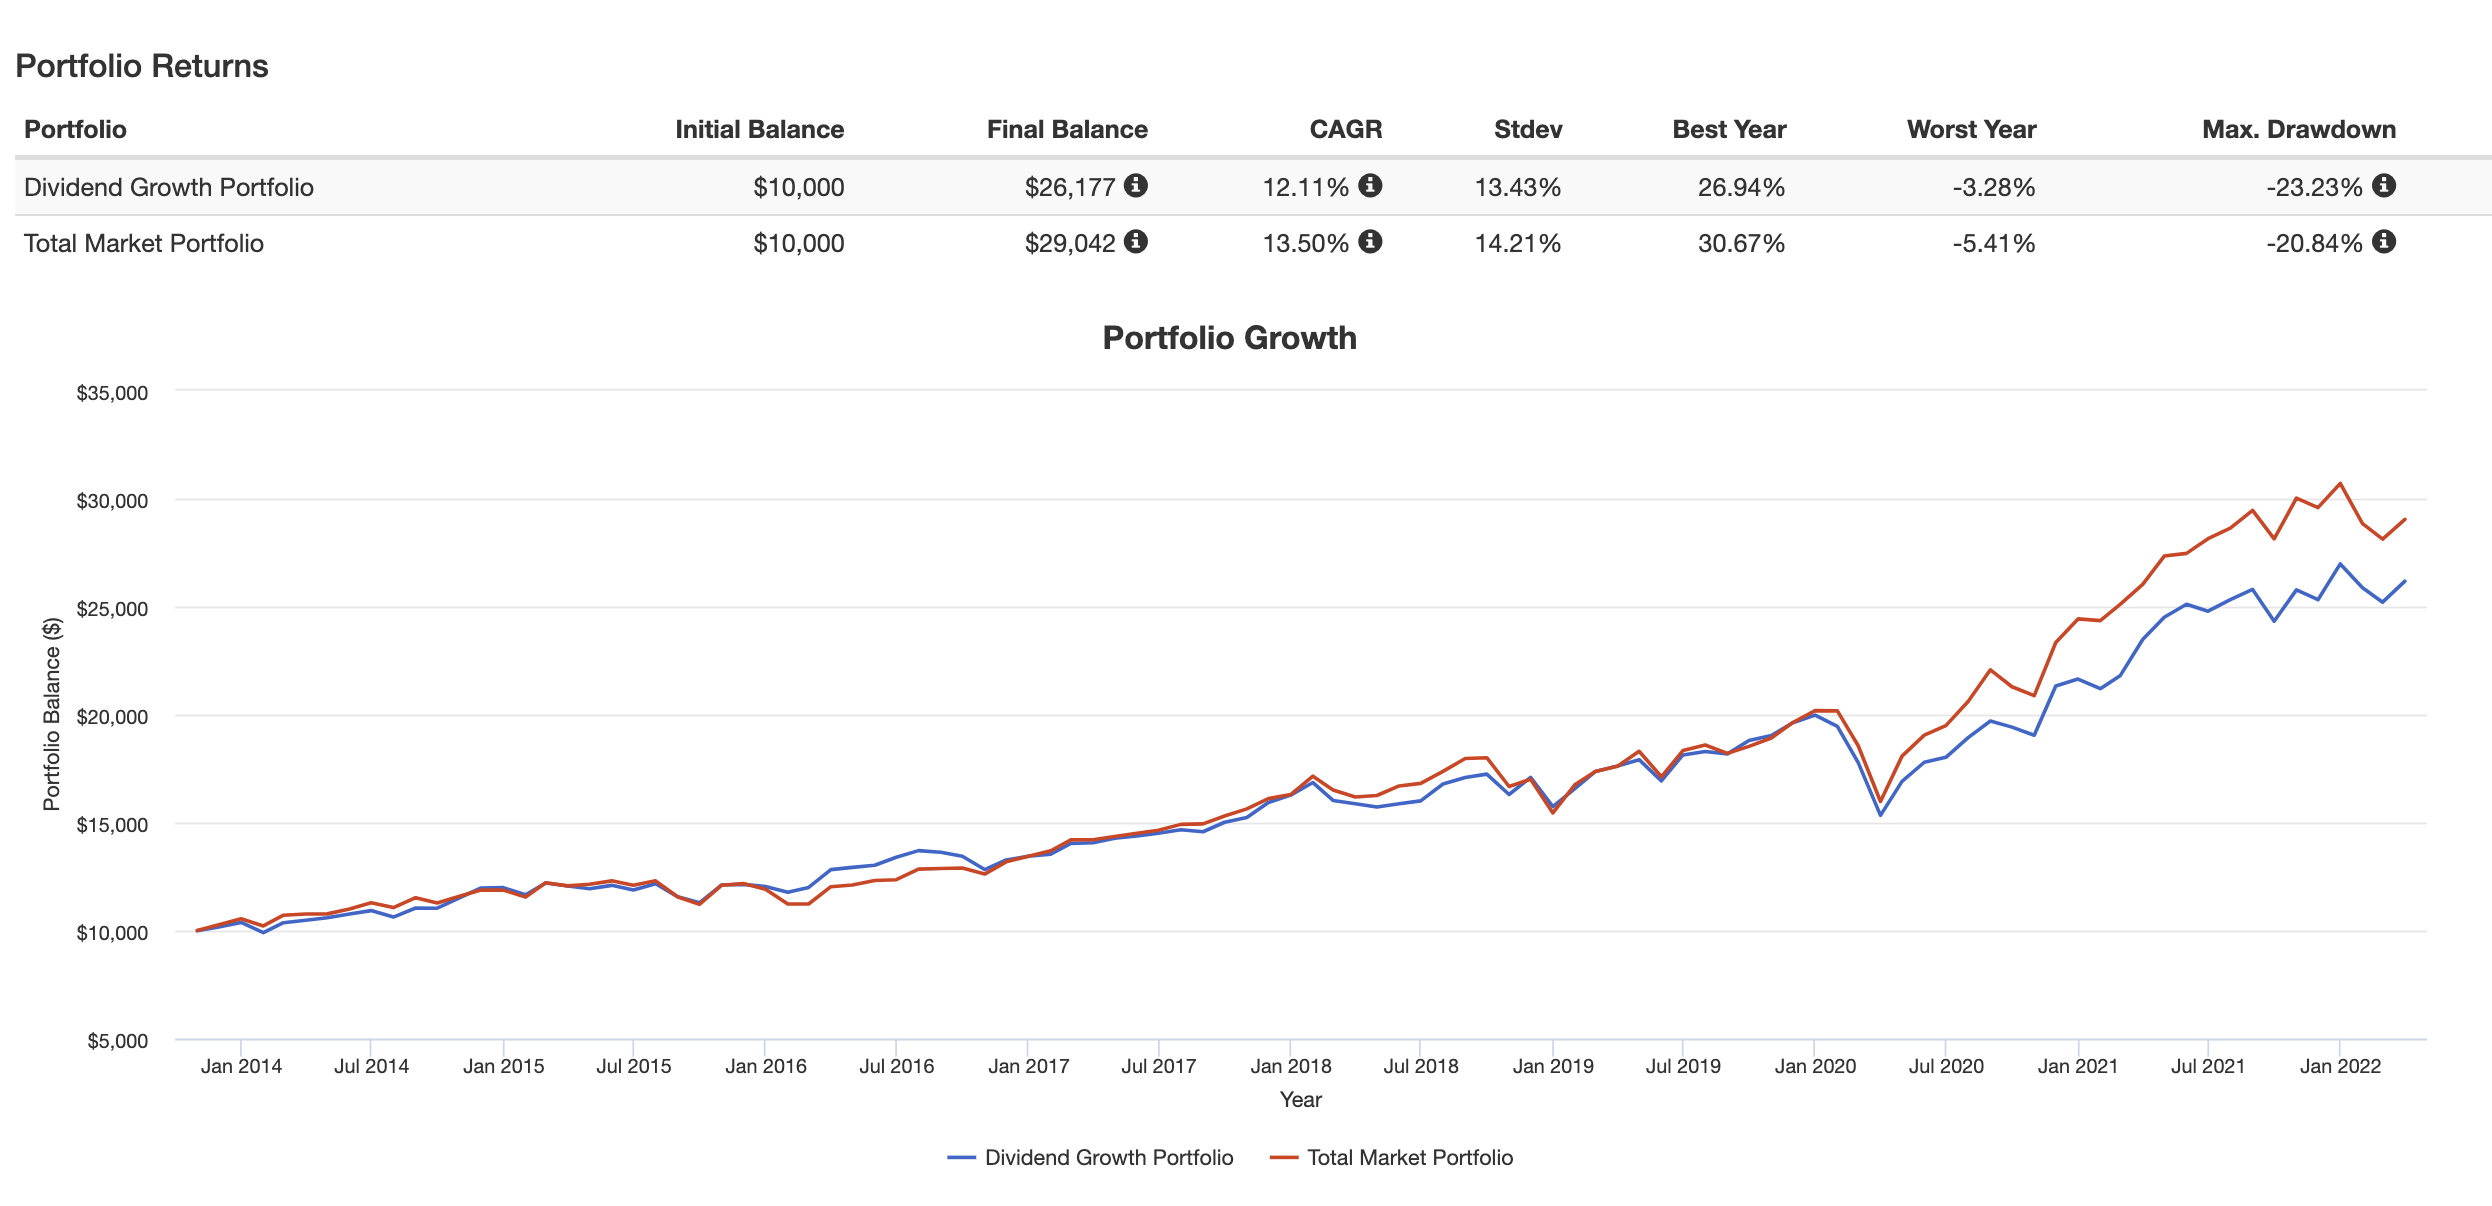
Not only that, but a $10,000 investment in (NOBL) that yielded $189 per year starting in 2014 would produce over $334 dollars of annual dividend income by year 2021. That’s a 7.38% annual income growth rate for the (NOBL) portfolio, which trails the dividend growth rate of 7.53% for (VTI) over the same time period.
(NOBL) Income Growth (Portfoliovisualizer.com)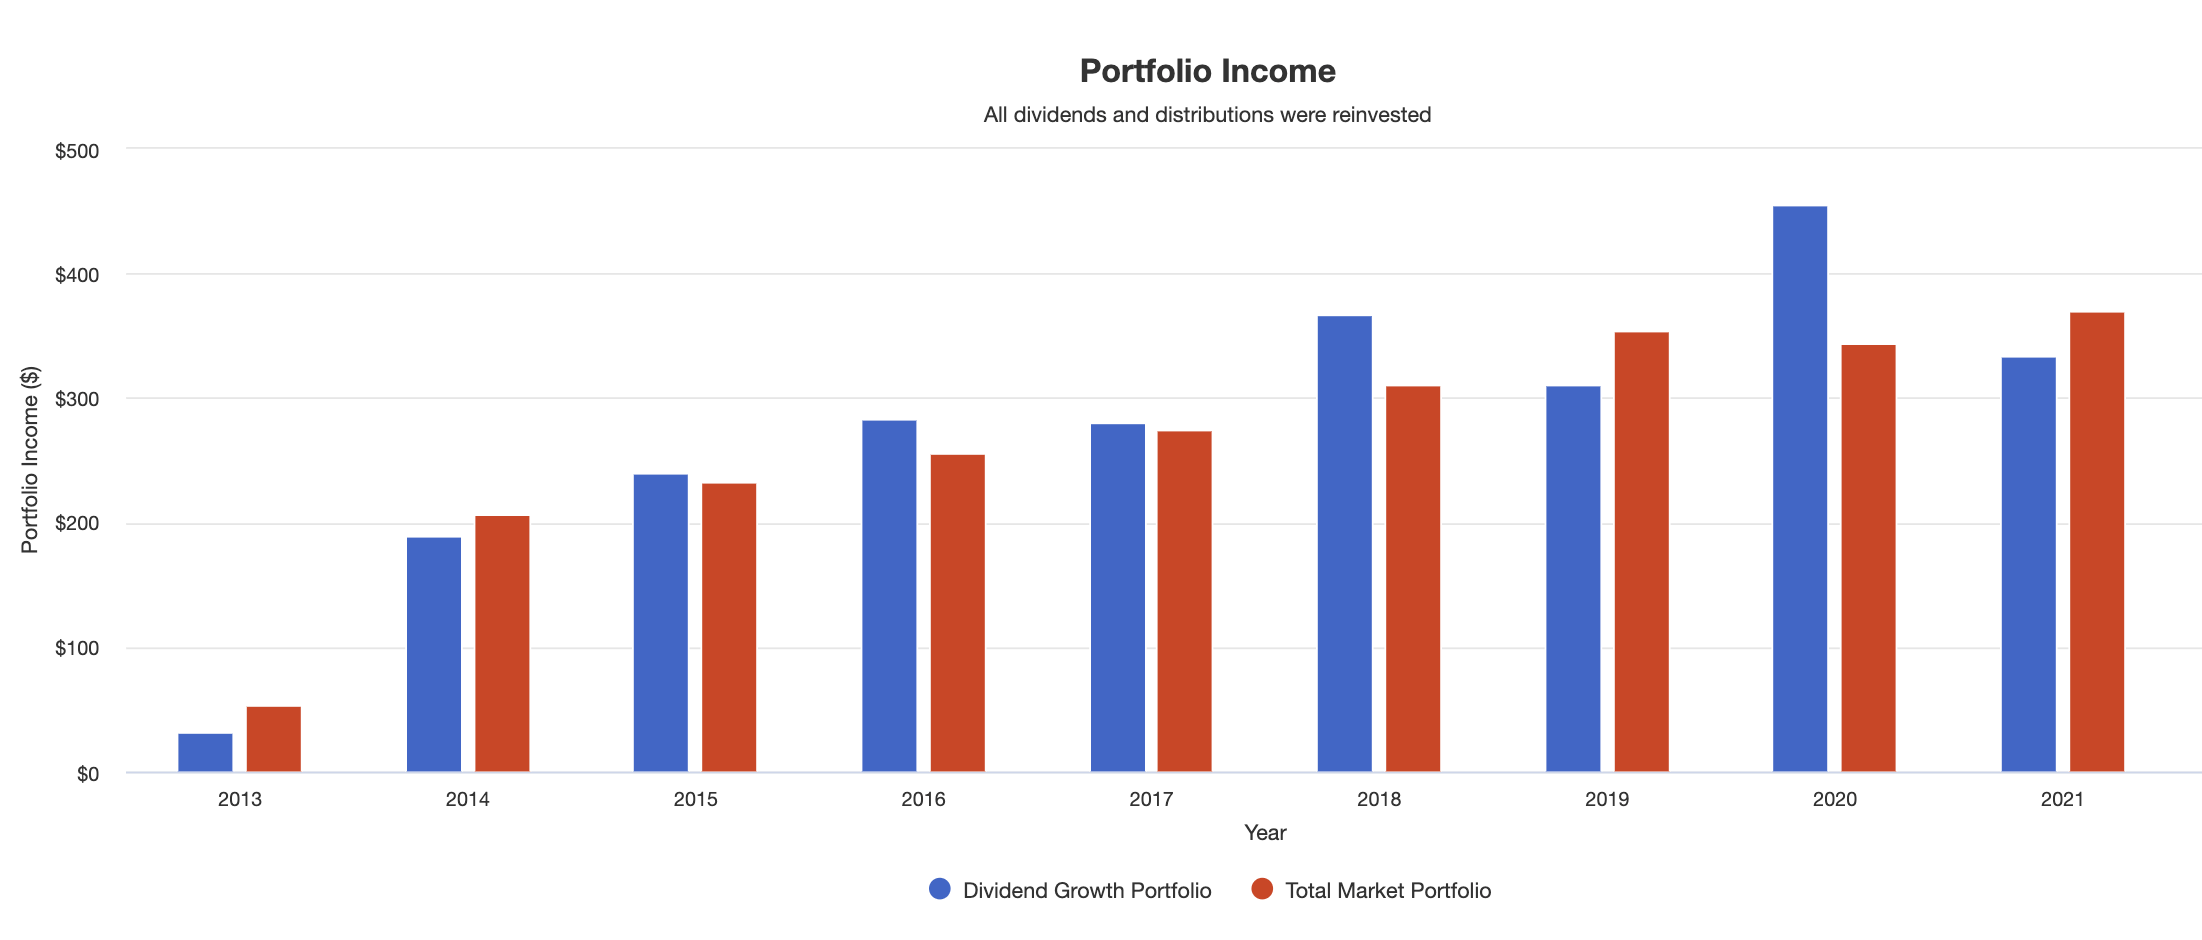
(5) The SPDR S&P Dividend ETF (SDY). According to PortfolioVisualizer, (SDY)’s annual performance trails the annual performance of (VTI) by .95% per year since inception.
(SDY) Returns (Portfoliovisualizer.com)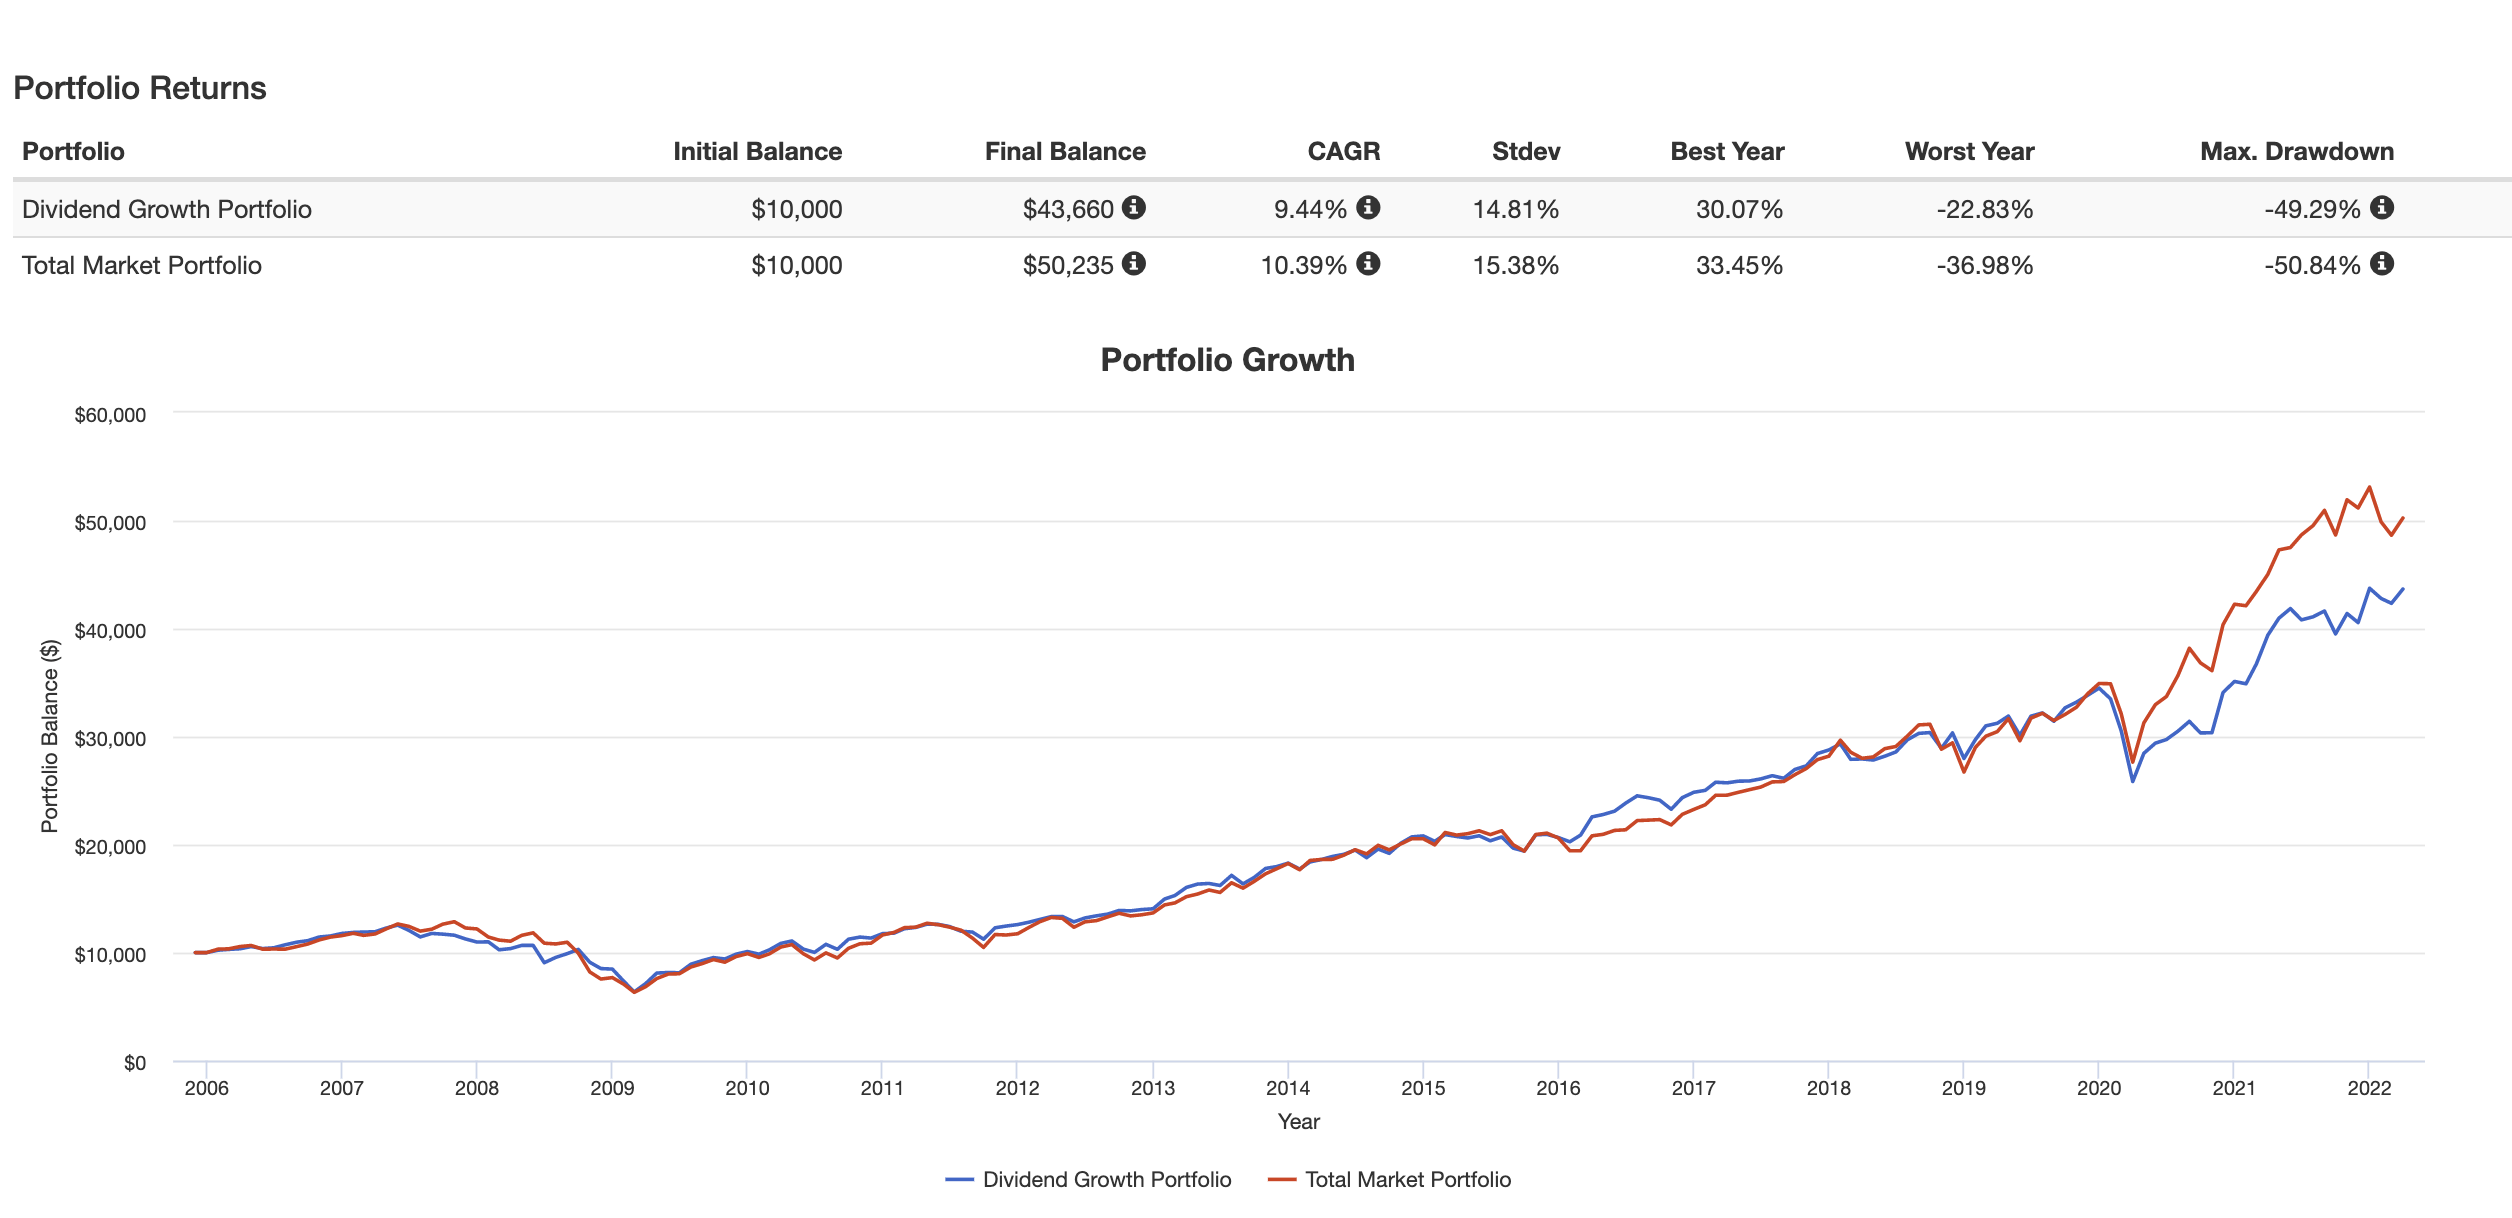
Not only that, but a $10,000 investment in (SDY) that yielded $331 per year starting in 2006 would produce over $878 dollars of annual dividend income by year 2021. That’s a 6.29% annual income growth rate for the (SDY) portfolio, which trails the dividend growth rate of 7.95% for (VTI) over the same time period. The (SDY) portfolio also shows very significant swings in portfolio income since the fund’s launch date.
(SDY) Income Growth (Portfoliovisualizer.com)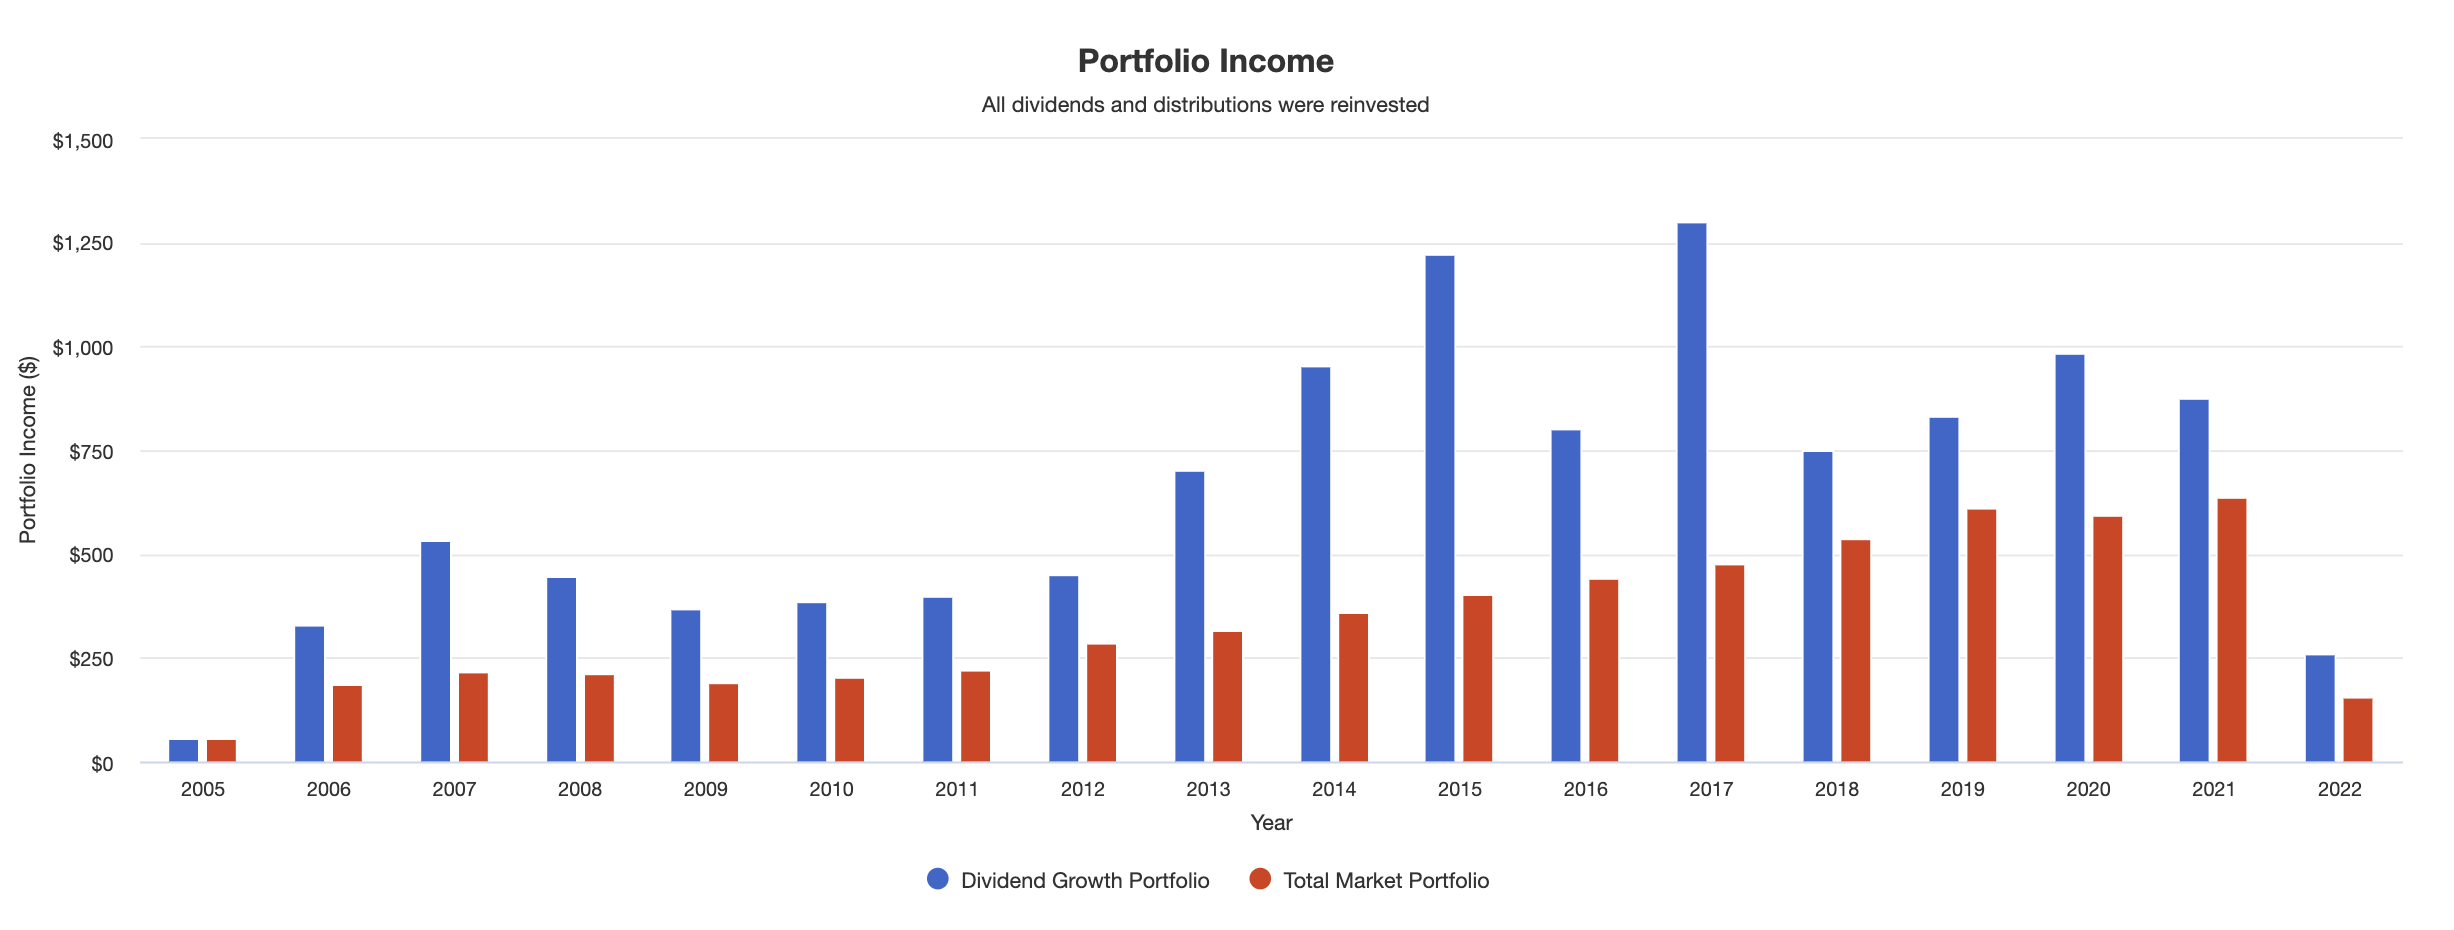
(6) The Ishares Dividend Select ETF (DVY). According to PortfolioVisualizer, (DVY)’s annual performance very substantially trails the annual performance of (VTI) by 1.59% per year since inception.
(DVY) Returns (PortfolioVisualizer.com)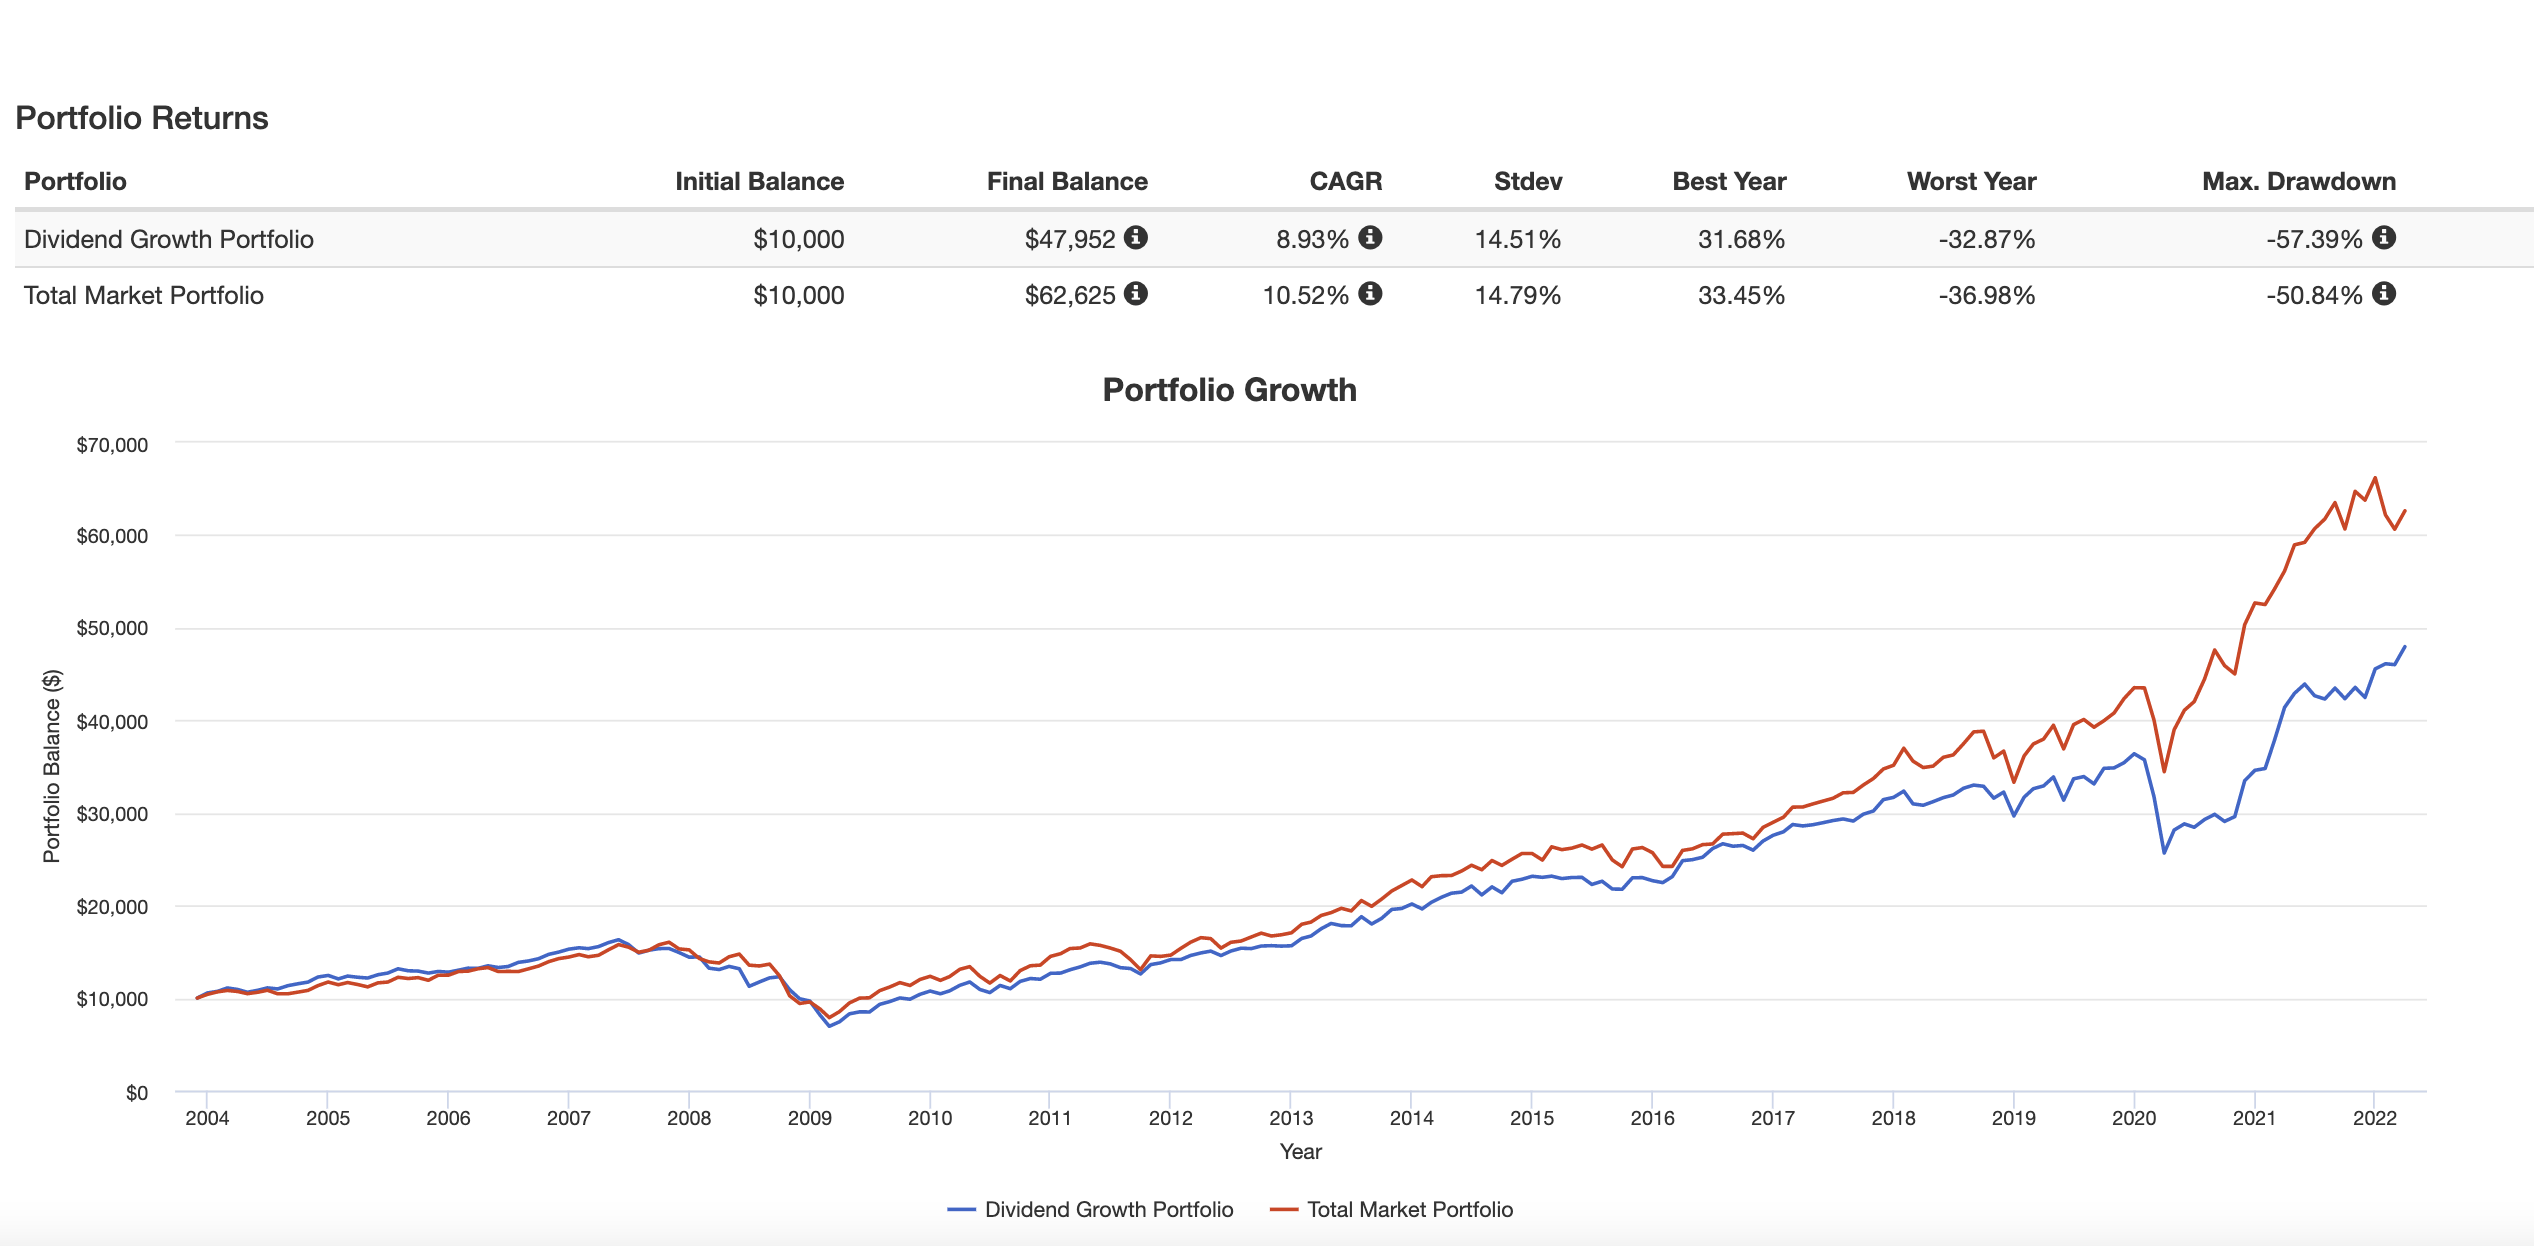
Not only that, but a $10,000 investment in (DVY) that yielded $378 per year starting in 2005 would produce over $1392 dollars of annual dividend income by year 2021. That’s a 7.51% annual income growth rate for the (DVY) portfolio, which trails the dividend growth rate of 8.39% for (VTI) over the same time period.
(DVY) Income Growth (Portfoliovisualizer.com)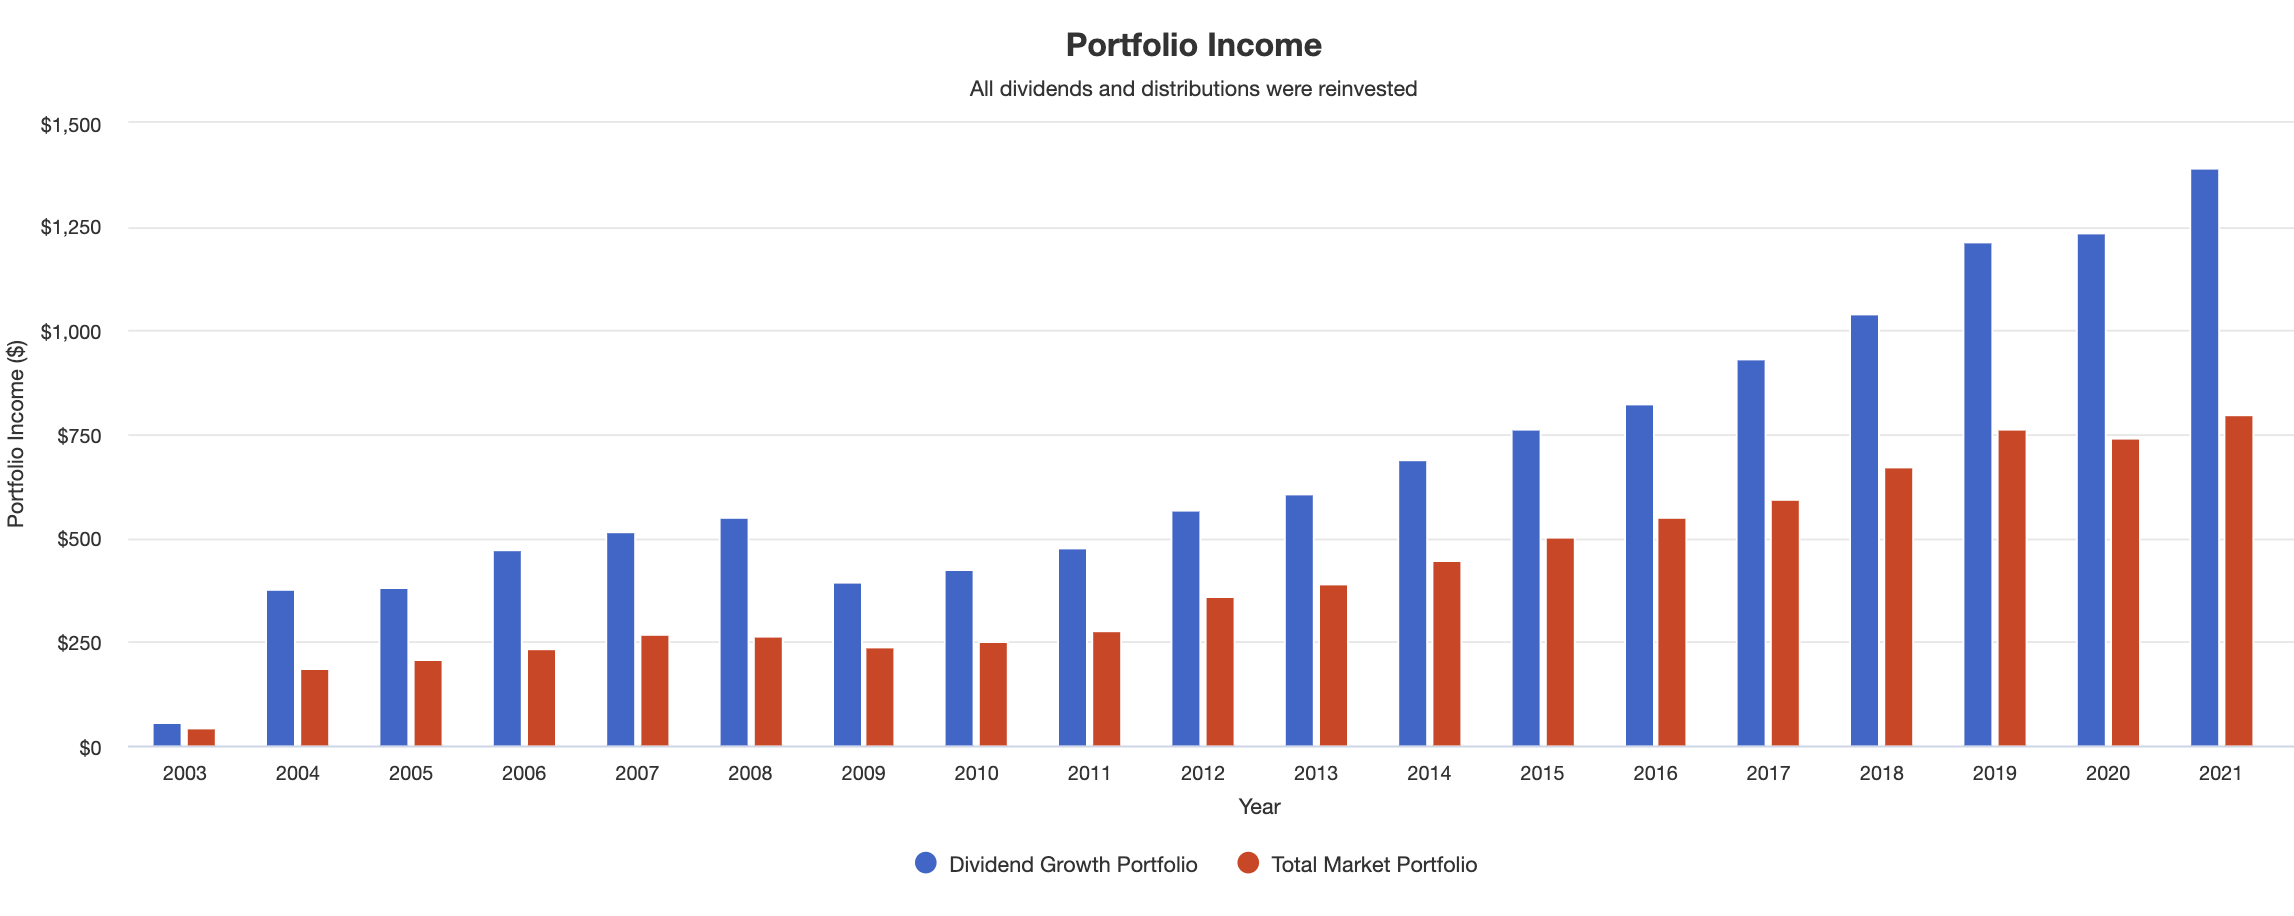
Conclusion? All of (DVY), (SDY), (VIG), (SCHD), (DGRW) and (NOBL) have underperformed the broader market since each fund’s inception. Three funds delivered income growth in excess of the market’s dividend growth, and three delivered inferior dividend growth. On average, the six dividend growth index funds did manage to outperform the broad market’s dividend growth by 1.48% per year.
Income Growth for DGI ETFs Compared to (VTI) (Author’s own spreadsheet)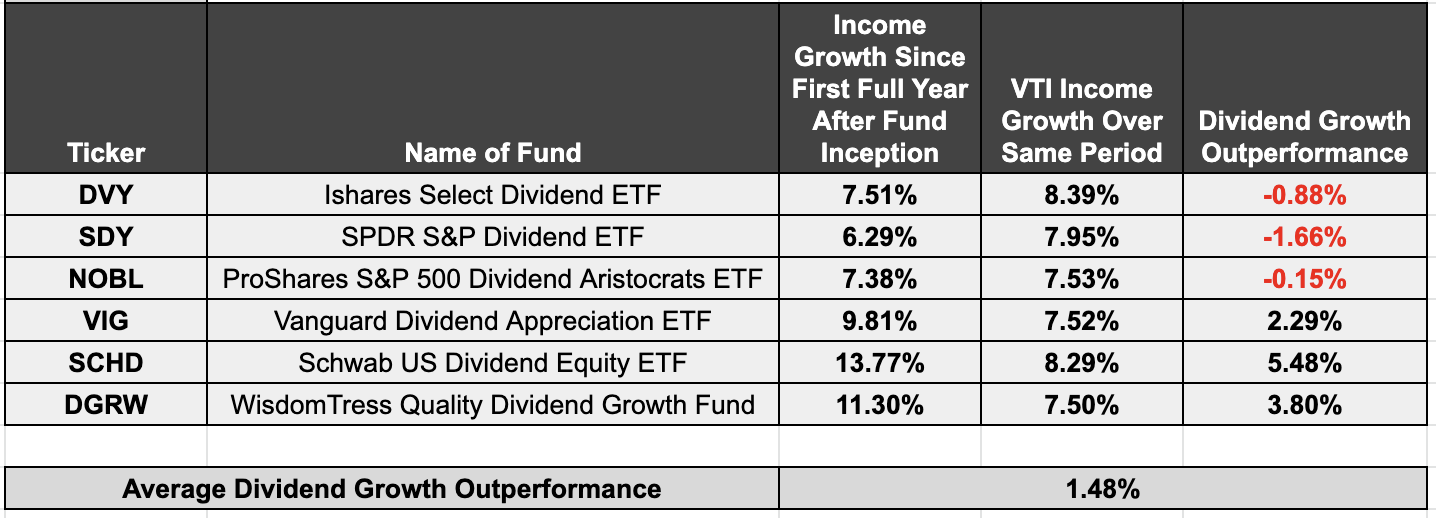
DGI is no prescription for beating the market, but when it comes to income growth it seems like the stock market has a bit of a blind spot.
Why I don’t own dividend growth ETFs
I’ve chosen to skip the dividend growth ETFs and go directly with the underlying stocks. I built my own version of an index fund which, in retrospect, was a laborious process. That’s why I was interested to read that Charles Schwab now offers clients a service that they call “personalized indexing.” Their idea is to skip the index fund and invest directly in some or all of the underlying stocks. Schwab’s fees for this service come to either .40% or .35% depending on the size of the portfolio – so perhaps the time I spent building my own dividend growth index wasn’t a complete waste.
So why do I avoid dividend growth ETFs and own dividend growth stocks directly? Five reasons:
(1) I save money on management fees. The average expense ratio for six of the top dividend growth ETFs comes to .25% per year.
Expense and Asset Turnover (Morningstar.com)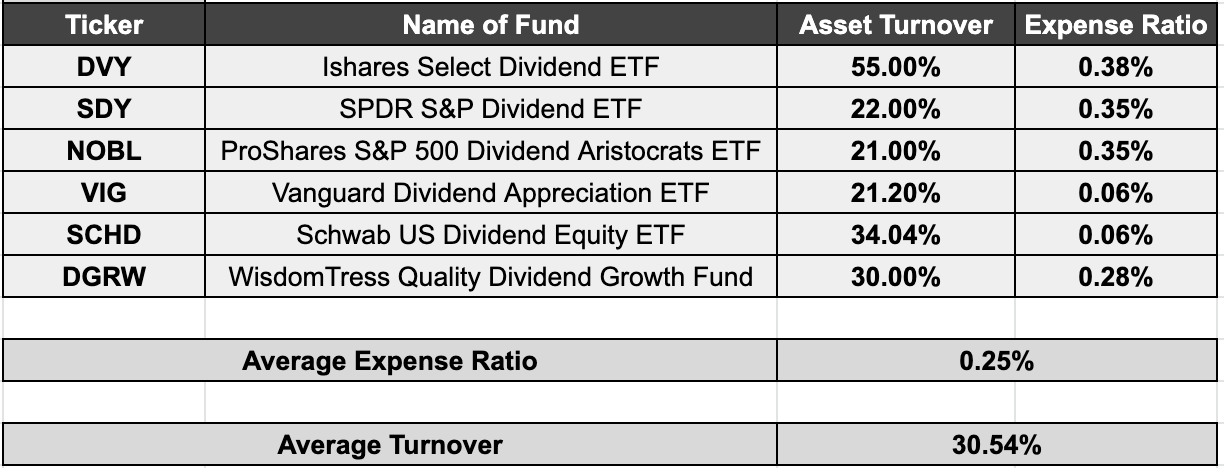
A .25% expense ratio might seem low… until you calculate how much that expense would compound over the long-term. For example, suppose I live another 40 years and the market grows by an average of 7% per year. Every $1,000 that I pay in annual fees today would compound to a total of $199,635 by the time I’m done. That’s why I would rather own shares of a company like Blackrock (BLK) than own the ETFs that Blackrock manages. Schwab’s personalized indexing product won’t help there.
(2) I can selectively harvest tax losses on any of the underlying stocks in my portfolio. With an ETF, tax losses on underlying stocks are somewhat locked and hidden. In fact, that’s one of Schwab’s main selling points for its “personalized indexing” service.
(3) Most of the top dividend ETFs have very high asset turnover. According to their respective webpages (or where I couldn’t find the information, according to Morningstar), the average asset turnover for the six dividend growth ETFs I looked at comes to 30.54% per year. Churning a third of your portfolio each year doesn’t sound very “passive.” By owning individual stocks directly instead of through a fund, I can control the asset turnover or even eliminate it altogether if I want to. Schwab’s product may or may not offer the benefits of lower turnover depending on which benchmark index the client selects.
(4) I don’t like to invest in companies based solely on their dividends. In addition to dividend histories, I prefer to examine things like the health of the company’s balance sheet, the quality of the company’s products and services, and the company’s net profit margins. The investment criteria that I apply to one company could look entirely unlike the investment criteria that I apply to another. For example, the factors that make Hermès (OTCPK:HESAY) a great handbag company aren’t too relevant to the factors that makes Norfolk Southern (NSC) a great railroad. A one-size-fits-all, rules-based investment strategy like the ones used by dividend growth ETFs won’t work for me. This is another selling point that Schwab makes (that investors can “tweek” their indexes to suit customized goals).
(5) I’ve already placed my bets. Some bets I placed 20 years ago with built-in capital gains that would produce prohibitive tax bills if I sold. Owning stocks for the long-term can end up being a bit like marriage or joining the mob: getting out can be way harder than getting in.
So what are my bets?
Everything I own in my portfolio, set forth as a percentage of portfolio assets, appears below.
Those of you who follow my portfolio may note that I have reduced my position in Old Republic (ORI) recently. The reason why? It has less to do with the intrinsic merits of the business and everything to do with my plan to build up cash so that one day, my family and I can buy some land that overlooks my favorite spot on Earth: Guincho Beach.
Guincho Beach (Author’s photo)
For me, Portugal is the taste of salty ocean spray in my beard. Portugal is blazing sunshine on a cool and windy day, accompanied by the sound of gulls and surf exploding on the rocks. Followed up with a glass of cold Portuguese white wine at Bar do Guincho (which is my favorite beachfront hamburger joint).
It was raining at the beach the other day (my favorite beach weather, incidentally). They had a fire in the fireplace going at Bar do Guincho. The rain was hissing against those old rattling, leaky window panes, and the surf outside was heavy. Some of the feral kittens came inside to get warm and dry… and to beg for french fries.
I never even knew that cats eat french fries! I guess you learn something new every day as long as you keep your eyes open.
Ah, but I digress. Here is my mostly dividend growth portfolio. Several companies use buybacks rather than pay dividends (including Alphabet (GOOG), Amazon (AMZN) and Meta (FB)). Some pay inconsistent dividends (for example, Hermes (OTCPK:HESAY)) or pay consistent dividends in foreign currencies that fluctuate against the US Dollar (Canadian Railways (CNI) or Unilever (UL), for example). I may be a DGI heretic in some ways, but 96.8% of my portfolio is concentrated into dividend paying (and mostly dividend growing) companies.
Author’s personal portfolio (Author’s own spreadsheet)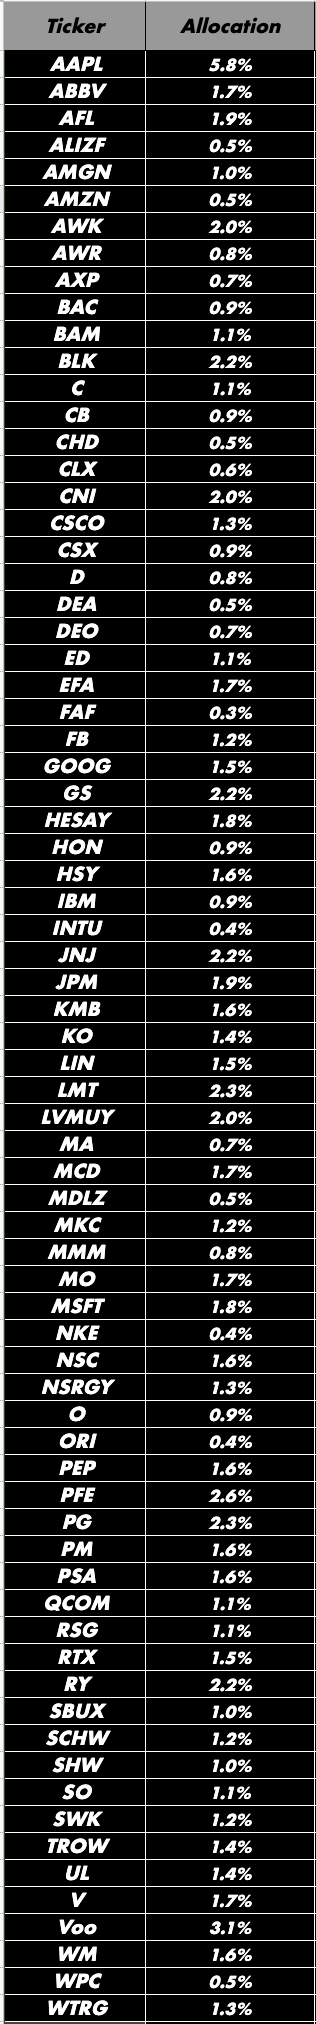
How has this portfolio held up against (VTI)? Slightly better performance over the last year, but nothing to get excited about. I don’t even expect that narrow lead over the market to necessarily last, either. I have to level with you here, that despite all the hours I’ve put into studying stocks, portfolios and markets, I never did manage to discover the secret sauce for market beating returns. The most I can offer is an education garnered from personal experience (the result of my having been too stubborn to learn from other people’s mistakes and not able to learn enough from their successes to replicate their results).
Author’s Portfolio Performance (Google Finance)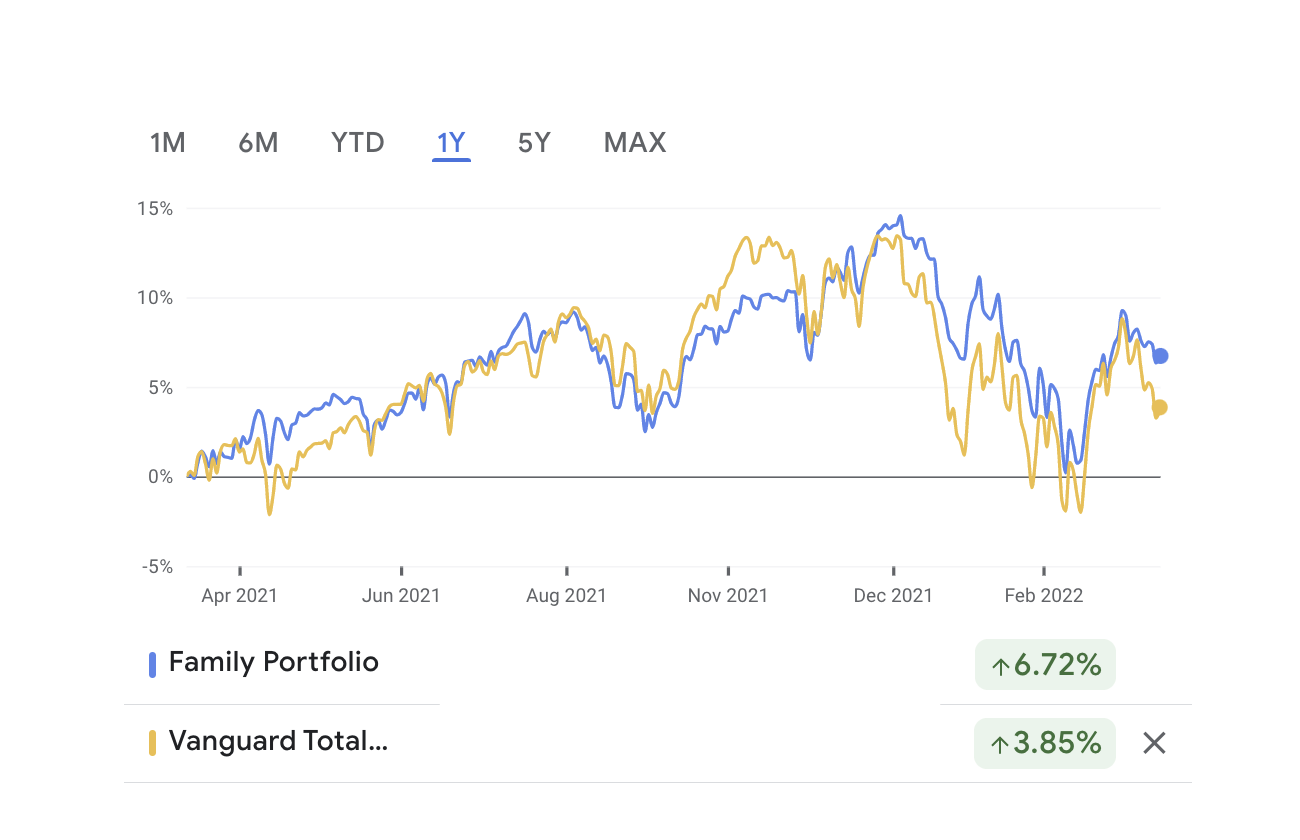
But sometimes you do manage to get lucky if you put yourself in a position where a lucky outcome is possible.
Be the first to comment