

undefined undefined/iStock via Getty Images
The Atlanta Fed released its latest GDPNow estimate:
The GDPNow model estimate for real GDP growth (seasonally adjusted annual rate) in the first quarter of 2022 is 1.3 percent on March 31, up from 0.9 percent on March 24. After this morning’s personal income and outlays report from the US Bureau of Economic Analysis, an increase in the nowcast in first-quarter real gross private domestic investment growth from -5.8 percent to -1.2 percent was slightly offset by a decrease in the nowcast in first-quarter real personal consumption expenditures growth from 4.2 percent to 3.9 percent. Also, the nowcast of the contribution of net exports to first-quarter real GDP growth decreased from -1.01 percentage points to -1.31 percentage points.
Here’s the accompanying chart:
GDP Now (Atlanta Fed)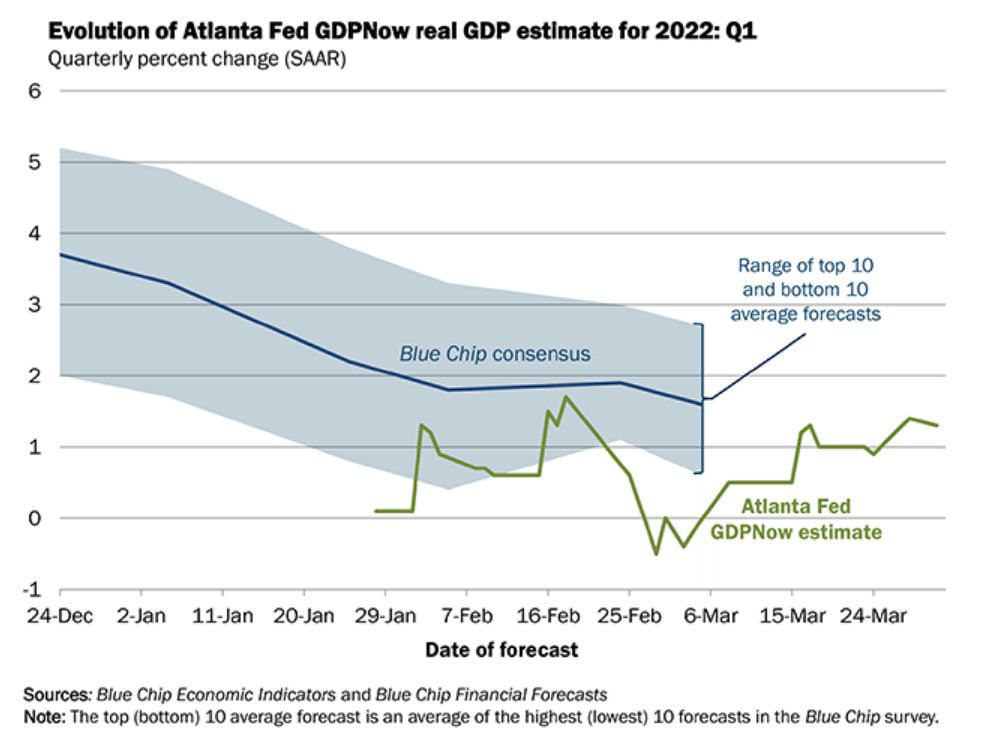
The Atlanta Fed’s estimate continues to creep higher, although it’s still at a low level. The Blue Chip consensus has trended lower since the end of December and is also pretty low.
Last year was a banner year for corporate earnings:
The numbers are in: 2021 was the most profitable year for American corporations since 1950.
Profits surged 35% last year, according to data published on Wednesday by the Commerce Department, driven by strong household demand, which was underwritten by government cash transfers during the pandemic. In all four quarters of the year, the overall profit margin stayed above 13%, a level reached in just one other three-month period during the past 70 years.
This is obviously supportive of stocks. It also means that we have nowhere to go but down.
The US is releasing oil from the Strategic Petroleum Reserve:
Under growing pressure to bring down high energy prices, President Biden announced on Thursday that the United States would release up to 180 million barrels of oil from a strategic reserve to counteract the economic impact of Russia’s invasion of Ukraine.
With midterm elections only a few months away, gasoline prices have risen nearly $1.50 a gallon over the last year, undercutting consumer confidence. And the cost of diesel, the fuel used by most farmers and shippers, has gone up even faster, threatening to push up already high inflation on all manner of goods and services.
An increase in supply obviously has a negative impact on prices. Let’s see how much the markets give.
As I noted yesterday, the markets are now in a correction. This is a good and healthy thing; a sell-off after a rally allows traders to take profits while also bringing new entrants in.
3-month SPY, QQQ, DIA, and IWM (Stockcharts)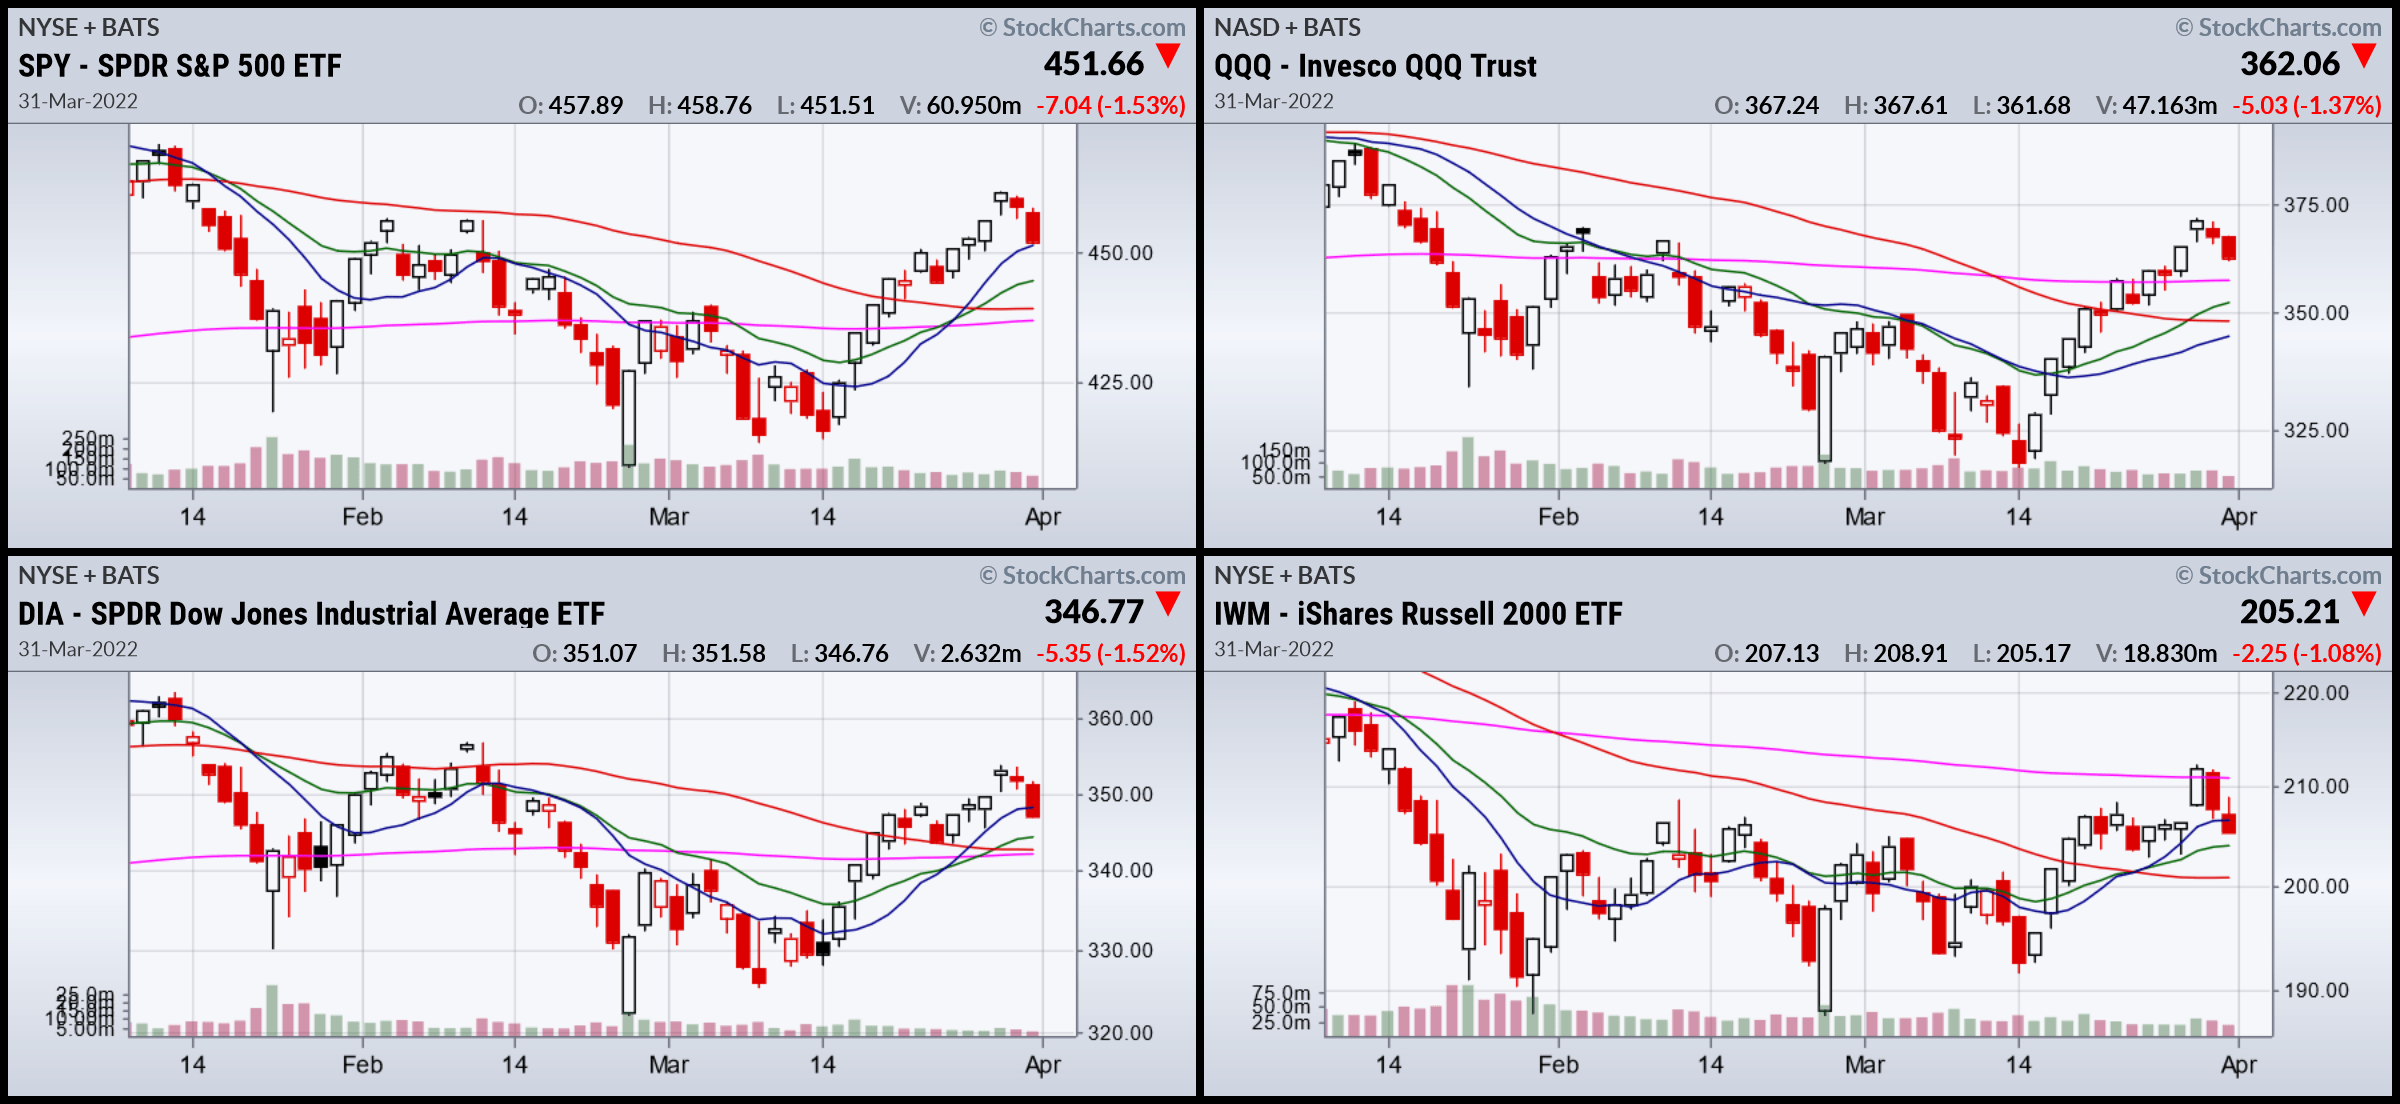
The SPY is right at the 10-day EMA. The QQQ is targeting the 200-day EMA. The DIA is through the 10-day EMA and is now moving towards the 20 and 200. The IWM is headed for the 20.
For the three larger-cap indexes, the 200-day is the logical target.
Let’s delve into the charts, starting with today’s action:
1-day SPY, QQQ, DIA, and IWM (Stockcharts)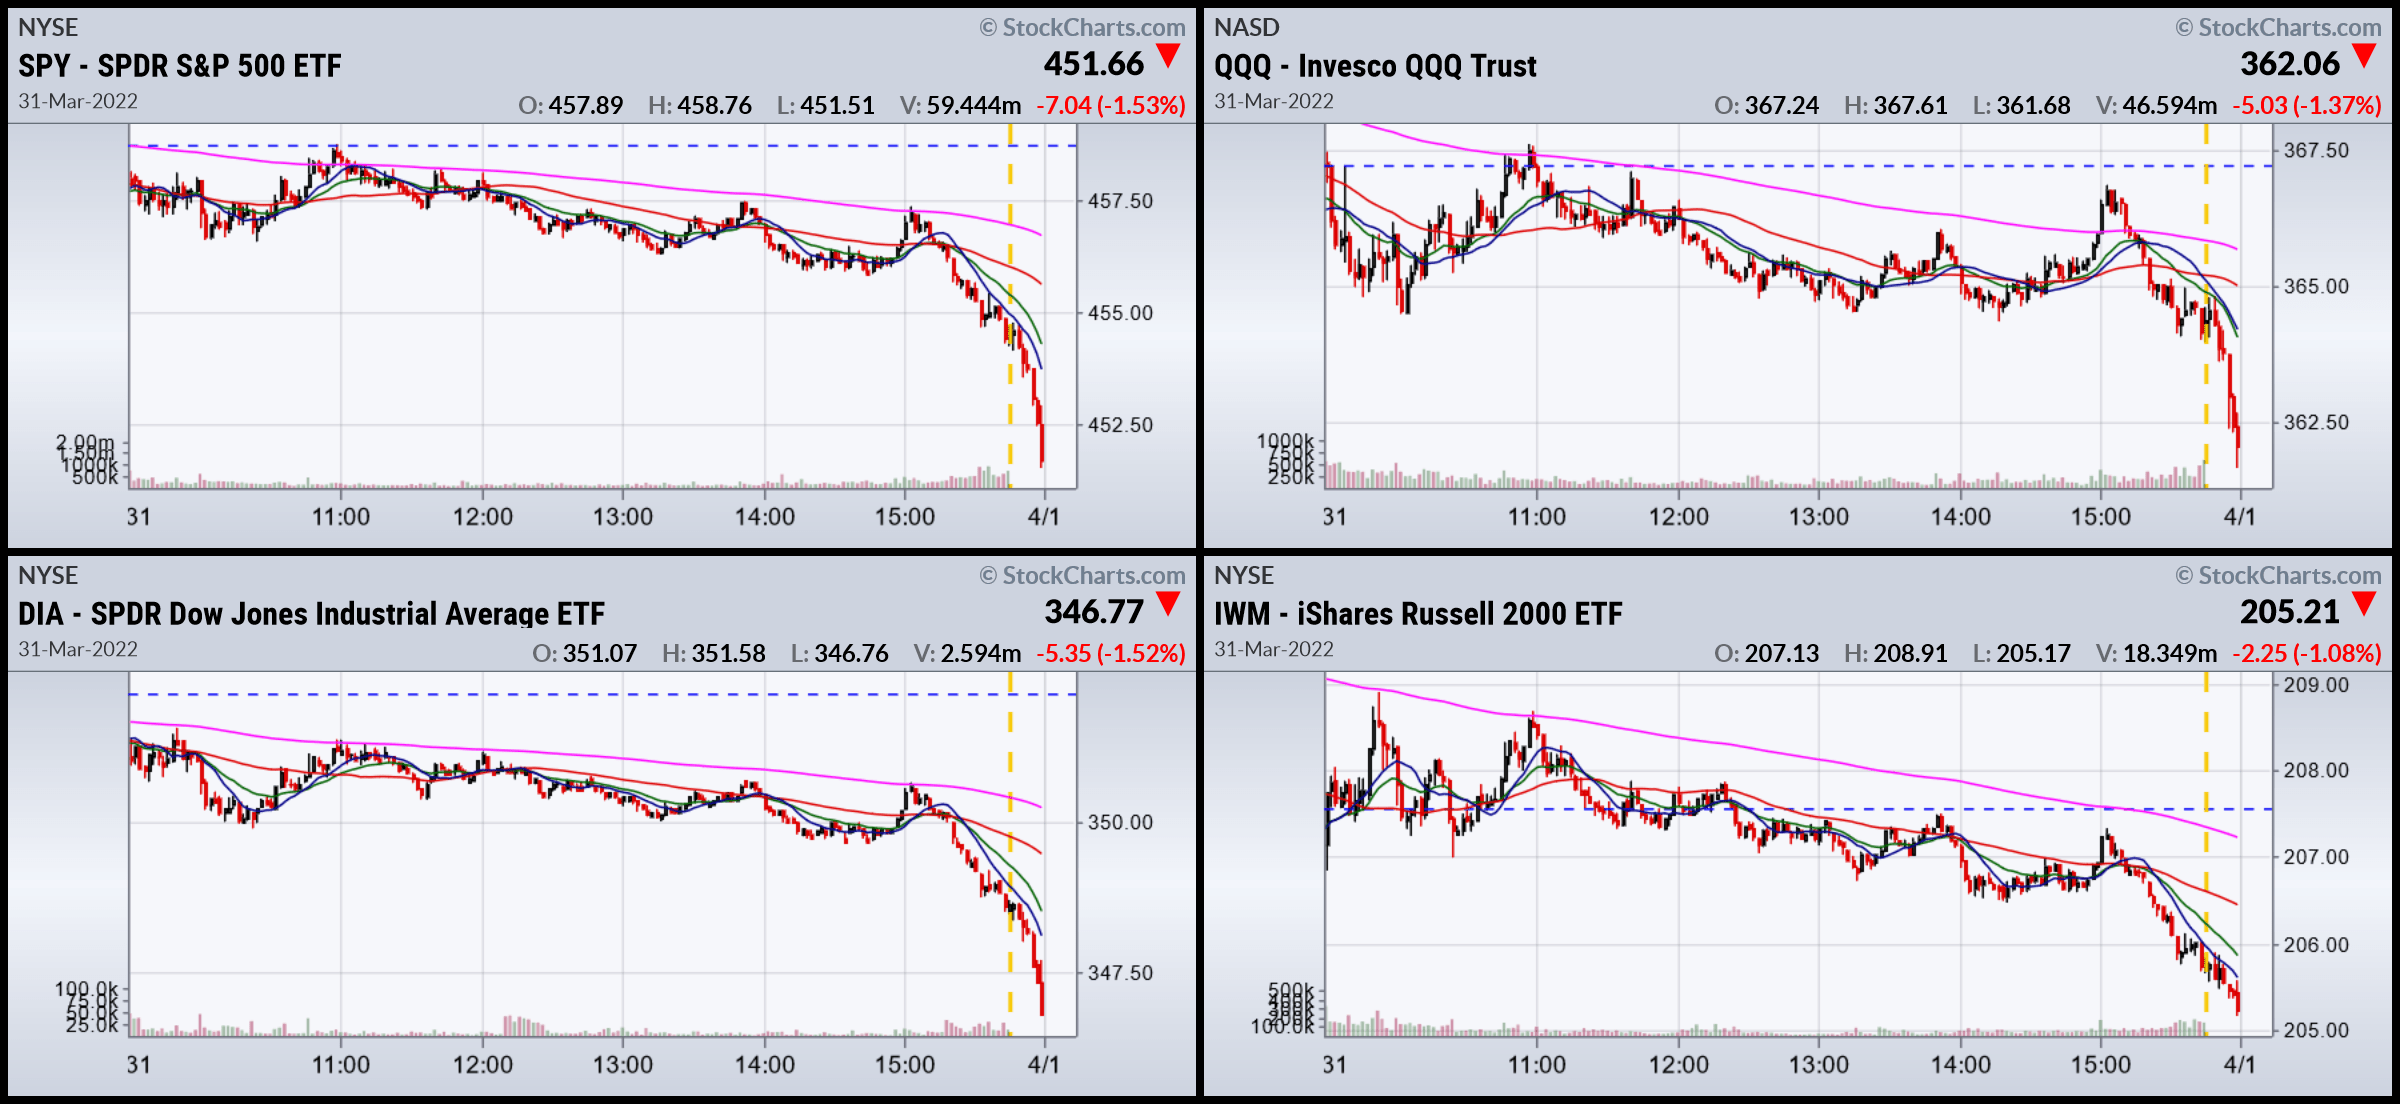
All the indexes had sharp, end-of-day sell-offs. These are always concerning since they indicate traders aren’t willing to hold overnight positions.
2-week SPY, QQQ, DIA, and IWM (Stockcharts)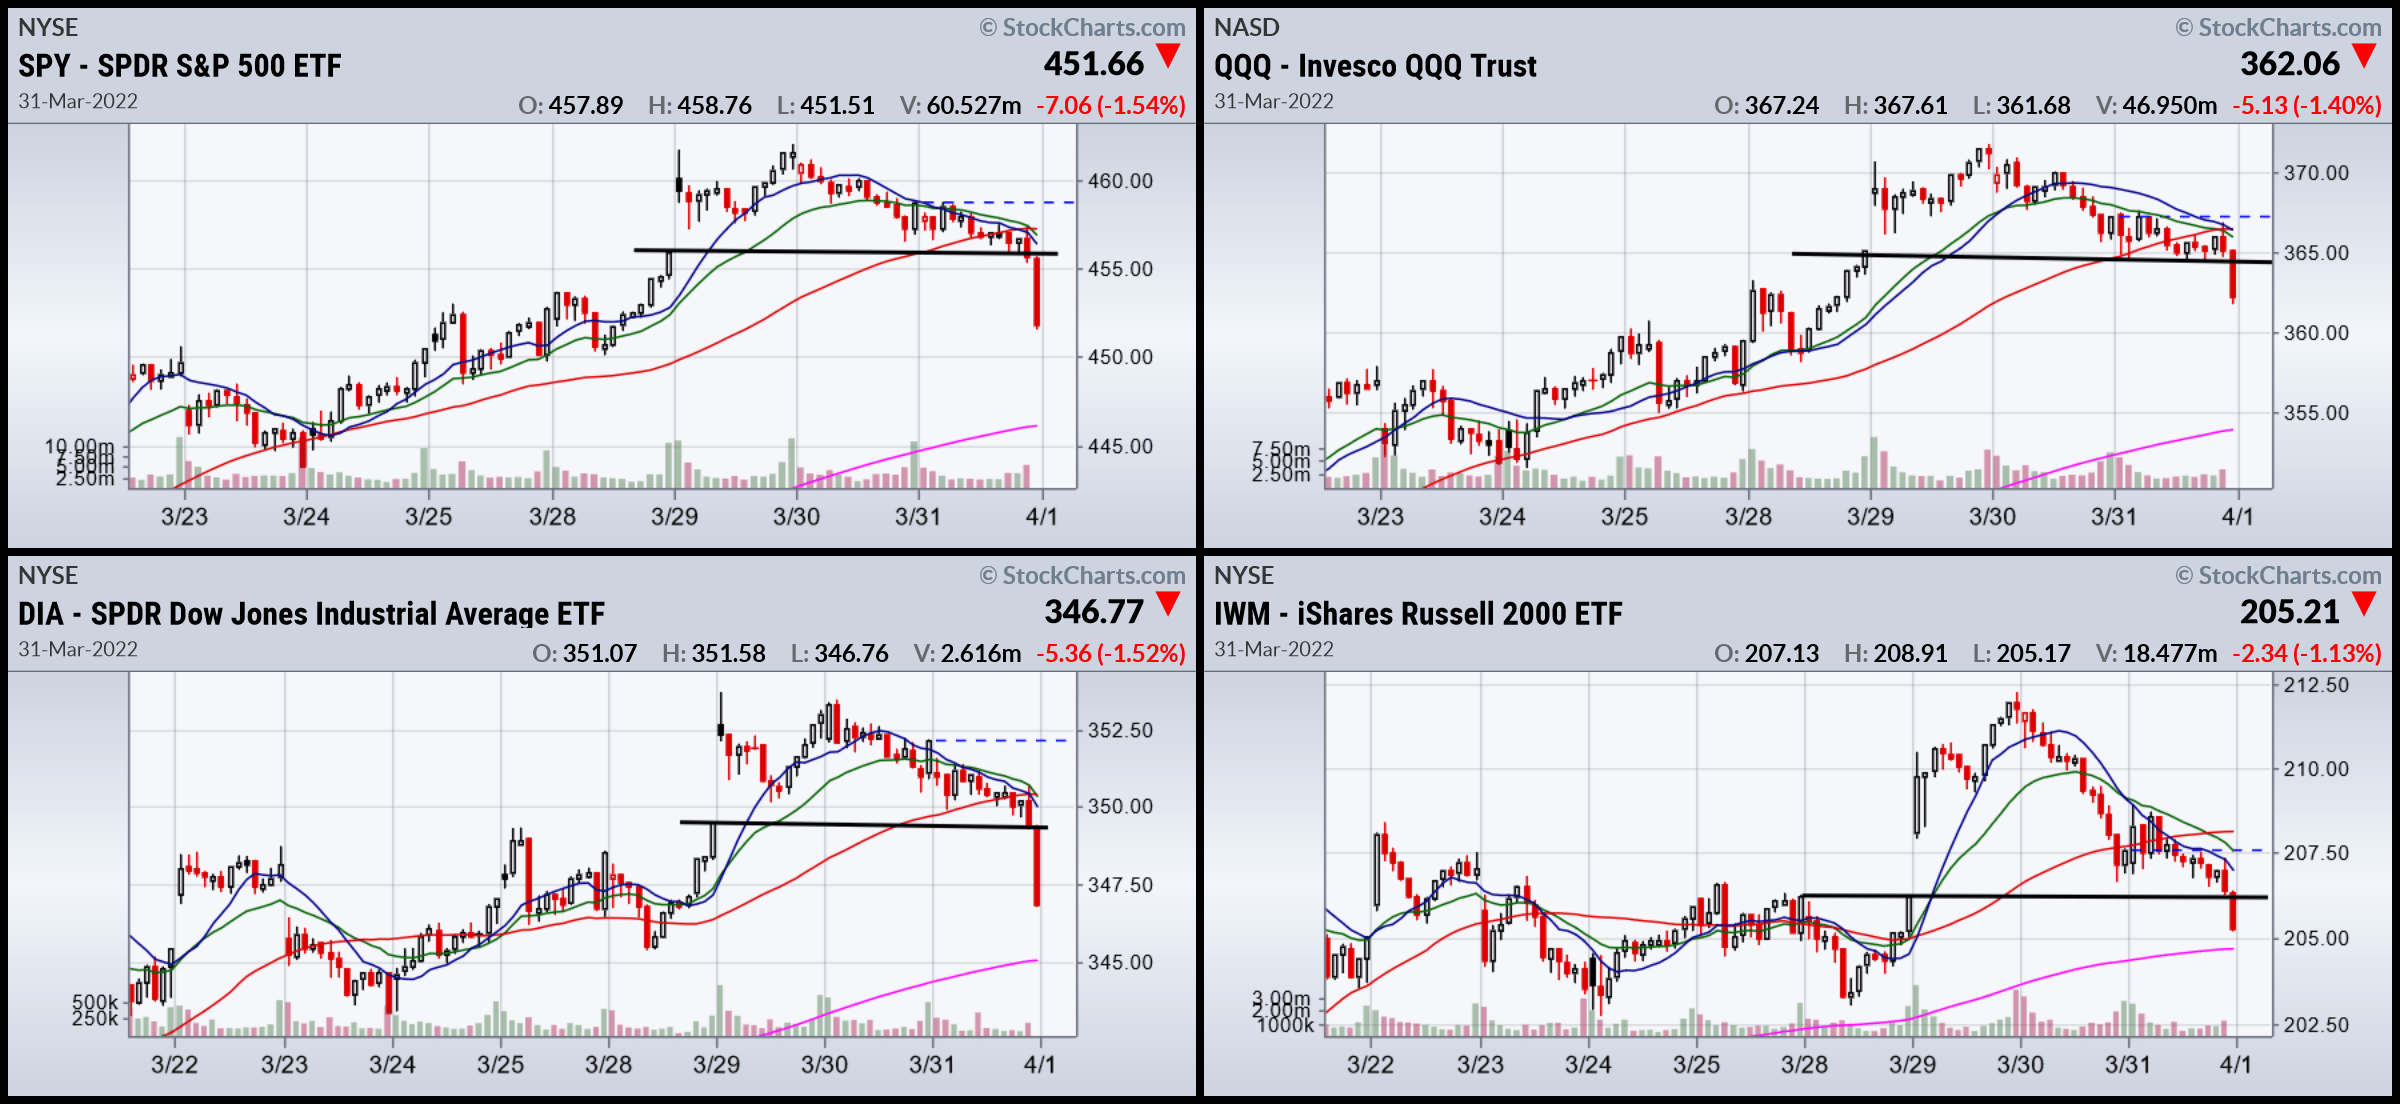
The 2-week charts show that prices broke key support levels.
The key for now is the 200-day EMAs on the charts. Let’s see if that holds.
I’ll be back over the weekend with my standard summary.
Be the first to comment