designer491
There are many references in the finance literature about the trend-following CTA “lost decade” from 2009 to 2018. This is a period when trend-following did not perform well and trend-following CTAs had a flat performance. Despite a hostile environment for trend-following in the lost decade, on average there were no losses but a flat performance. This can be attributed to the high dispersion in trend-following CTAs: some performed well but others performed badly and the average was a flat performance, as measured by the popular SG Trend Index.
The SG Trend Index (f.k.a. SG Trend-Sub Index) is designed to track the 10 largest (by AUM) trend following CTAs and be representative of the trendfollowers in the managed futures space. Source: Societe Generale.
Below is a daily chart of the SG Trend Index from 01/01/2000 to 11/14/2022.
Daily Chart of SG Trend Index (Price Action Lab Blog – Societe Generale/BarclayHedge)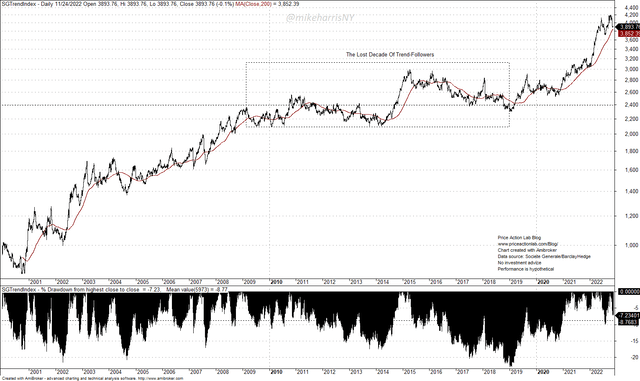
The “lost decade from 2009 to 2018 is marked on the above chart. Below is the performance of the SG Trend Index from 01/01/2000 to 11/14/2022.
Performance Chart of SG Trend Index (Price Action Lab Blog – Societe Generale/BarclayHedge)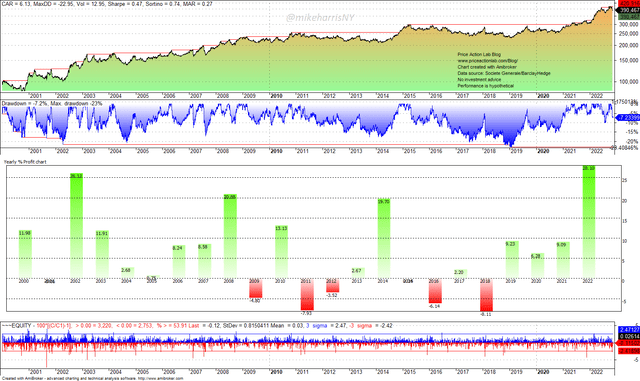
The annualized return is 6.1% and the maximum drawdown is 23%. The Sharpe ratio is 0.47. In the same period, the S&P 500 total return has annualized return of 6.5% but at 55.2% maximum drawdown and a Sharpe ratio of 0.33. Therefore, in the specific period considered, trend-following CTAs on average outperformed the S&P 500 return on a risk-adjusted basis despite a lost decade.
The lost decade performance from 2009 to 2019 is shown in the chart below.
Performance OF SG Trend Index from 2009 to 2018 (Price Action Lab Blog – Societe Generale/BarclayHedge)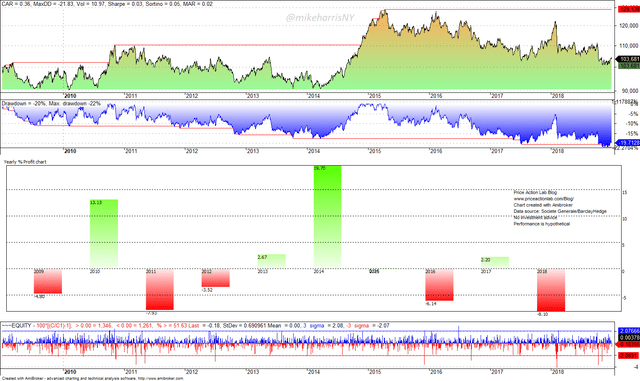
For the lost decade, the annualized return was a mere 0.3% and the Sharpe ratio was 0. Although 2014 was a good year for trend-following CTAs, on average during the 10 years the performance was flat with a maximum drawdown of 22%. By 2019, many thought that trend-following was dead. The supply shock from the pandemic, the large stimulus programs, and the geopolitical conflict ignited inflation and CTAs got back in the game.
The lost trend-following CTA decade has caused wide underperformance relative to the S&P 500 total return since 2009.
S&P 500 Total Return and SG Trend Index Relative Performance Since 2009 (Price Action Lab Blog – Norgate Data/Societe Generale/BarclayHedge)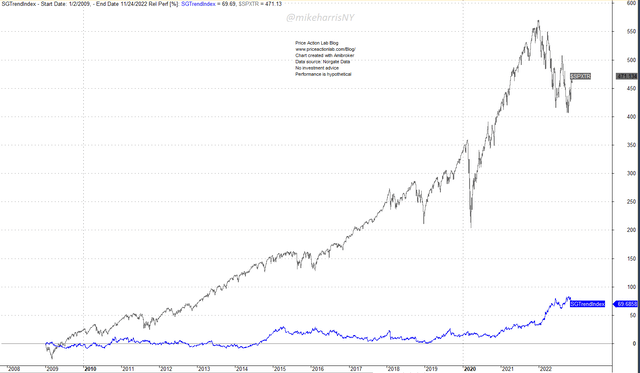
Since 2009, the S&P 500 total return is 471% versus 69.7% for the SG Trend index return. However, in the last two years, the SG Trend Index outperforms the S&P 500 total return by a wide margin.
S&P 500 Total Return and SG Trend Index Relative Performance Since 2021 (Price Action Lab Blog – Norgate Data/Societe Generale/BarclayHedge)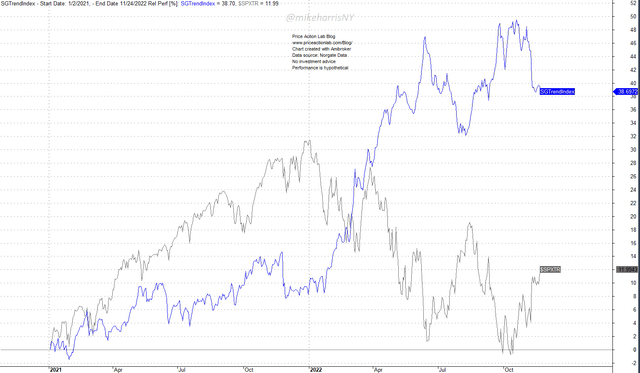
Since 2021, the S&P 500 total return is 12% versus 38.7% for the SG Trend index return. The relative gains are due to the best performance of the SG Trend Index in 23 years versus a large loss for the S&P 500 total return this year.
Strategic Allocations
The average performance reflected by the SG Trend Index assumes investment in all 10 CTA programs, and although that may be possible for large AUM funds and other qualified investors, it is not possible for most retail investors. Therefore, in the case of retail, the analysis of the past has little value since it was hard or even impossible to take advantage of average CTA performance, and what is referred to by quants as “trend-following convexity”. This has recently changed with the advent of ETFs that track CTA indexes.
In another SA article, we discussed a 50/50 allocation to SPY ETF (SPY) and iMGP DBi Managed Futures Strategy ETF (DBMF).
Below is the historical performance (backtest) of an annually rebalanced portfolio in S&P 500 total return (50%), US Treasury Bond Total Return (25%), and SG Trend Index (25%), from 01/03/2000 to 11/24/2022.
Historical Performance of an Allocation in S&P 500 total return (50%), US Treasury Bond Total Return (25%), and SG Trend Index (25%) (Price Action Lab Blog – Norgate Data/Societe Generale/BarclayHedge)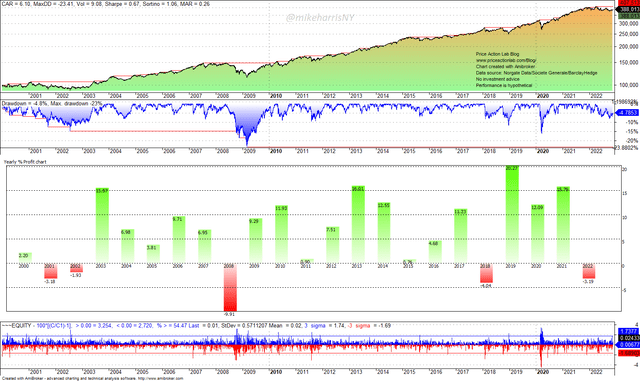
The annualized return is 6.1%, the maximum drawdown is 23.4%, and the Sharpe ratio is 0.67. This allocation is down 3.2% year-to-date.
A smoother equity curve is achieved by reducing the allocation to stocks by 20% and adding that to SG Trend Index.
Historical Performance of an Allocation in S&P 500 total return (30%), US Treasury Bond Total Return (25%), and SG Trend Index (45%) (Price Action Lab Blog – Norgate Data/Societe Generale/BarclayHedge)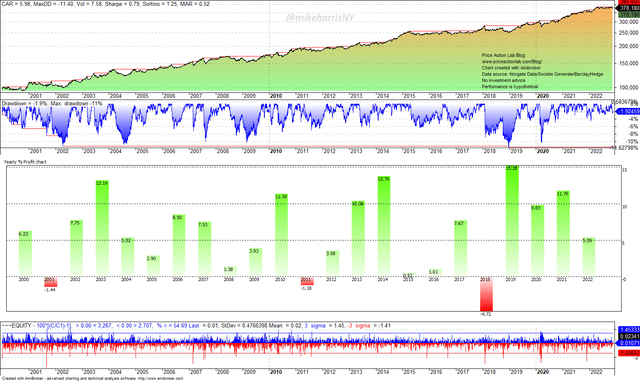
The backtest results are for an annually rebalanced portfolio in S&P 500 total return (30%), US Treasury Bond Total Return (25%), and SG Trend Index (45%). The annualized return is lower by about 10 basis points as compared to the previous allocation, but the maximum drawdown is about half at 11.4%. Year-to-date, this allocation is up 5.4%.
Caveat emptor: optimizing allocations introduces data mining bias and the results may be over-fitted to past market conditions. The above results are only indicative of what would have been achieved in the past before any transaction costs. Past performance results are subject to the fact that they are designed with the benefit of hindsight. No representation is being made that any account will or is likely to achieve profits or losses similar to those shown.
Increasing the allocation to trend-following (SG Trend Index) has smoothed performance historically. However, future regime changes are unknown, and any conclusions from the above analysis may not be valid.
Conclusion
After a lost decade, trend-following CTAs have taken advantage of suitable market conditions to deliver high returns. In conjunction with ETFs that track the performance of trend-following indexes at low cost, retail investors can adjust their strategic allocations to take advantage of the convexity CTAs offer. We provided examples of two allocations, one with a higher weight to stocks, and another with a higher weight to trend. The weights of the different assets are normally chosen based on the risk aversion profile, investment horizon, and expectations about future performance, among other parameters. It is almost certain that after the large losses this year of the traditional 60/40 portfolio, there will be an interest in a broader allocation that includes trend-following and even other styles and markets.


Be the first to comment