

everythingpossible/iStock via Getty Images
Investment Thesis Summary
Since our last publication on The Joint Corp. (NASDAQ:JYNT) there’s been nil change to the hold investment thesis, by estimation. The company has a set of challenges to overcome in FY23′, with respect to profitability and EPS upside. This, as the hurdle rate for equity investors lifts higher during the same period, where investors must demand a higher equity risk premium in order to justify allocation. Here I’ll run through our latest assessment findings for JYNT, providing clarity on our position.
As a reminder, we had rated JYNT a hold in August, where the stock has since declined another 34.7% since that time. Specifically, we had highlighted:
- JYNT continues on its growth initiative in growing franchise and company-managed locations.
- Bottom-line fundamentals continued to weaken and display a lack of affinity to the equity premia investors are paying into a tighter macro-climate.
- The pace at which JYNT opens new clinics is a noteworthy key performance indicator for the company.
- This is essential considering the economics of the allied health services market. To this, we exclaimed: “…there are only so many patients that can be seen per hour; only so many clinicians per site can be hired; and only so much that can be charged per consult, effectively placing a ceiling on growth of a single centre. Therefore, in order to expand turnover and beef up the top-line, the best strategy by estimate is ongoing store and franchise openings to drive additional turnover whilst retaining more of the EBIT margin.”
Net-net, we continue to rate JYNT a hold, with an $11.40 valuation.
Exhibit 1. JYNT downside price action across FY21-22, trading well beneath both short-term and long-term moving averages.
Data: Updata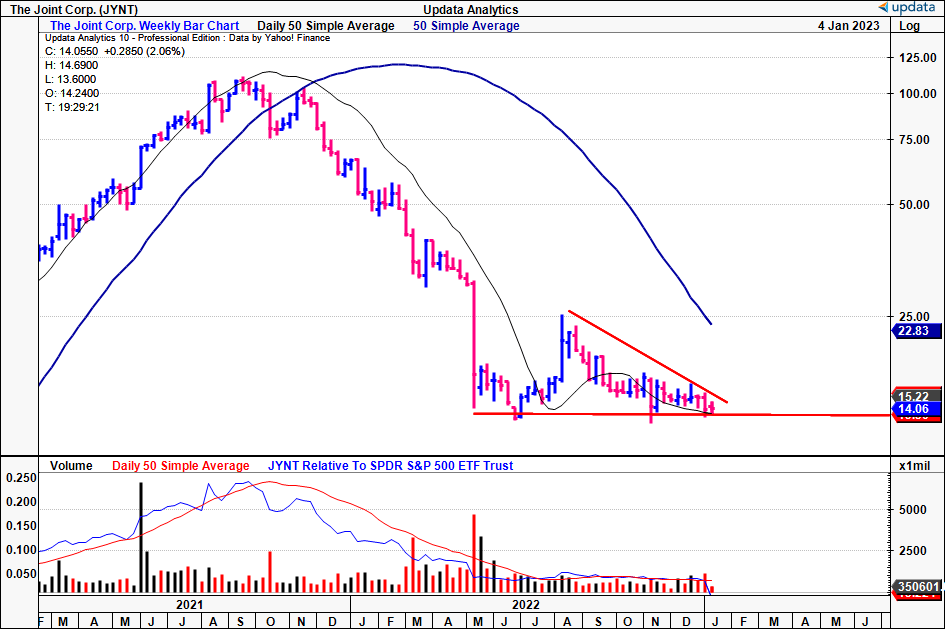
Latest financial results clearly illustrate the operating challenges
It’s first worth highlighting that management alluded to the headwinds it continues to experience via the changing algorithms with Google, impacting its organic search traffic and traffic to its website. Noteworthy however, is by of the end of FY21′, the company’s market share was approximately 2%, similar to that of its competitors. Heading into its FY22 results, this is a critical number to take note of in our estimation.
We also believe that JYNT’s nationwide clinic base has allowed it to benefit from scale pricing in marketing, talent, and infrastructure, enabling it to expand footprint into Alaska during December. As a result, the company has posted positive comp rates even during times of consumer uncertainty. Turning to Q3 2022, JYNT opened 38 clinics, 33 of which were franchised and 5 of which were greenfield. We’d also note the company saw changes in ownership, with corporate purchasing 4 previously franchised clinics and selling 1 company-managed clinic to a franchisee.
Talking of first 9 months of 2022, JYNT opened a total of 103 clinics, 91 of which were franchised and 12 of which were greenfield. It also reported a unit closure rate of less than 1% per year, what it says is amongst the best in the franchise industry. In total, by the end of September 30, 2022, JYNT operated a total of 805 clinics, comprising 690 franchise clinics and 115 company-owned or managed clinics. The portfolio mix on this is comprised of 86% franchise clinics and 14% corporate clinics.
Switching to the company’s latest earnings, here are out operational and divisional highlights:
- We saw JYNT reported an increase in system-wide sales for all clinics [open for any amount of time] to $110.4mm, a YoY growth of 18%. Comparable sales for all clinics open for >13 months was 600bps, whilst system-wide sales for mature clinics open for 48 months or more were 200bps YoY. It is worth noting that both the franchise and corporate clinic groups saw positive comparable sales across both time frames.
- We also saw that JYNT’s revenue saw an increase of 27% to $26.6mm, with a $5.6mm growth from the prior year. Company-owned or managed clinic revenue rose 36%, contributing $15.8mm, on adjusted EBITDA was $3.1mm, down from $3.3mm YoY. Still franchise clinic adjusted EBITDA saw an increase of 25% to $5.4mm, while company-owned or managed clinic adjusted EBITDA decreased by $1.1mm to $1.7mm, reflecting tighter margins on its Greenfield development, and higher payroll expenses. In total, franchise operations increased 15%, contributing $10.8mm, due to portfolio-wide growth across corporates and franchises. It pulled this down to net income was $491,000, or $0.03 per diluted share, down from $0.13 per diluted share last year.
- Back in March FY22′, the company implemented a price increase in ~75% of its clinics – although, management said existing patient memberships were grandfathered at their original price. As a result, the revenue impact of the price adjustment will be gradual and incremental, with around 50% of active members on the new price structure at the end of the quarter. The cost of obtaining its Q3 revenues was $2.5mm, an increase of 8% YoY. We’d note this was down to the increase in franchise clinics, and the corresponding regional developer royalties and commissions associated with this.
- Moving vertically down the P&L, we’d note JYNT also lost some leverage at the SG&A line, with a 23% YoY increase to $3.5mm. Hence, operating income was $500,000, compared to $1.3mm in the third quarter of 2021. Despite the cost impact from its Greenfields operations are capital intensive and have tightened bottom-line growth, as the segment is unprofitable, management said from the call they believe it to be a valuable use of capital looking down the line. We’d argue this could very well be, however, it will be some time until we see this pull through to EPS upside.
Fair view of JYNT fundamentals
Looking at additional measures, it’s clear profitability has been another key headwind for JYNT across FY21-22′. You’ll see in Exhibit 2 that NOPAT and the corresponding return on invested capital (“ROIC”) are well off FY21 highs. This needs to improve going forward, because its current WACC hurdle it 11.33%, meaning the trailing ROIC of 5.9% it not near sufficient to generate economic profit. Moreover, it places questions on JYNT’s ability to fund its future growth initiatives itself, or if it will have to resort to raising additional capital. It is reasonably well capitalized, with $10.3mm in cash, and a current ratio of 1.4x [excluding deferred revenue booked under current liabilities].
Exhibit 2. JYNT profitability breakdown across FY21-22′. Very important to consider given the higher hurdle rate, and its ability to self-fund future growth initiatives.
Data: Author, JYNT SEC Filings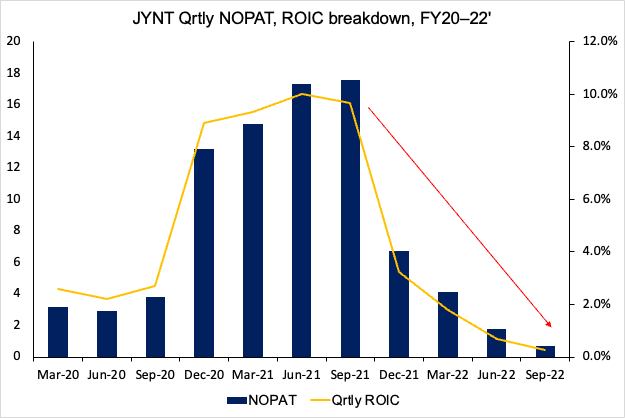
The company, JYNT, has revised its guidance for the year, expecting revenue to be in the range of $100-102mm, an increase from the previous estimate of $80.9mm in 2021. Additionally, the company has revised its adjusted EBITDA guidance to a range of $11.5-12.5mm, down slightly from the previous estimate of $12.6mm in 2021. The company expects a range of 110-130 franchise clinics opened by FY22 year end, similar to the number opened in 2021, and plans to increase the number of company-owned or managed clinics by 30-40. This will primarily be driven by further greenfield openings and franchise clinic purchases.
Should this convert, consensus estimates this to create a reasonable revenue ramp into FY23 [Exhibit 3]. This should be factored into the investment debate, and could feed decent income down the P&L by estimation.
Exhibit 3. JYNT consensus revenue estimates present with decent ramp into FY23′.
Data: Seeking Alpha, JYNT, see: “Revenue”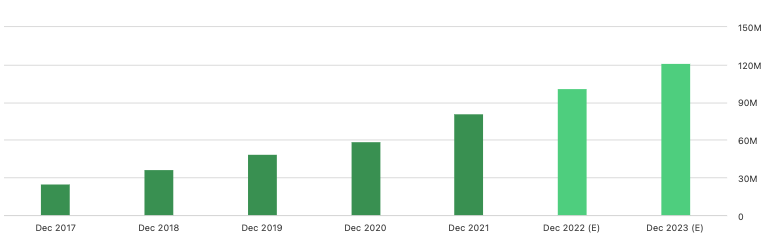
However, we don’t see this manifesting in EPS growth over the coming periods. As you’ll see below, we assume a $0.08 in EPS for the company in Q4 FY22, and by the following year, see this levelling at the same mark by Q4 FY23′. We build these assumptions on Q4 FY23 revenue estimates of $33mm on adjusted EBITDA of $4.3mm. Without the EPS upside looking ahead, this confirms our neutral thesis.
Exhibit 4. JYNT Qrtly EPS growth assumptions, FY22-23′. Note, these are GAAP estimates.
Data: Author estimates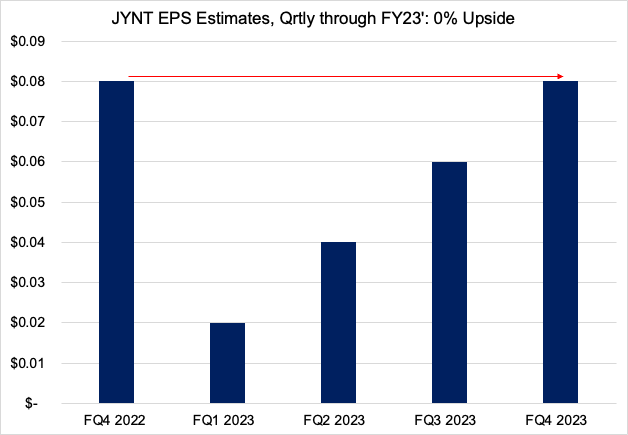
Valuation and conclusion
At its current market price, the stock is wildly overvalued at ~120x forward P/E. This mightn’t be the best measure to use here, however.
Looking at pre-tax earnings, it is trading at 18.75x forward EBITDA. This is a substantial premium to peers, and we believe it should trade in-line with the sector at 13.2x forward EBITDA. Assuming management’s estimates for FY22 of $12.5mm at the upper end of range, which we are aligned with, this derives a price target of $11.4. This also confirms our neutral view. Providing a more objective measure, you’ll also see the stock is rated lowly using Seeking Alpha’s quant factor grades.
This tells us there is risk in buying JYNT today, and that a re-rating to the upside may be limited in the mid-term.
Exhibit 5. JYNT Seeking Alpha factor grades, demonstrating flat outlook for valuation upside, with minimal downside protection.
Data: Seeking Alpha, JYNT quote page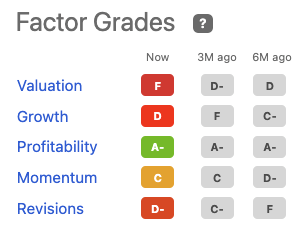
Net-net, there isn’t the tangible evidence to advocate JYNT as a buy right now, not even with a contrarian perspective. The company has a set of hurdles to overcome with respect to profitability and its ability to self-fund growth initiatives looking ahead. This, whilst capital markets tighten up, the cost of capital increases, and the availability of capital begins to dry up on a global stage. With this in mind, we rate JYNT a hold on an $11.40 valuation.
Be the first to comment