

Pgiam/iStock via Getty Images
This article is a follow up to the December article about the Investors Intelligence survey of newsletter writers, which is the granddaddy of all sentiment indicators. It has a 60 year track record. It is the classic contrary opinion indicator and has been mentioned over the years in numerous books on the stock market. For a full explanation and the history of this indicator, please read the original December article.
Investors Intelligence
The two graphs below are graphical representations of our current interpretation of the basic Investors Intelligence data. The charts go back to 1980. The basic underlying data is published weekly by Chart Craft. It was originally published monthly, then bi-weekly, then starting around 1970, weekly.
In the first chart we use time weighted moving averages on the weekly surveys to smooth out the results and produce a longer term view. We take a moving average of the number of bears and divide by the average number of bulls so it’s a bear to bulls ratio.
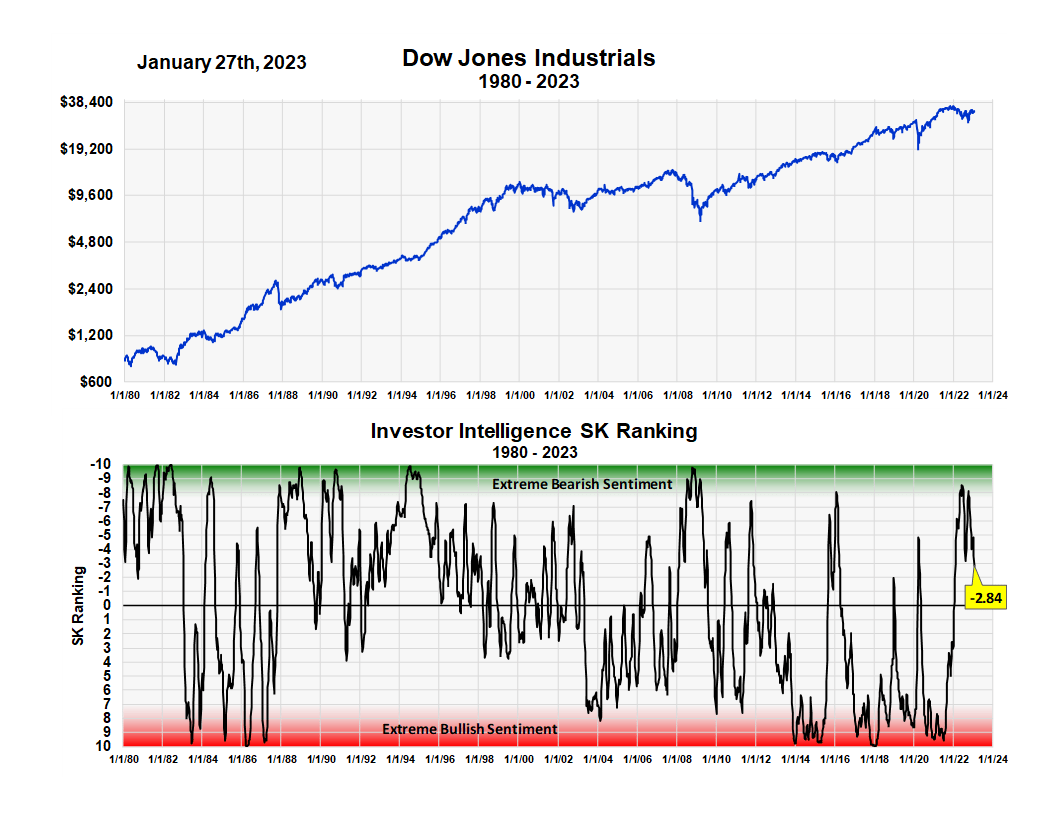
The second chart graphs the same data on the Sentiment King’s ranking scale. We do this so it can be compared to readings of other sentiment indicators. The SK ranking scale is explained (here).
Moving average of the ratio of bears to bulls of Investors Intelligence (Michael McDonald) Putting the Investors Intelligence survey on the SK ranking Scale (Michael McDonald)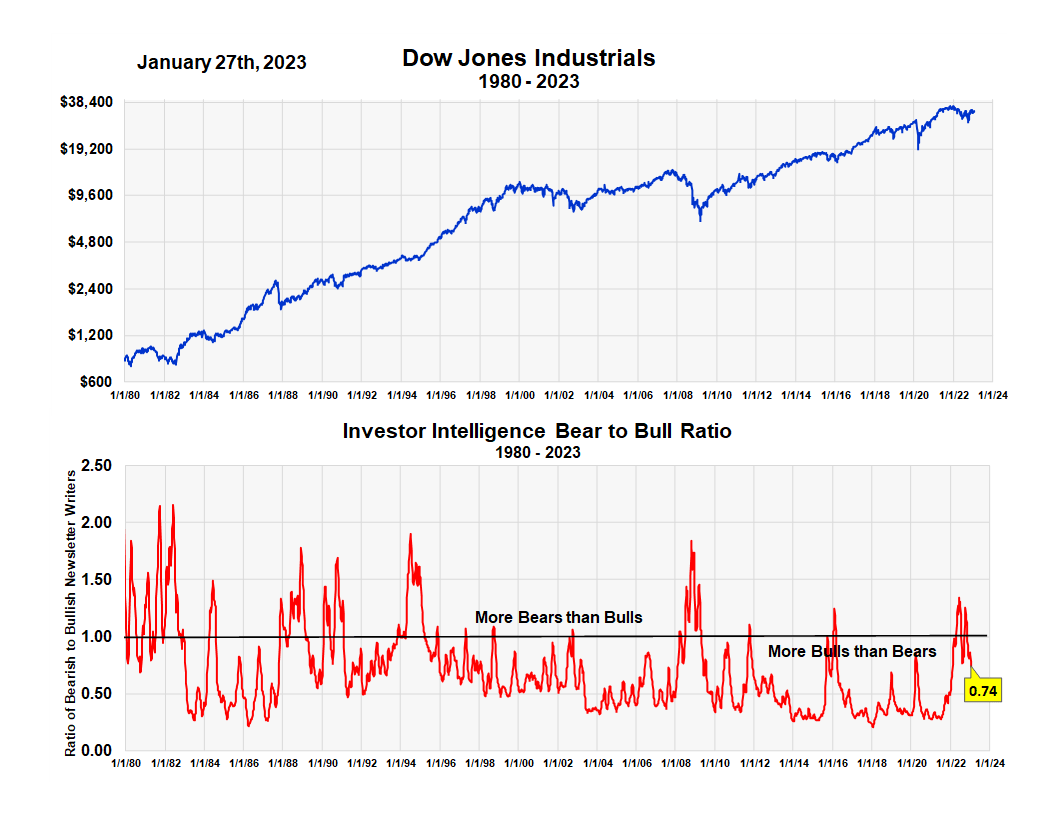
It’s pretty clear from the chart how this indicator works. Major price lows occur when you get an extreme bearish ratio. This is the green zone area. The ratio enters the green zone when it’s higher than 90% of the ratios since inception.
Since 1980, every major price advance started with the Investor Intelligence ratio in the green zone, except 2002 and 2020. I remember missing the start of the 2003 bull market waiting for this sentiment indicator to get more extreme. A price advance has never started with Investors Intelligence sentiment either bullish or even neutral.
After an extreme ratio is registered signalling the bottom of the market, once the price move begins, the ratio rapidly declines into a neutral area before taking its time to finally register on the other side of the equation and enter the red zone.
The Wall of Worry and Doubt
In 2022 the ratio entered the green zone twice – on May 20th, and again on October 7th. Since October 7th, the market has advanced.
We think it’s important the ratio hasn’t changed much since the first article was written five weeks ago. Then, the ratio had a SK ranking of minus 4.5; it’s currently minus 2.8. A completely neutral reading is zero. So after three months of rising prices, we’re just starting to see the ratio move into the neutral zone. You would expect more bullish newsletter writers emerging after the recent price advance, but they’re not.
This suggests to us that there’s a “wall of worry and doubt” as the market’s been rising. Investors and advisors remain convinced of the bearish case even as prices move higher. Historically, this is an important contrary opinion sign in itself, and a signal the current price move is probably the start of a new bull market and not a temporary, bear market rally.
Be the first to comment