

Justin Sullivan
Home Depot (NYSE:HD) shares have returned -15.1% in the past month as concerns about rising interest rates have regained prominence. The shares have returned a total of -32% for the year-to-date (YTD). Consumer discretionary stocks tend to be particularly hard-hit when rates rise, which can account for much of HD’s decline. The 10-year Treasury yield has more than doubled so far in 2022, rising from 1.6% on January 3 to 3.5% today. The Consumer Discretionary Select Sector SPDR (XLY) has returned a total of -22.5% for the YTD, as compared to -17.9% for the S&P 500 (SPY).
Seeking Alpha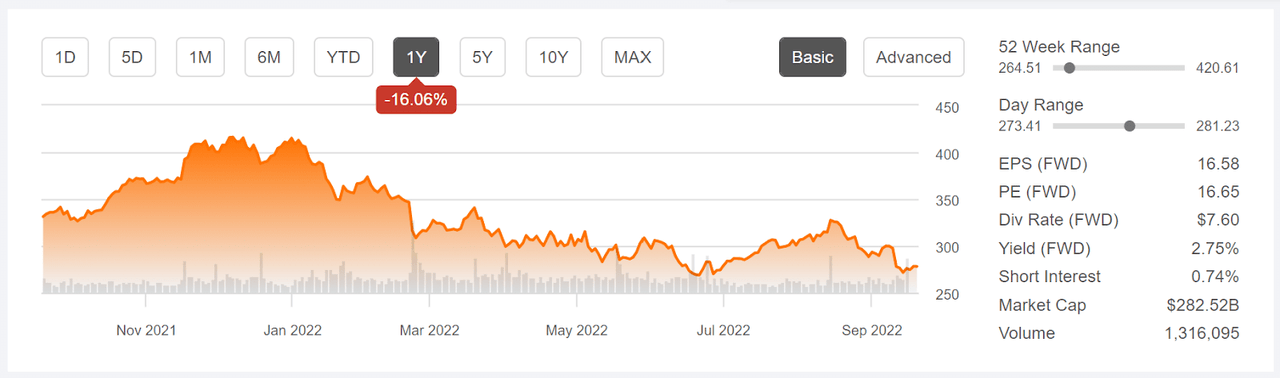
12-Month price history and basic statistics for HD (Source: Seeking Alpha)
HD has been delivering solid earnings growth over the past two years, most recently with consensus-beating earnings for Q2, reported on August 16. While there is a significant seasonal variation in HD earnings, so that quarter-to-quarter declines are expected for Q3 and Q4, the EPS trend is expected to persist. The consensus expectation for EPS growth over the next 3 to 5 years is 11.3% per year.
ETrade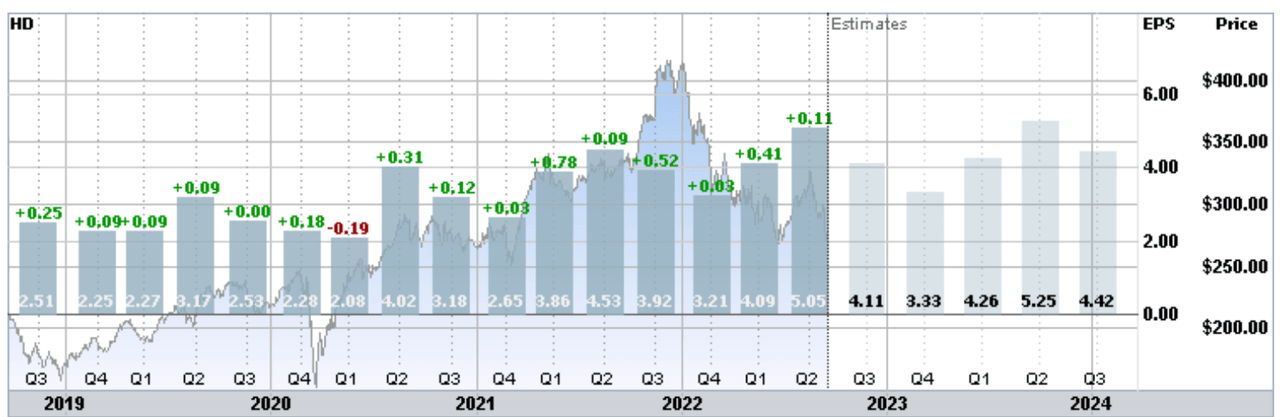
Historical (4 years) and estimated future quarterly EPS for HD. Green (red) values are amounts by which EPS beat (missed) the consensus expected value (Source: ETrade)
In discussing the Q2 results, management emphasized the growth in digital engagement and sales, as well as the effectiveness of the ‘interconnected retail strategy,’ in which online sales were fulfilled at a physical store location. This is one of HD’s ongoing strengths.
Valuation has been one of the concerns with HD over the past couple of years. The P/E came very close to reaching the 20-year high late in 2021 but has fallen substantially so far in 2022, as the share price has fallen and earnings have gone up. The estimated forward P/E, 16.7, and the TTM P/E, 17, are low relative to historical values over the past 10 years. So far in 2022, HD’s valuation has become substantially more attractive.
Macrotrends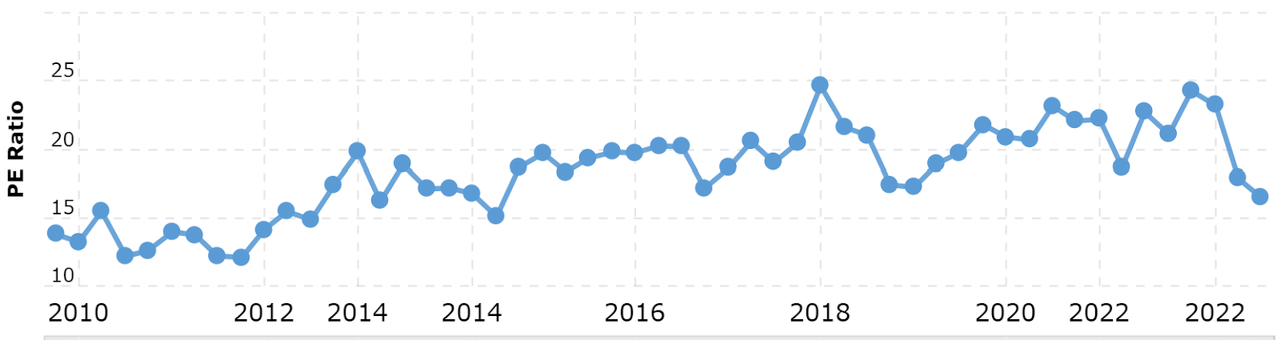
Historical P/E for HD (Source: Macrotrends)
I last wrote about HD on February 4, 2021, at which time I assigned a hold rating. My main concern had to do with the high valuation at that time. From this post until today, HD has returned a total of 5.8% vs. 2.4% for the S&P 500, including dividends. When I wrote this, the Wall Street consensus rating on HD was bullish, with a consensus 12-month price target that was 13.75% above the share price at that time. The TTM P/E was 23.5 and the forward P/E was 23.0, high values for HD as compared to the historical levels. When analyzing a stock, I also look at the probabilistic price forecast that is implied by the prices of call and put options, the market-implied outlook. The market-implied outlook for HD was neutral. Balancing the bullish Wall Street rating and price target against the high valuation and neutral market-implied outlook, I settled on an overall hold rating for HD.
Seeking Alpha
Previous post and subsequent performance of HD vs. the S&P 500 (Source: Seeking Alpha)
For readers who are unfamiliar with the market-implied outlook, a brief explanation is needed. The price of an option on a stock is largely determined by the market’s consensus estimate of the probability that the stock price will rise above (call option) or fall below (put option) a specific level (the option strike price) between now and when the option expires. By analyzing the prices of call and put options at a range of strike prices, all with the same expiration date, it is possible to calculate a probabilistic price forecast that reconciles the options prices. This is the market-implied outlook. For a deeper explanation and background, I recommend this monograph published by the CFA Institute.
Readers may be interested in my analysis of LOW from early June of 2022, in which I calculated the market-implied outlooks as part of my evaluation.
I have calculated updated market-implied outlooks for HD and compared these with the current Wall Street consensus outlook in revisiting my rating.
Wall Street Consensus Outlook for HD
ETrade calculates the Wall Street consensus outlook for HD by aggregating the views of 21 ranked analysts who have published price targets and ratings over the past three months. The consensus rating is a buy and the consensus 12-month price target is 26.6% above the current share price. This expected price appreciation is almost twice the value when I wrote my last post on HD. The large spread in the individual analyst price targets is something of a concern because higher dispersion among price targets tends to reduce the predictive value of the consensus. As a rule of thumb, I tend to substantially discount the consensus price target when the ratio of the highest and lowest price targets is 2.0 or greater. For HD, this ratio is 1.6, which is not extremely high but does suggest some caution in using the consensus price target for forward guidance.
ETrade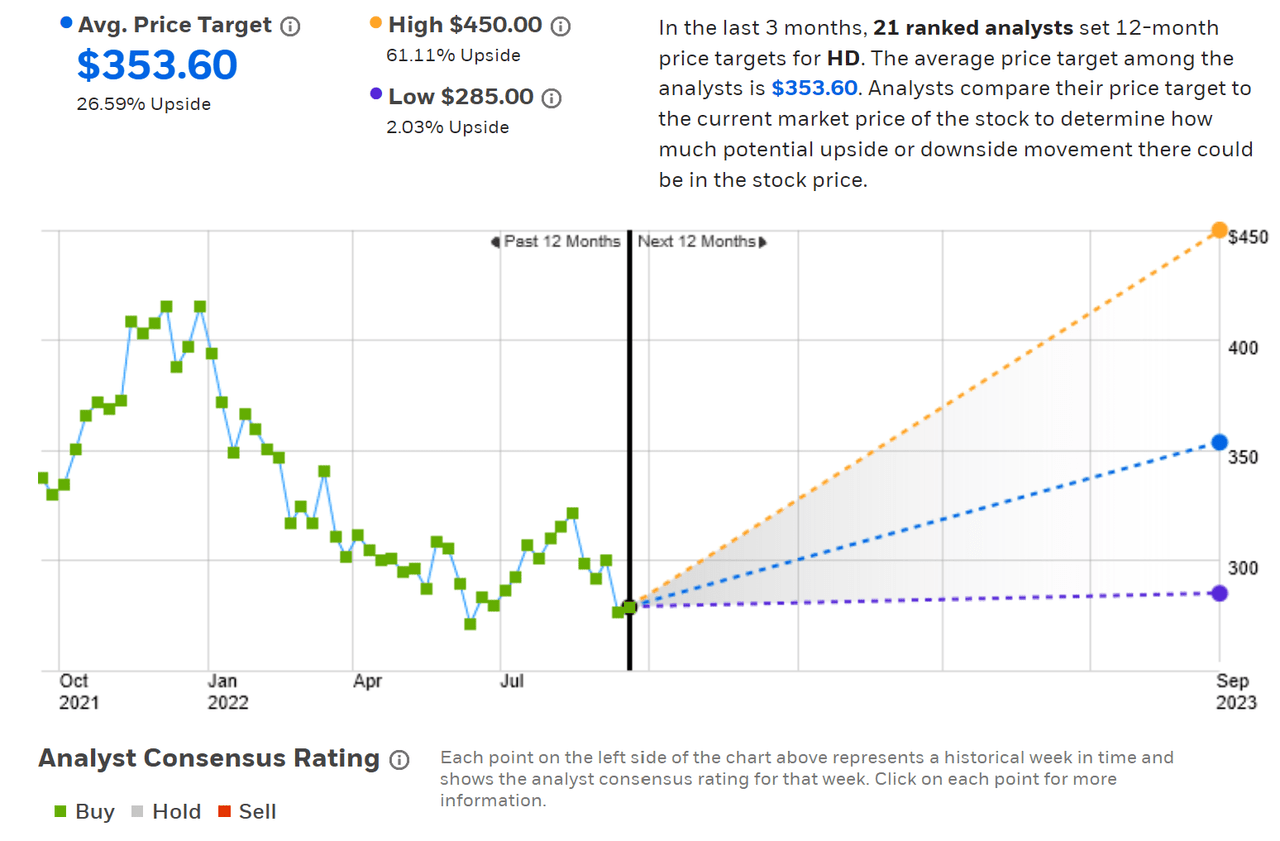
Wall Street analyst consensus rating and 12-month price target for HD (Source: ETrade)
Seeking Alpha’s version of the Wall Street consensus outlook for HD is calculated using ratings and price targets from 32 analysts who have published their views within the past 90 days. The consensus rating is a buy and the consensus 12-month price target is 27.9% above the current share price.
Seeking Alpha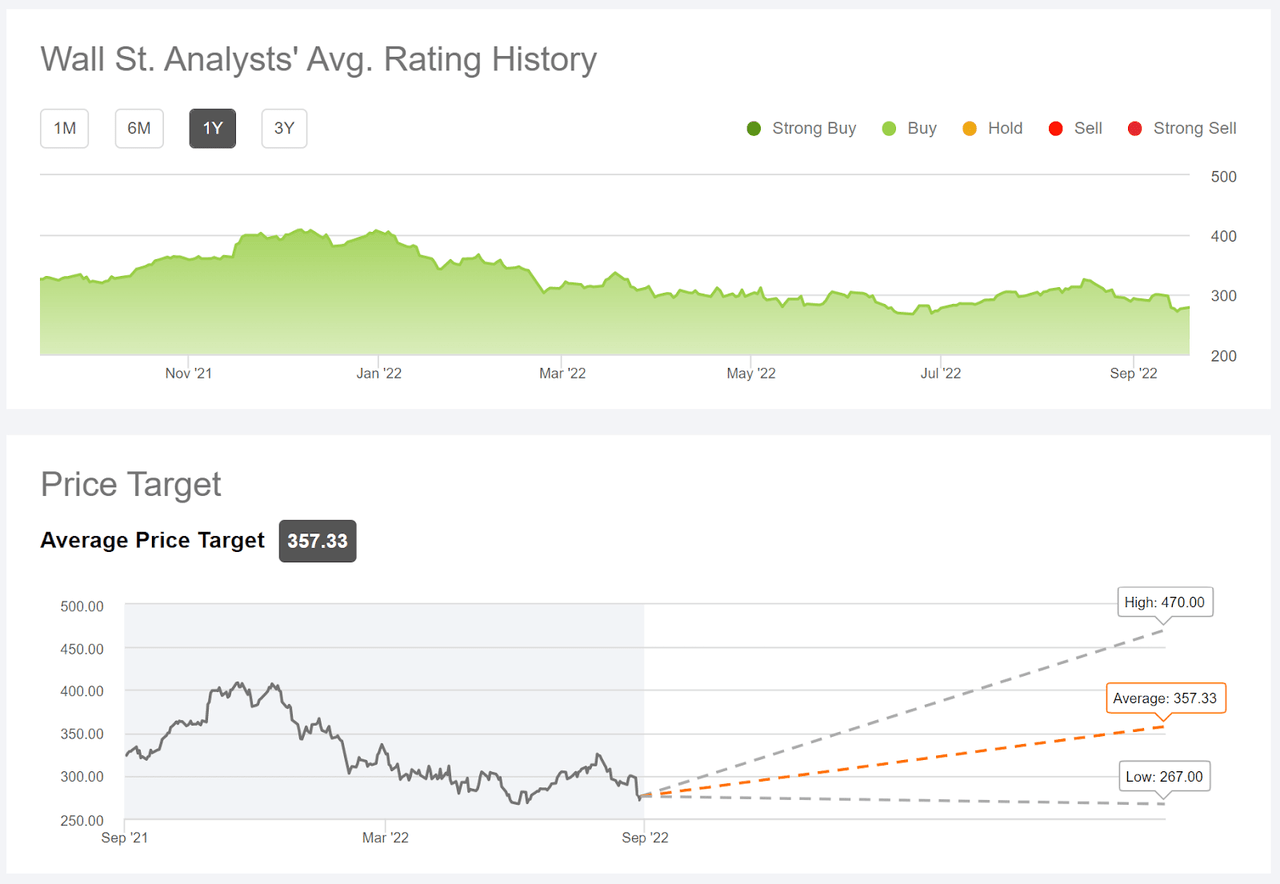
Wall Street analyst consensus rating and 12-month price target for HD (Source: Seeking Alpha)
The Wall Street consensus rating has been bullish for all of the past year, even as the valuation got close to a 10-year high towards the end of 2021. This suggests that the prevailing view among the analysts was that the substantial increases in the valuation were not a major concern. While the consensus price target has fallen so far in 2022, HD’s share price has declined considerably more, the expected price appreciation implied by the price target is currently very high. The consensus expected total return for HD (including the dividend and averaging the Seeking Alpha and ETrade consensus price targets) is 30%.
Market-Implied Outlook for HD
I have calculated the market-implied outlook for HD for the 4-month period from now until January 20, 2023 and for the 8.8-month period from now until June 16, 2023, using the prices of call and put options that expire on these dates. I selected these two dates to provide a view to the start and middle of 2023, as well as because the options expiring in January and June tend to be among the most liquid.
The standard presentation of the market-implied outlook is a probability distribution of price return, with probability on the vertical axis and return on the horizontal.
Geoff Considine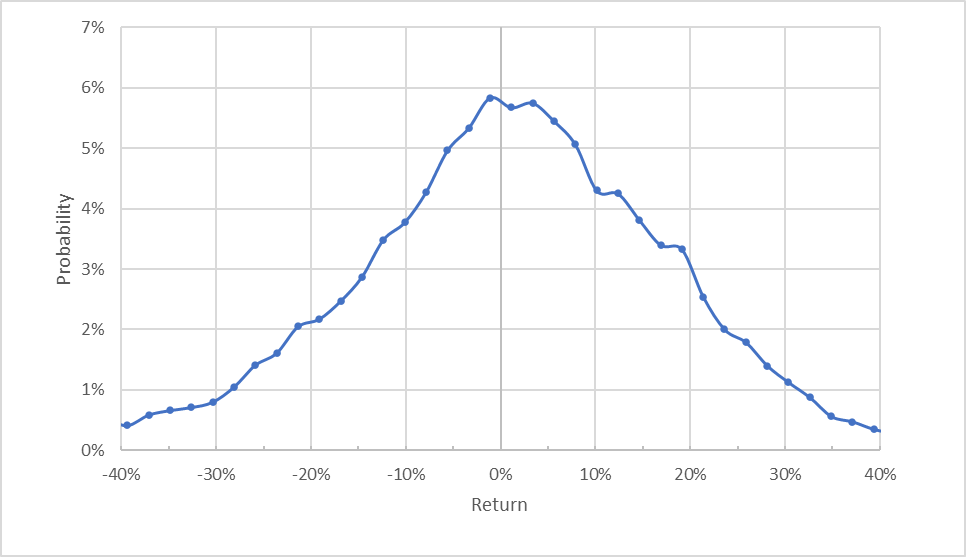
Market-implied price return probabilities for HD for the 4-month period from now until January 20, 2023 (Source: Author’s calculations using options quotes from ETrade)
The market-implied outlook for HD for the next four months is generally symmetric, but the distribution is shifted to favor positive returns. Compare, for example, the probability of having a return of +10% vs. -10% on the chart above. The expected volatility calculated from this distribution is 30.8% (annualized).
To make it easier to compare the relative probabilities of positive and negative returns, I rotate the negative return side of the distribution about the vertical axis (see chart below).
Geoff Considine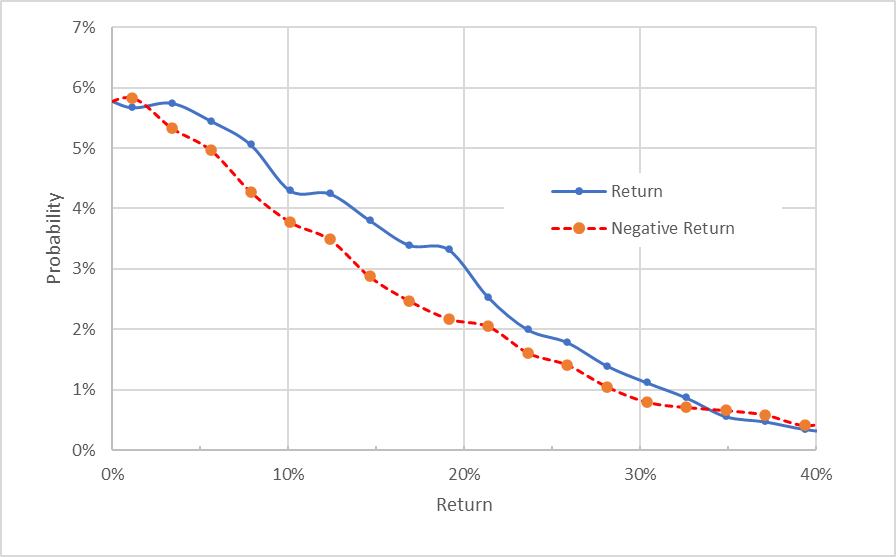
Market-implied price return probabilities for HD for the 4-month period from now until January 20, 2023. The negative return side of the distribution has been rotated about the vertical axis (Source: Author’s calculations using options quotes from ETrade)
This view shows the pronounced tilt in the probabilities to favor positive returns over negative returns. The probabilities of positive returns are consistently higher than for negative returns of the same magnitude, across almost the entire range of possible outcomes (the solid blue line is above the dashed red line over almost all of the chart above). This is a bullish market-implied outlook for the next four months.
Theory indicates that the market-implied outlook is expected to have a negative bias because investors, in aggregate, are risk averse and thus tend to pay more than fair value for downside protection. There is no way to measure the magnitude of this bias, or whether it is even present, however. The expectation of a negative bias reinforces the bullish interpretation of this outlook.
The market-implied outlook for HD for the next 8.8 months is similar to the shorter-term outlook, although the bullish tilt (the spread between the probabilities of positive and negative returns) is less pronounced. The expected volatility calculated from this distribution is 30.8% (annualized), consistent with the shorter-term outlook.
Geoff Considine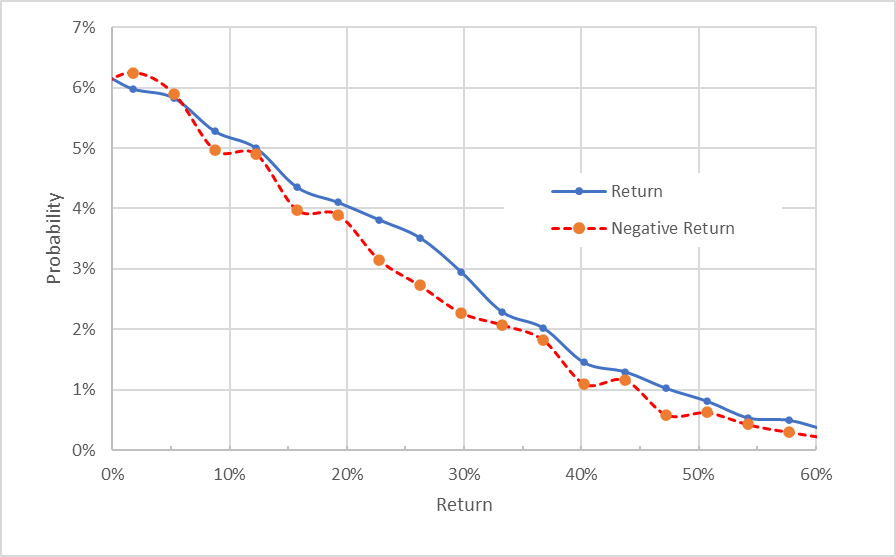
Market-implied price return probabilities for HD for the 8.8-month period from now until June 16, 2023. The negative return side of the distribution has been rotated about the vertical axis (Source: Author’s calculations using options quotes from ETrade)
The market-implied outlooks to mid-January and to mid-June of 2023 are bullish, with consistent volatility of about 31%. These outlooks are substantially different from those in my previous analysis of HD.
Summary
Consumer discretionary stocks tend to be unpopular when interest rates are rising and I believe that the substantial sell-off in HD so far in 2022 is largely due to this effect. HD had certainly gotten expensive in 2021, and the valuation limited the potential upside. With the substantial decline in the share price for the YTD and the healthy earnings growth, HD’s valuation has become considerably more attractive. The Wall Street consensus rating for HD is a buy and the consensus 12-month price target implies a total return of 30% over the next year. As a rule of thumb for a buy rating, I want to see an expected total return that is at least half the expected volatility (31%). Taking the Wall Street consensus price target at face value, the expected return is almost equal to the volatility. I somewhat discount the consensus price target because of the fairly high dispersion in the individual price targets, but the ratio of expected return can be cut substantially and still meet my risk-return criterion. The market-implied outlook for HD is bullish to early- and mid-2023, a substantial improvement from my last analysis. With the improved valuation and bullish Wall Street consensus and market-implied outlook, I am changing my rating on HD from hold to buy.
Be the first to comment