


Can we be real for a moment? This picture is so much better than a generic image of a few people pretending to be excited about learning how to use a laptop or a chart showing prices going up.
iridi/iStock via Getty Images
Get ready for charts, images, and tables because they are better than words. The ratings and outlooks we highlight here come after Scott Kennedy’s weekly updates in the REIT Forum. Your continued feedback is greatly appreciated, so please leave a comment with suggestions.
Today, I want to share a bit more on mortgage REIT analysis. I’ve told investors countless times that even though our Google Sheets (and index cards) contain the consensus analyst estimate for earnings metrics, they shouldn’t rely on those metrics.
To demonstrate why you shouldn’t rely on consensus analyst earnings estimates, I want to share a few charts.
IVR was one of the mortgage REITs that got crushed during the pandemic. Investors who focused on consensus earnings estimates got taken to the cleaners.
Allow me to demonstrate with a chart showing price to forward-estimated-earnings:

TIKR.com
The point where the P/E ratio was the highest was far from being the best time to sell. Why is that? One reason is because consensus analyst estimates are just too slow to update.
Investors who focused on them jumped right into a trap. Let’s add in the share prices and the earnings estimates for that period, so we can see what drove the change in ratios. I’ll make sure to plug in the green and brown circles again, but this time I’ll do it on the share price:

TIKR.com
Pretty clear? The P/E ratio was an awful predictor for forward price movements. It was just dreadful. Wild (and late) swings in the earnings estimates gave investors information much too late. That last day before the earnings estimate plunged was June 22nd, 2020. That was more than 2 months after most of IVR’s book value per share had been wiped out. That’s a horribly long time for investors to be trading on garbage. Investors who relied on those earnings estimates in early June got slaughtered.
Of course, we already knew book value per share was in the garbage and Scott was hammering out ratings of “Strong Sell”. I even published a bearish public article on IVR and MITT.
This doesn’t mean “earnings don’t matter”, it means “important things happened way before the consensus estimate got updated”.
There is no reason to believe the consensus estimates will be dramatically better in the future. This is simply one of the reasons investors shouldn’t rely on consensus estimates when there is better research available.
Ratings
You want ratings after all that? All right, I’ll give you ratings for some of the equity REITs I haven’t had time to publish on publicly.
Terreno (TRNO) is too cheap. Investors are underappreciating the portfolio because rents are dramatically below market. As those rental contracts are renewed / replaced, rental revenue should rip higher.
Rexford (REXR) dipped into our bullish range recently as well. That’s another great REIT with a strong balance sheet and good management. Some investors won’t like the emphasis on California, but industrial real estate in California has an exceptional supply/demand imbalance with massive demand for industrial real estate while supply has actually been reduced over the last few decades. It’s driving dramatic growth in rental rates and that’s unlikely to change in the foreseeable future. If industrial real estate prices rise so much that there is actually more supply being built (given land values in California), it would make the idea a homerun. If not, the supply/demand imbalance will remain and rental rates will continue to run higher.
REXR is one of our smaller positions also. I’d love to see shares get beat up further and create an even better entry price. That would be heaven for building the position.
Alexandria (ARE) is too cheap. Haven’t heard me talk about it before? I wrote a huge article on ARE but I haven’t got it out to the public side yet. We also bought shares after writing that article.
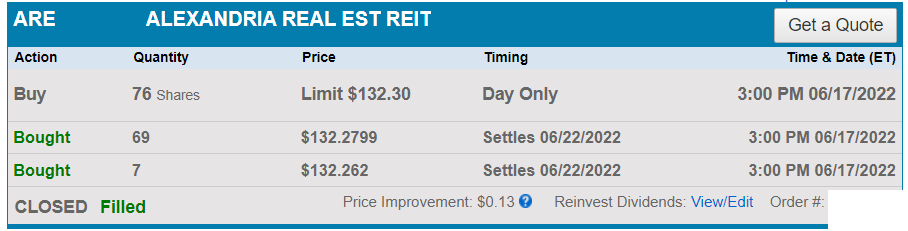
Charles Schwab
ARE was a frequent request for coverage, but we put it on the back burner until shares got way too cheap in June 2022. Then it was time to open coverage. Why not open coverage sooner? Because opening coverage when shares are fairly valued isn’t particularly interesting for most readers.
Crown Castle International (CCI) is still significantly undervalued. Yeah, I know about the thesis from Wells Fargo. Small cells are going to struggle from a negative hit to revenue of $10 million. That’s 0.14% of revenue and management disclosed it in the Q4 2021 earnings call and the Q1 2022 earnings call. You know what I call a thesis built on 0.14% of revenue? Trash. That’s a rounding error. I ripped apart the entire thesis in a sector update for cell tower REITs.
Each of these equity REITs is in my portfolio. ARE is the most recent addition, but we didn’t have that much cash on hand, so it only has a 1.15% weight. TRNO comes in at a 4.65% weight. CCI has an even larger weight at 11.24%. That’s a serious allocation.
There you have 3 good picks for REITs that can deliver solid long-term growth in AFFO per share and dividends per share. You want some high yield picks? I’ll do that next time. These are three solid choices today.
The rest of the charts in this article may be self-explanatory to some investors. However, if you’d like to know more about them, you’re encouraged to see our notes for the series.
Stock Table
We will close out the rest of the article with the tables and charts we provide for readers to help them track the sector for both common shares and preferred shares.
We’re including a quick table for the common shares that will be shown in our tables:
Let the images begin!
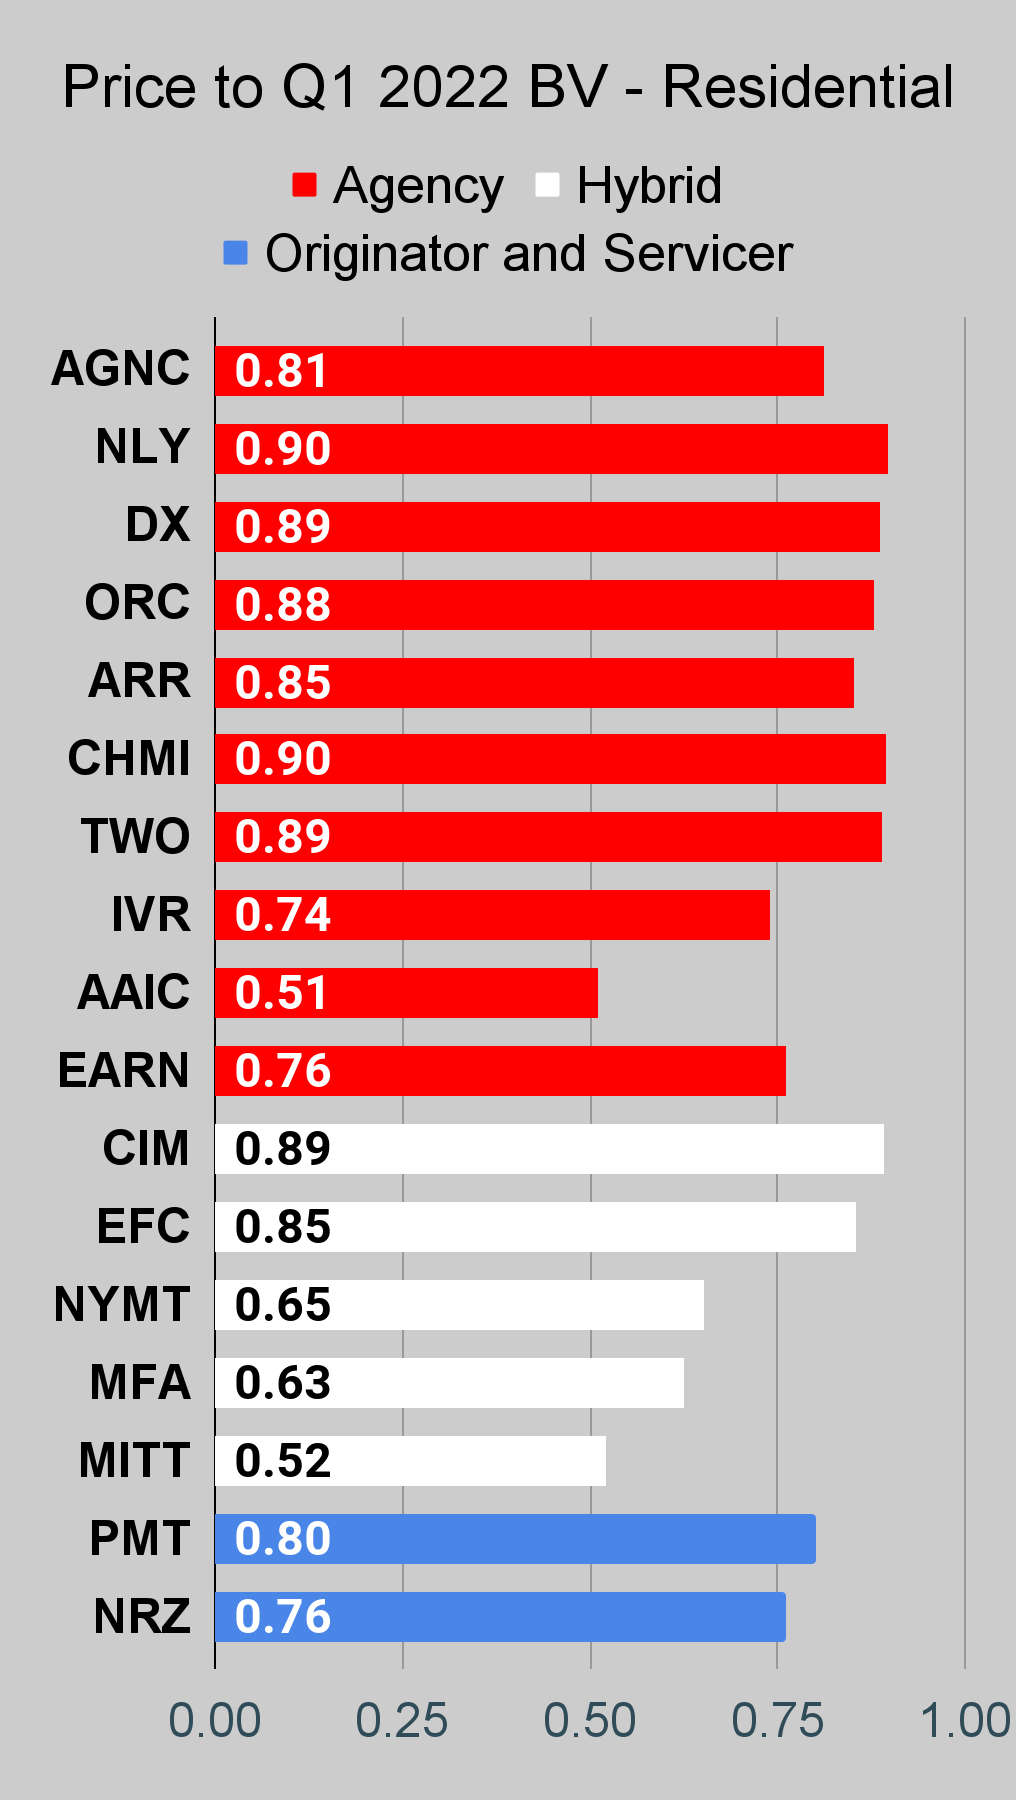
Residential Mortgage REIT Charts
Note: The chart for our public articles uses the book value per share from the latest earnings release. Current estimated book value per share is used in reaching our targets and trading decisions. It is available in our service, but those estimates are not included in the charts below.
 The REIT Forum |
 The REIT Forum |
 The REIT Forum |
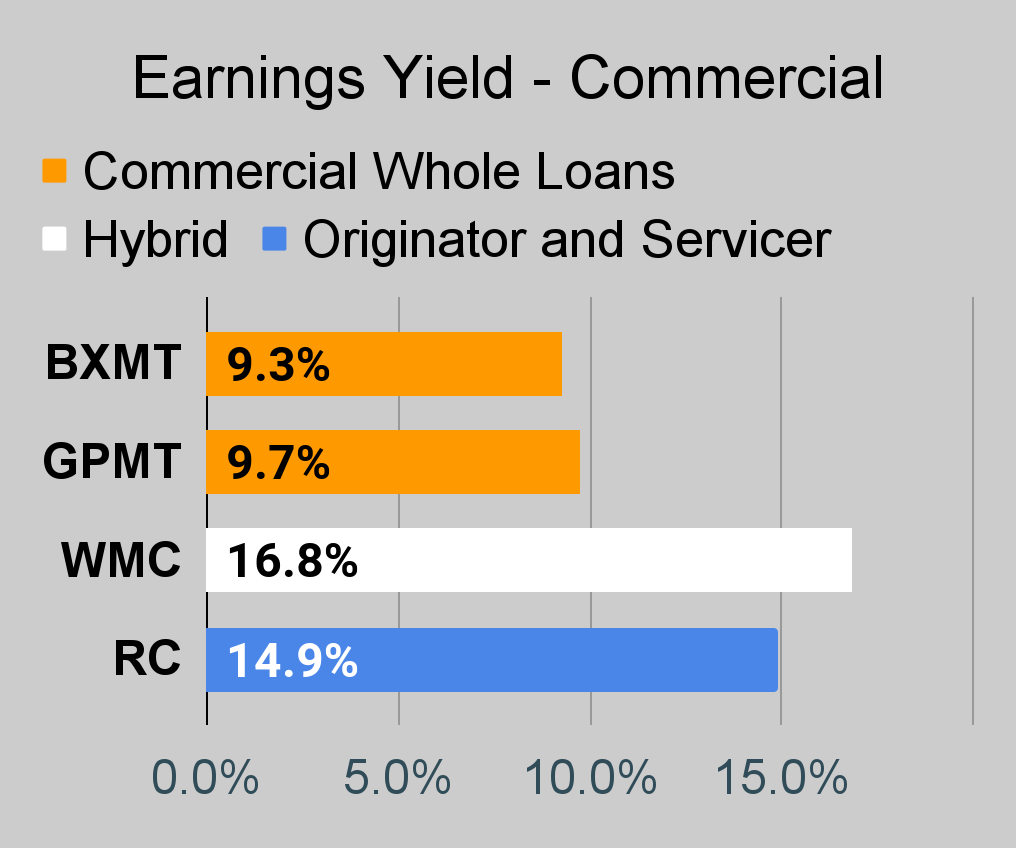
Commercial Mortgage REIT Charts
 The REIT Forum |
 The REIT Forum |
 The REIT Forum |
BDC Charts
 The REIT Forum |
 The REIT Forum |
 The REIT Forum |
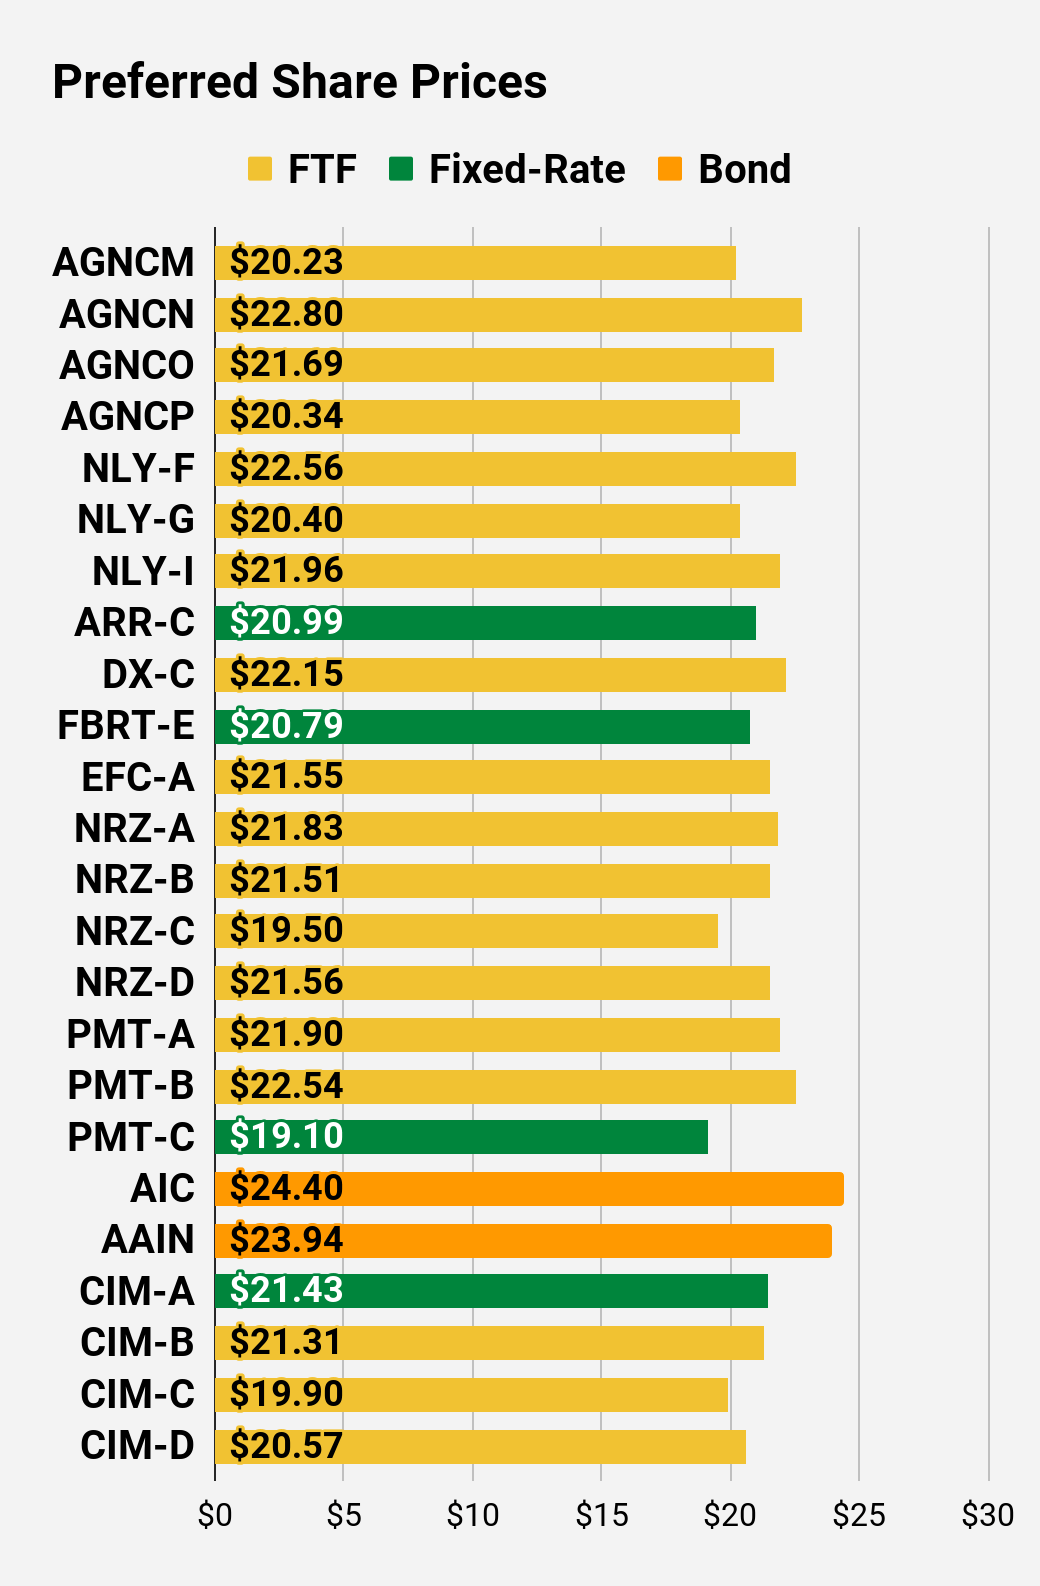
Preferred Share Charts
 The REIT Forum |
 The REIT Forum |
 The REIT Forum |
 The REIT Forum |
 The REIT Forum |
 The REIT Forum |
Preferred Share Data
Beyond the charts, we’re also providing our readers with access to several other metrics for the preferred shares.
After testing out a series on preferred shares, we decided to try merging it into the series on common shares. After all, we are still talking about positions in mortgage REITs. We don’t have any desire to cover preferred shares without cumulative dividends, so any preferred shares you see in our column will have cumulative dividends. You can verify that by using Quantum Online. We’ve included the links in the table below.
To better organize the table, we needed to abbreviate column names as follows:
- Price = Recent Share Price – Shown in Charts
- BoF = Bond or FTF (Fixed-to-Floating)
- S-Yield = Stripped Yield – Shown in Charts
- Coupon = Initial Fixed-Rate Coupon
- FYoP = Floating Yield on Price – Shown in Charts
- NCD = Next Call Date (the soonest shares could be called)
- Note: For all FTF issues, the floating rate would start on NCD.
- WCC = Worst Cash to Call (lowest net cash return possible from a call)
- QO Link = Link to Quantum Online Page
Second Batch:
Strategy
Our goal is to maximize total returns. We achieve those most effectively by including “trading” strategies. We regularly trade positions in the mortgage REIT common shares and BDCs because:
- Prices are inefficient.
- Long-term, share prices generally revolve around book value.
- Short-term, price-to-book ratios can deviate materially.
- Book value isn’t the only step in analysis, but it is the cornerstone.
We also allocate to preferred shares and equity REITs. We encourage buy-and-hold investors to consider using more preferred shares and equity REITs.
Performance
We compare our performance against 4 ETFs that investors might use for exposure to our sectors:

The REIT Forum
The 4 ETFs we use for comparison are:
|
Ticker |
Exposure |
|
One of the largest mortgage REIT ETFs |
|
|
One of the largest preferred share ETFs |
|
|
Largest equity REIT ETF |
|
|
The high-yield equity REIT ETF. Yes, it has been dreadful. |
When investors think it isn’t possible to earn solid returns in preferred shares or mortgage REITs, we politely disagree. The sector has plenty of opportunities, but investors still need to be wary of the risks. We can’t simply reach for yield and hope for the best. When it comes to common shares, we need to be even more vigilant to protect our principal by regularly watching prices and updating estimates for book value and price targets.
Ratings: Bullish on TRNO, REXR, ARE, and CCI. None of those have high yields, but for the high yield investors we just provided an education on how to avoid a mistake that has turned many shareholders into bagholders. For investors that wanted long-term dividend-growth picks, we wrapped in 4 picks I’ve been too busy to write about on the public side. These picks are also great for helping investors to diversify their portfolio. While we enjoy investing in the high-yield space, we also create a core for your portfolio using several high-growth REITs.
Be the first to comment