

jhorrocks/E+ via Getty Images
The risks are rising heading into the FOMC minutes release on Wednesday afternoon, with the VIX tumbling and the S&P 500 ETF (NYSEARCA:SPY) ripping higher over the past couple of weeks. However, a disturbing pattern has formed over the past few months, suggesting the SPY’s rapid rise is over.
The chart below shows that the pattern has been to buy the FOMC meeting and sell the FOMC Minutes since November. Before November, the pattern was less clear. But now, the pattern has become clear, given the end of QE and the Fed’s more hawkish pivot since November.
TradingView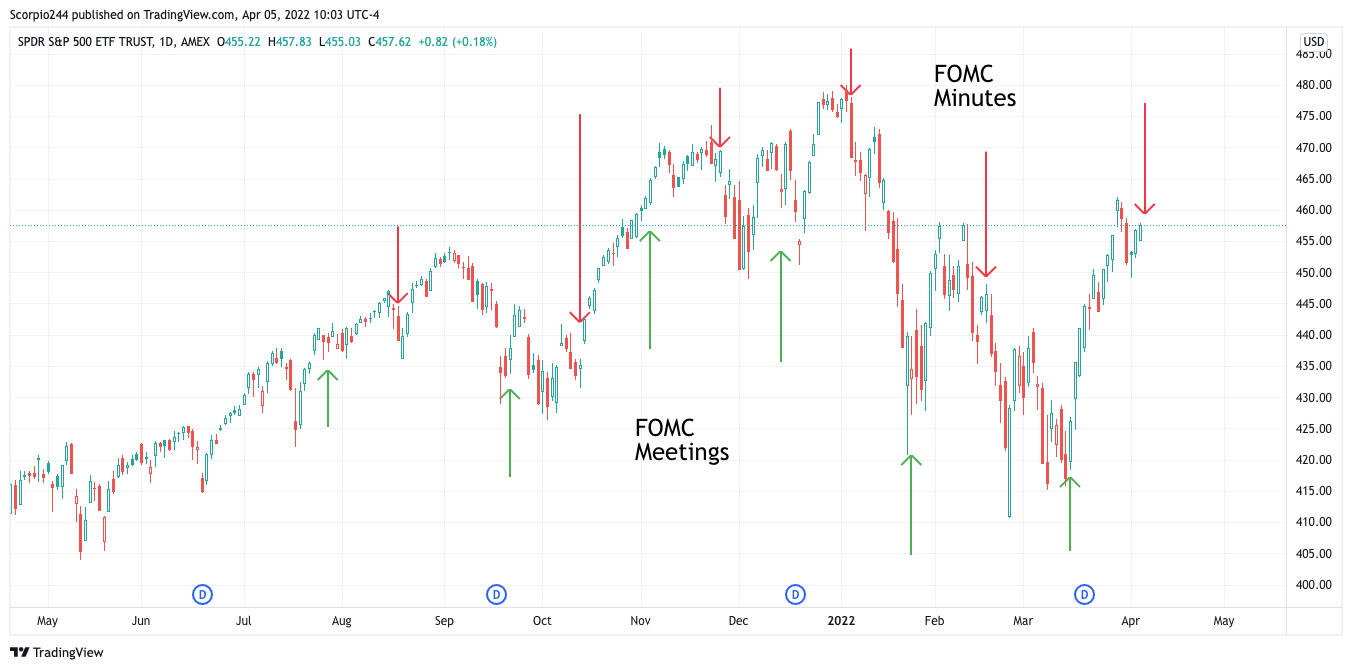
The Fed pattern is most likely a result of the Fed minutes carrying a more hawkish tone. Meanwhile, the FOMC meeting event has a press conference in which FOMC Chair Jay Powell can deliver a more balanced message. The previous March FOMC meeting also did not include details about the pace or how the Fed planned to reduce the balance sheet. The minutes due tomorrow should have many details on the balance sheet run-off. Given the big run-up in the SPY since the March FOMC meeting, those risks seem to have largely been ignored.
If the current pattern persists, which has been to sell the news following the FOMC minutes, the SPY is likely to head lower and potentially to new lows.
The FOMC pattern started in November. With the release of the FOMC minutes on Nov. 24, the SPY fell by nearly 4.5% and bottomed at around $449. When the minutes were released on Jan. 5, the SPY fell by almost 12% and bottomed just below $421. Then on Feb. 8, the SPY fell by roughly 8.5% and bottomed around $411. Each release of the FOMC minutes, to this point, has led to a lower low in the ETF.
TradingView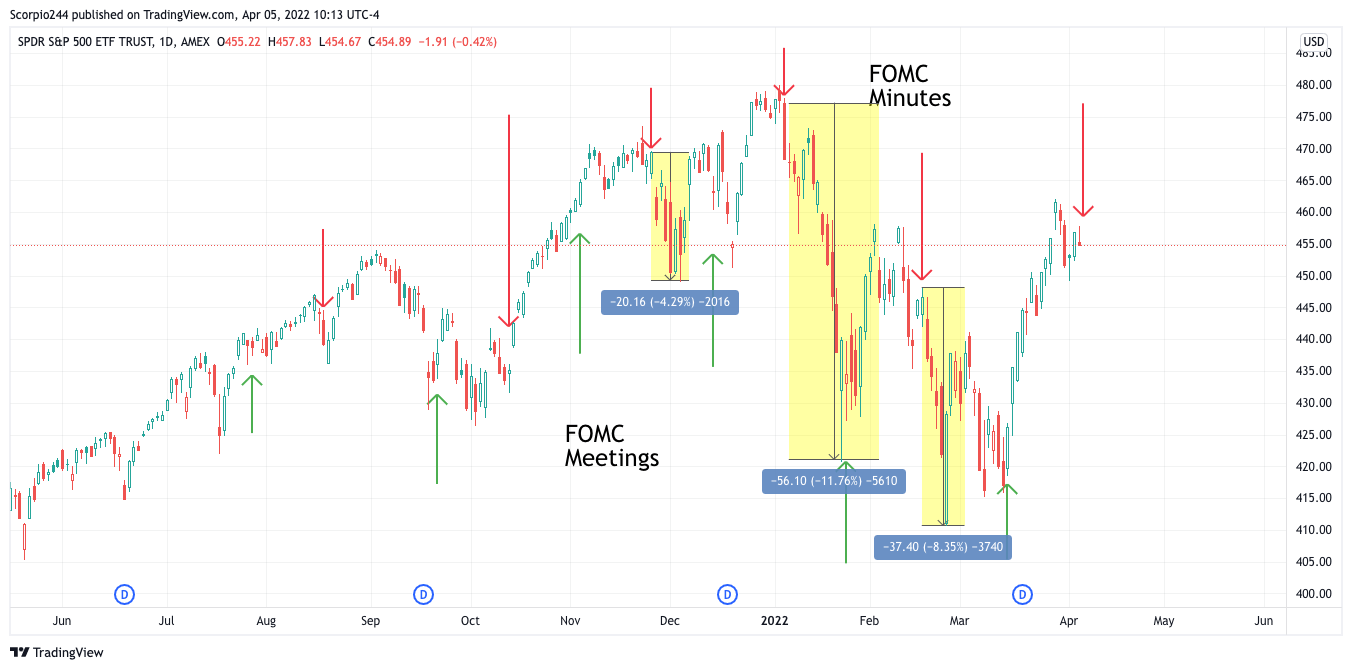
Complacent
What is odd is how complacent the SPY has been, with the VIX dropping and closing below 19 on April 4. At the same time, the same thing happened heading into the minutes on January 5, with the VIX dropping below 20.
The significant risk is that with the VIX so low and similar to the levels seen in January if the minutes spark a rush to hedge positions and invoke investors to buy puts, the drop in the SPY could be very steep.
TradingView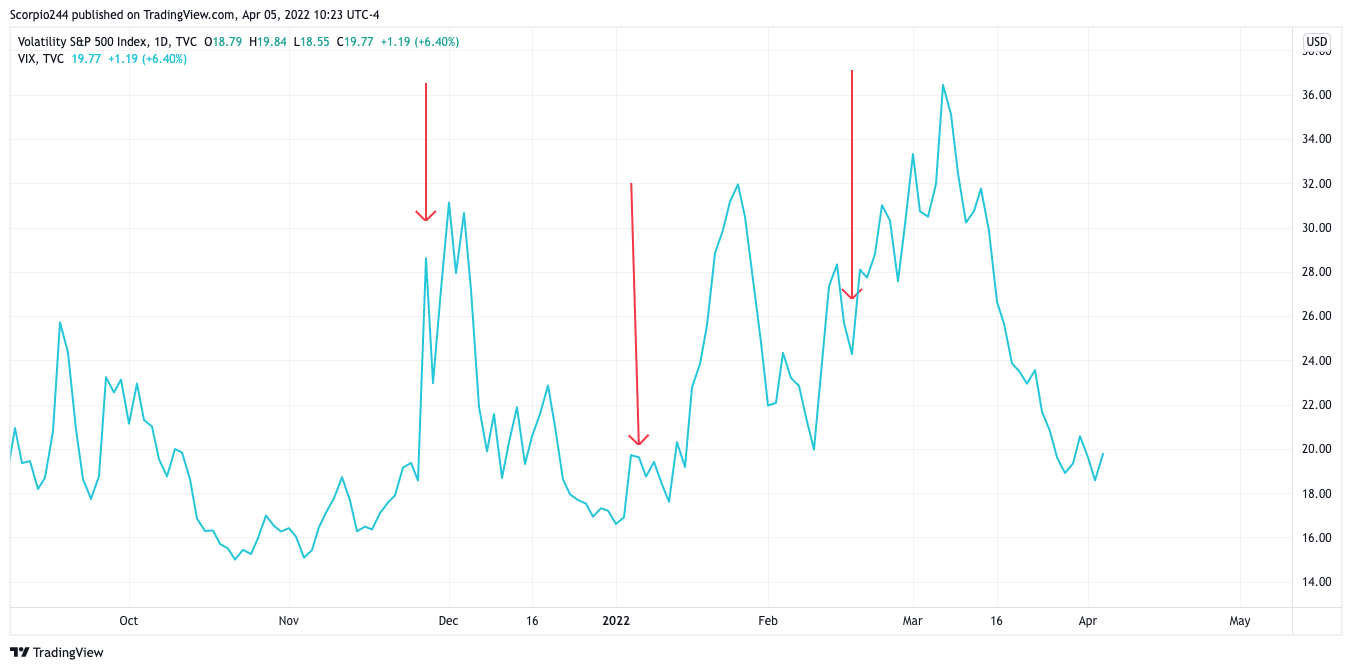
Technicals Turn
It would seem that given this complacency and the previous Fed pattern, the chances for a push lower following the FOMC minutes are high. Just last week, the SPY failed to break out when it gapped over resistance at $460 and then quickly moved back below that resistance level.
Additionally, the uptrend that formed off the mid-March lows is now broken. On top of that, because of the failed breakout, a new downtrend has started. The negative pattern may even result in the SPY falling back to $417, where there is an open gap from March 15.
TradingView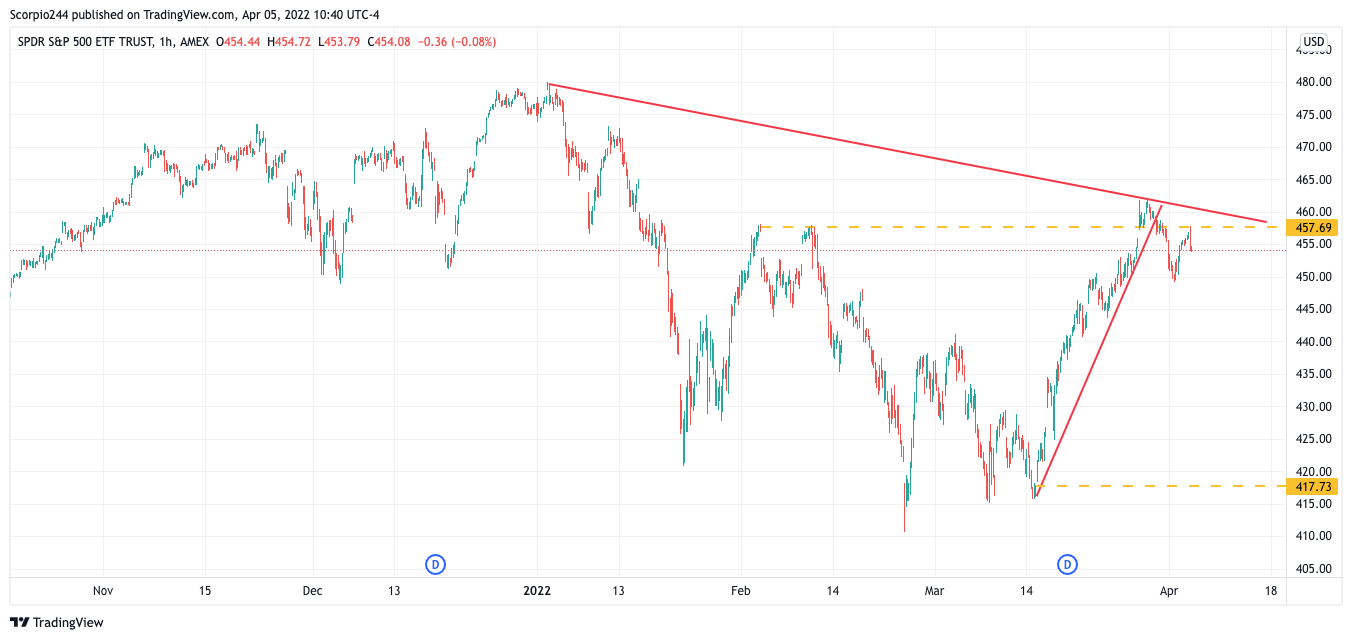
The risks are high going to the FOMC minutes tomorrow at 2 p.m. ET. The market has been too complacent, and if the pattern persists, it won’t be pretty.
Investing today is more complex than ever. With stocks rising and falling on very little news while doing the opposite of what seems logical. Reading the Markets helps readers cut through all the noise delivering stock ideas and market updates, looking for opportunities.
We use a repeated and detailed process of watching the fundamental trends, technical charts, and options trading data. The process helps isolate and determine where a stock, sector, or market may be heading over various time frames.
To Find Out More Visit Our Home Page

Be the first to comment