

Zephyr18
The Savings & Loan industry has been a fixture of American life for almost two hundred years. The purpose of S&L’s has been to help working class men and women save for the future and purchase homes. S&L’s, or thrifts, would take in deposits and lend money in the form of home mortgages. Most thrift institutions were small, community based and subject to individual state regulations. The industry was quite fragmented.
The S&L industry experienced tremendous consolidation during the Crash of 1929 and the ensuing Great Depression. Many institutions failed and others were merged. Between 1925 and 1945 the number of thrifts shrank from 12,500 to 6,700.
In an attempt to restart the housing industry and help the economy recover, much new legislation was passed. The first step was to try to create a federal system to assist the thrift industry, similar to what had been done with the creation of the Federal Reserve System for commercial banks in 1913. In 1932 the Federal Home Loan Bank (FHLB) System was chartered, and their mission was to provide liquidity to S&L’s to facilitate their ability to make mortgages available. In 1934 The Federal Savings and Loan Insurance Corp (FSLIC) was created to provide insurance for S&L depositors, and the Federal Housing Administration (FHA) was established to provide federal insurance against default by low income home loan borrowers.
One of the innovations of the FHA was the creation of the 30-year fixed rate mortgage. Before this period, most mortgages were of much shorter duration. A common mortgage in the early 20th century required a 50% down payment, and was interest only for 5 years. Then a large balloon payment was due at maturity. This limited who could borrow to the relatively wealthy who were able to afford the large down payment and balloon payment.
Under the FHA guidelines a 30 year fixed rate mortgage with amortization would only require a 20% down payment. The stretching of the term and the lower upfront investment made mortgages and homeownership more affordable for medium income families.
The post-war period was a home buying boom driven by returning war veterans and the thrift industry prospered. All was good until the late 1970’s when high inflation and rising interest rates exposed the weakness within the S&L industry, leading to the S&L Crisis.
Federal Reserve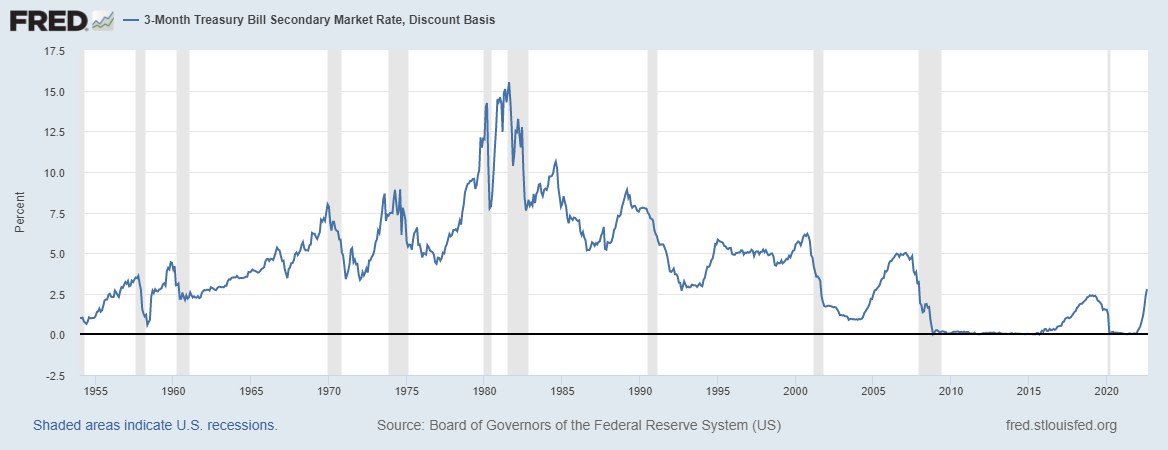
The S&L Crisis occurred for three main reasons:
- Asset -Liability Mismatch
- Inadequate Capital
- Utilization of lenient accounting practices
The fundamental problem with the S&L business model was that their assets were long term fixed rate mortgages, while their liabilities were variable rate short term deposits. This asset -liability mismatch worked in a relatively stable rate environment, but because of the mismatch, the thrifts were exposed to interest rate risk. The problem for the S&L industry arose in the late 1970’s when inflation rose by double digits and interest rates shot higher. To combat inflation Fed Chairman Paul Volker raised the Fed’s benchmark rate to 20%, with 3 month T-Bills reaching a peak of over 15%.
The thrifts were confronted with two problems. First, as rates rose, their fixed rate assets declined in value. On the other side of their balance sheet, because the rates they could pay their depositors were capped by Regulation Q, they saw an exodus of deposits as their customers sought higher returns from competing products, like money market funds.
The industry sought regulatory relief and in 1982 the Garn-St. Germain Bill was passed allowing thrifts to pay higher rates on their deposits. However, this only solved part of the problem. While S&L’s could pay competitive rates to attract back depositors, they still held the lower yielding fixed rate mortgages. Their net interest margins turned negative. That is, the yield they earned from their fixed rate assets was lower than the rate they were paying to their depositors, thereby creating operating losses.
The operating losses took a toll on the cumulative capital of the industry. In 1972 thrifts had a combined net worth of $16.7 billion, but by 1980 it had plummeted to a negative $17.5 billion. More than 85% of all S&L’s were losing money.
The problem was severe, but it was hidden from the public by extremely lenient accounting practices. Thrift assets were carried on their books at historical cost, despite the fact that the market value was significantly lower. Although many institutions were technically insolvent, they were allowed to continue operating.
Ultimately, the Resolution Trust Corporation was established to clean up the mess, and by the time the dust had settled in 1995, more than half of all S&L’s had closed at a cost to the taxpayers of $124 billion.
(Note: There were other reasons for the S&L Crisis, like aggressive lending practices, deregulation and fraud, among others, but these only exacerbated the problem.)
The ensuing period was one of steady growth and rising home prices. The securitized mortgage market took off. Because of the appreciation in home prices, financial firms encouraged homeowners to tap their newfound equity. Cheap credit led to predatory lending which targeted low income borrowers. Financial innovation led to the creation of new financial instruments tied to the mortgage backed securities (MBS). Derivative securities based on leverage dramatically increased the risk exposure of large financial institutions.
Standard & Poor’s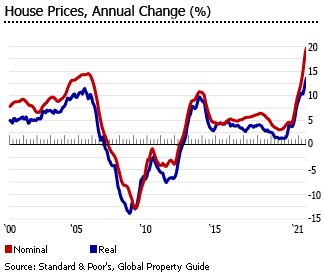
When the housing bubble popped in 2008, it caused severe damage to many large financial institutions. The systemic risk to our financial system became apparent. Culminating with the bankruptcy of Lehman Brothers, the Federal Reserve stepped in.
They realized that the potential losses were so massive that the entire financial system, as we know it, was at risk of collapse.
How the Fed Became the Largest S&L in the World
Initially the Fed used their most effective monetary policy tool and cut the Fed Funds rate to almost zero. However, more support was necessary so they turned to more unconventional methods.
Using Open Market Operations, the Fed embarked on a series of Large Scale Asset Purchases, more commonly known as Quantitative Easing, to try to stimulate the economy and add liquidity to the system. This resulted in a massive expansion of their balance sheet.
Traditionally, when purchasing securities the Fed would buy mostly short term US Treasury securities to avoid credit risk and interest rate risk. During this period, though, they deviated from this historical policy.
For the first time ever, the Fed purchased GSE mortgage backed securities as part of their SOMA holdings. They were attempting to improve the liquidity of banks by removing these illiquid assets, which were partially responsible for the onset of the financial crisis, from banks balance sheets. In doing so, the Fed transferred the risk to their own portfolio.
Federal Reserve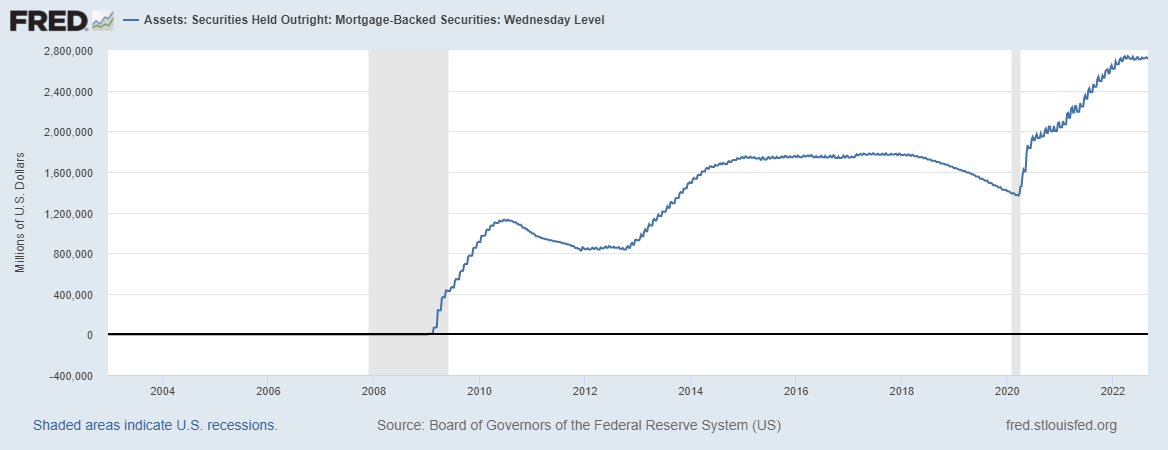
The Fed didn’t tread lightly. They purchased huge quantities of these MBS . In fact, the Fed soon became the largest holder of MBS in the world! From zero, within two years the Fed owned over $1.0 trillion in MBS, and although initially these holdings were intended to be temporary, they continued to buy. Currently the Fed owns $2.7 trillion of MBS, which represents 22.7% of the entire MBS market.
SIFMA and Federal Reserve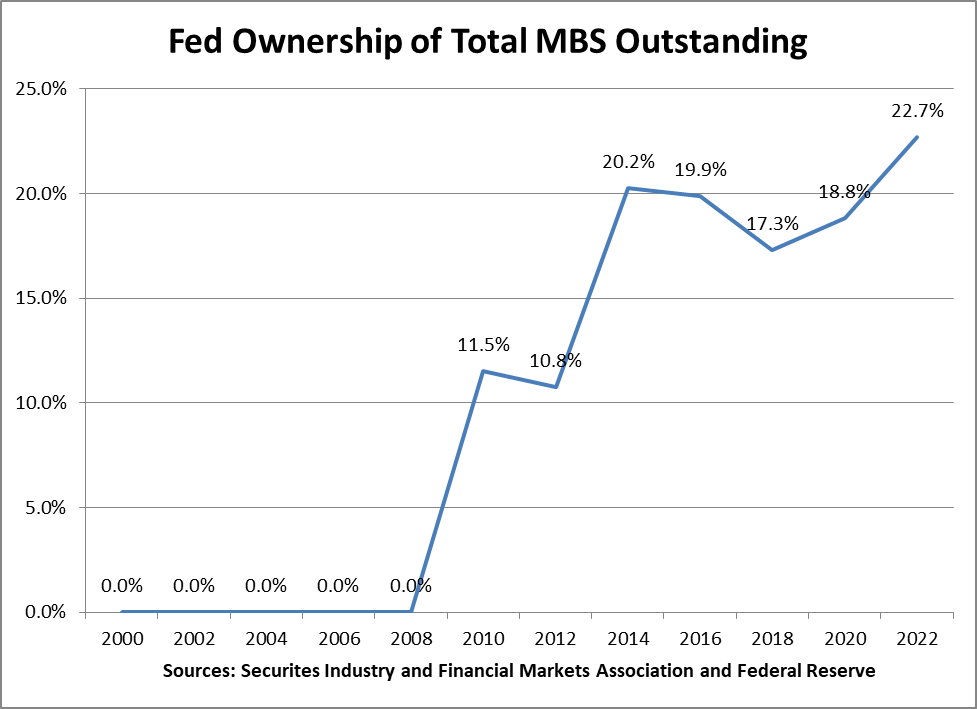
Since 2008 when the Fed began buying MBS, the MBS market has grown from $9.5 trillion to $12.2 trillion, an increase of $2.7 trillion. Essentially then, the Fed has purchased all of the increased issuance of MBS over the past 14 years. Now, as the Fed is reducing its balance sheet, they will no longer be the marginal buyer of MBS.
The Fed deviated from their policy of mostly buying short term US Treasury securities by purchasing a larger percentage of US Treasury Notes and US Treasury Bonds, as well. They soon also became the largest owner of US Treasury securities in the world. Currently they own $5.9 trillion of US Treasury debt, which represents 24.5% of all outstanding public Treasury debt. By owning these Treasury and MBS holdings, the Fed dramatically increased their interest rate exposure.
The Fed balance sheet, which now stands at $8.9 trillion, looks like that of an S&L. Unfortunately, the Fed seems not to have heeded the lessons from the S&L Crisis, as they have made the same three critical mistakes.
Asset -Liability Mismatch
The Fed’s balance sheet consists of primarily fixed rate long term MBS and Treasury securities, which are funded primarily by variable rate liabilities, namely bank reserves and reverse repurchase agreements. This creates the asset-liability mismatch.
During the initial period when inflation and interest rates were low, this mismatch was not a problem. On an operating basis the Fed showed consistent and strong operating earnings. But like during the S&L Crisis, when inflation and interest rates rose, earnings from operations suffered. We are in that environment now.
In the minutes to the July 26-27, 2022 Federal Open Market Committee meeting, it was announced that “Staff projections suggested that net income would likely turn negative in coming months.”
According to the just released Federal Reserve Banks Combined Quarterly Financial Report for June 30, 2022 we can see that the Fed earns a fixed rate of 1.87% on its SOMA portfolio of $8.7 trillion. They must pay variable short term rates on their bank reserves and reverse repurchase agreements, which together total $5.6 trillion. A back of the envelope calculation suggests that the break-even rate for operating income is 2.91%.
While the Fed earnings are fixed, the interest expense they must pay is variable and is rising. We estimate that for the third quarter, the effective cost the Fed must pay on their liabilities is 2.15%, which will cause quarterly net income to shrink to $10.8 billion. This represents a 65% decline from the second quarter.
Federal Reserve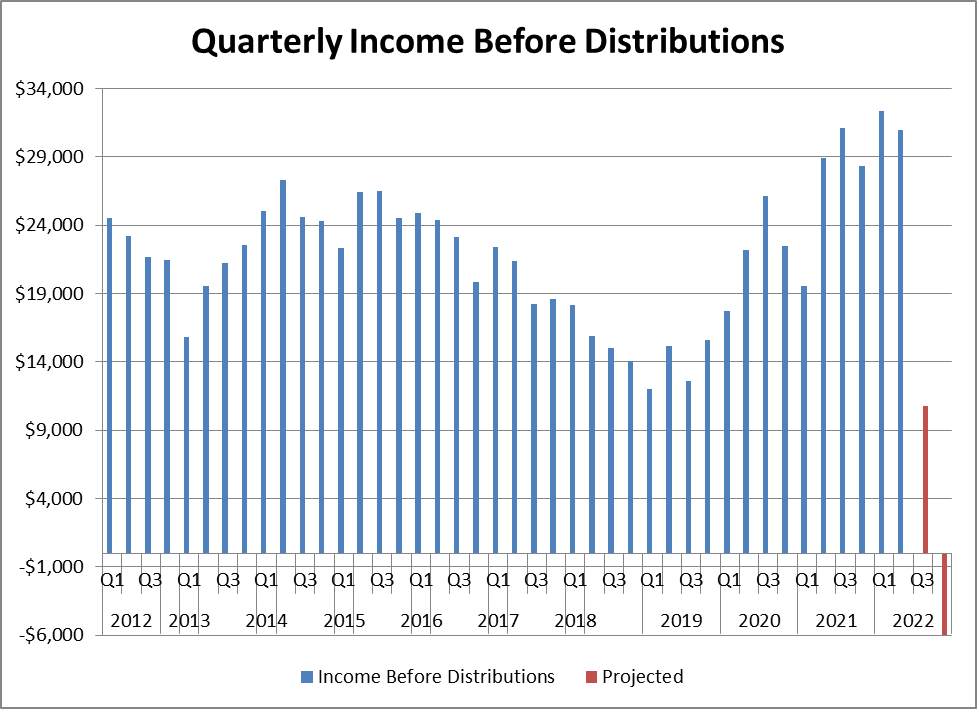
Given Fed Chairman Powell’s most recent statements about how the Fed “won’t back down on inflation,” we can expect another 75 basis point rate hike when the Fed meets on September 20-21. This would set the Fed Funds rate in the range of 3.00-3.25%, which would bring short rates over the breakeven rate of 2.91%. Hence, we can see that the Fed is referring to the fourth quarter when they will lose money.
The Fed has not lost money in 107 years!
And this is not a one-time quarterly loss. Cleveland Fed President Loretta Mester asserted that the Fed Funds rate should rise to 4% by early next year, and will stay elevated for quite some time, until inflation returns to the 2% range. If rates stay at 4% for all of 2023 the Fed will record operating losses of over $60 billion for the year.
This is not the only problem the rise in rates is causing. The Fed’s SOMA portfolio lost money again on a mark to market basis and now has an unrealized loss of $719 billion as of June 30th. As rates continue to increase, this loss will only get larger.
Federal Reserve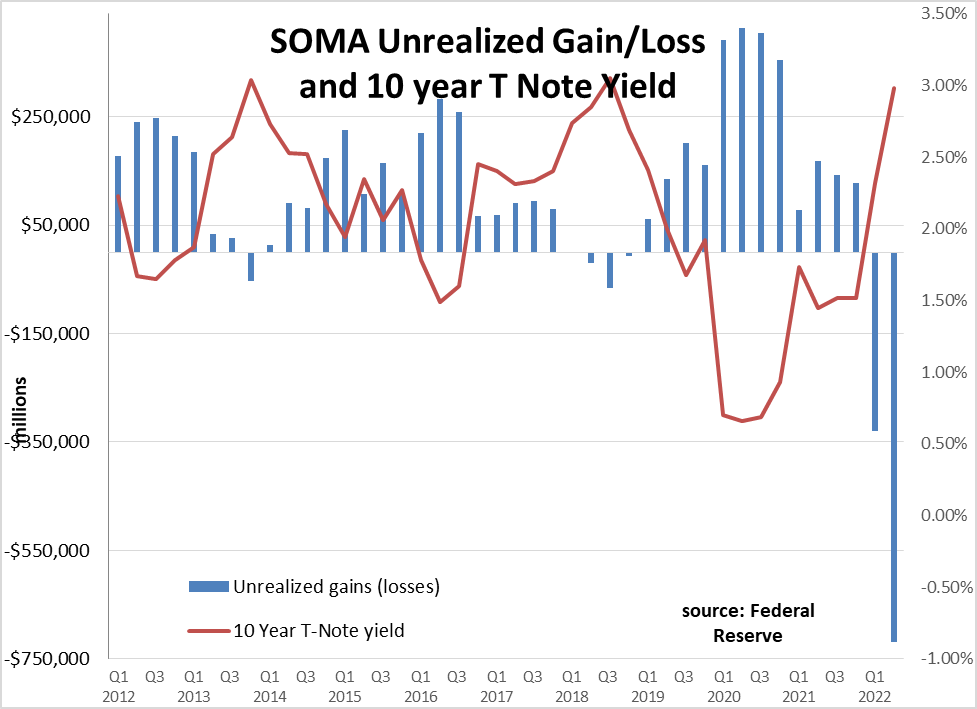
Fed Capital Inadequacy
The Fed’s capital structure has two components. The first is “paid-in-capital”, which comes from the member banks. By law, each member bank must invest an amount equal to 3% of their own capital stock and surplus in the Federal Reserve. The second part is the “surplus” which represents that portion of net income which is retained. The Federal Reserve Act has capped the surplus amount, with all earnings above the cap returned to the Treasury.
While the Fed balance sheet has ballooned since the 2008, increasing by a factor of 10 from $850 billion to $8.9 trillion, the capital account has not kept pace. As such, the Fed’s Capital/Asset Ratio has declined from a high of 4.1% in 2007 to its current level of 0.47%.
Federal Reserve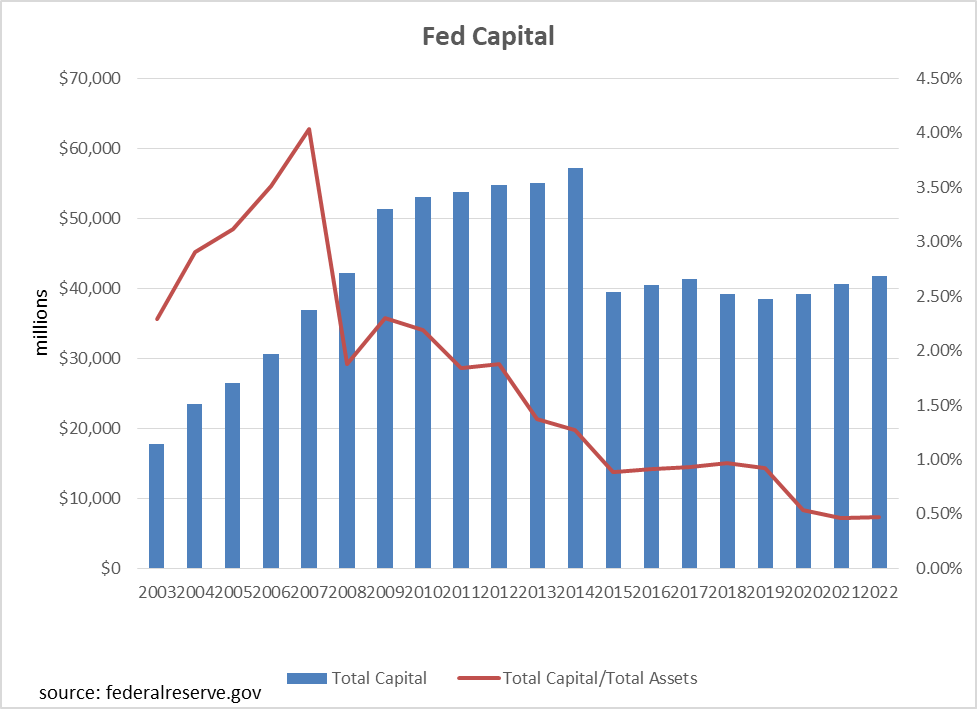
Total Fed Capital is now $41.7 billion, so the Fed balance sheet is leveraged 213 times.
One of the purposes of the Fed’s capital account, according to a 2002 General Accounting office study is to “provide assurance of the central bank’s strength and stability.” Total Capital at these levels does neither.
Member banks are required to keep another 3% of their own capital on reserve, as a buffer for the Fed’s capital account. But even this added contribution wouldn’t show strength and stability.
With the current $719 billion unrealized SOMA portfolio loss, and a potential $60 billion operating loss in 2023, $41.7 billion in capital seems inadequate.
Lenient Accounting Practices
Under Fed accounting principles as determined by the Federal Reserve Board of Governors, the Fed carries securities in their SOMA portfolio at amortized cost. Any premium or discount at purchase is amortized over the life of the security so that the amortized cost equals the principal value of the security at maturity. There is no gain or loss.
If a security is sold, the accounting treatment is different. The market value of the security that is sold is compared with the amortized cost that the security is carried at. If the market value of the sale is higher than the amortized cost, a gain is recorded, and if the market value is less than the amortized cost, there is a loss.
As mentioned above, the market value of the portfolio is currently at a significant unrealized loss. If securities were to be sold, then the loss would be recognized. It is for this reason that the Fed is reducing its balance sheet through maturity roll offs and pay downs, so it doesn’t have to recognize the loss.
As for the operating losses that will soon appear, the Fed has another way of accounting for it so as not to impact the capital account. Operating losses will be carried as a “deferred asset,” which is carried as a negative liability.
Both of these treatments are ways to hide the true picture of their financial health.
Implications
During an extraordinary period in 2008 the Fed stepped in to maintain the integrity and stability of our financial system. Because of the uniqueness of the time, they were forced to use unconventional tools. They either ignored, or forgot the three lessons of the S&L Crisis and wound up repeating them.
- They created a balance sheet asset-liability mismatch
- They did nothing to bolster their capital while increasing their balance sheet tenfold
- The used lenient accounting practices to hide their overall financial condition
In doing so, the Fed became the largest S&L in the world.
While the unconventional measures were expected to be temporary, the Fed has had a very difficult time normalizing their actions.
As a result, the Fed finds itself in a bind. As they carry out their dual mandate of maintaining full employment and stable prices, the tools they must use are causing the Fed’s financial position to deteriorate.
The Fed continuously states that the unrealized losses in their SOMA portfolio and their losses on an operating basis will not “impair the Fed’s ability to conduct monetary policy or fulfill any of its other responsibilities.”
Time will tell if this is true.
The strength of the Fed is that the market has confidence in their ability to be the last stop in a crisis. As the inherent financial weakness the Fed now confronts becomes more widely understood, the Fed risks losing that market confidence.
Be the first to comment