

Pgiam/iStock via Getty Images
On October 10th, I wrote an article (here) indicating that the equity puts to calls ratio had not yet gone to the extremes expected at a major bear market low. Essentially, there had not yet been enough put buying. That has changed over the last five weeks, and we now have that extreme reading. We use a time weighted, twenty day moving average, so this is not a short-term metric. While it is not as extreme as that reached at the lows of the financial crisis after a two-year decline, it matches every other major low.
It’s significant that it occurred as the stock market rallied. From experience that’s a very rare and powerful signal since the ratio normally declines as prices rise. This signal has finally moved this important indicator in line with the other classic sentiment indicators signaling a major intermediate to long term price advance.
Equity Puts to Calls Ratio (Michael McDonald)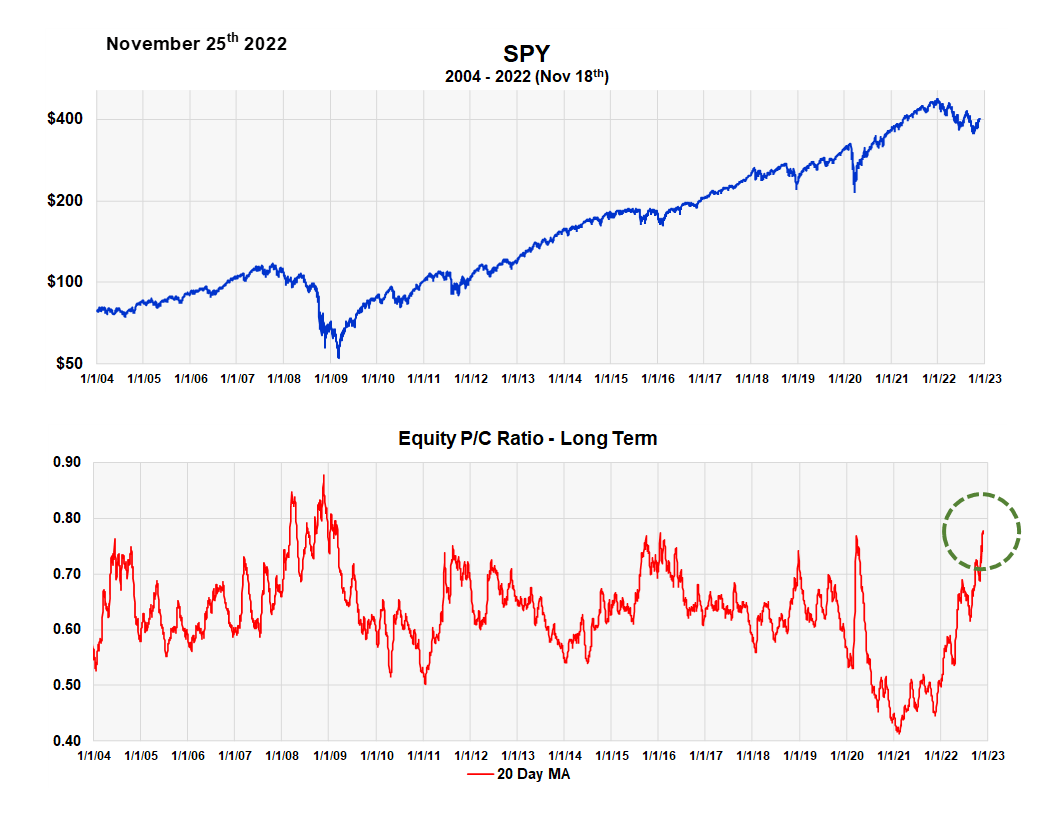
This signal is based on the well-established theory of contrary opinion. A more detailed explanation of the theory is written in this July 28th article, but I’ll summarize here.
Why is Contrary Opinion so Effective?
I’ve been studying and using this theory for 50 years, yet I still don’t fully understand why it works so well. I am aware of the typical explanations, namely that with everyone bullish there are no more buyers left so prices decline from lack of buying. At the bottom, it works the other way around. With no one left to sell after everyone’s became pessimistic and liquidated their positions, prices start to increase with very little purchasing.
However, it goes beyond this. People have forgotten there’s an economic component behind the theory. In fact, the economy was the focus of Humphrey Neill’s original 1954 book, “The Art of Contrary Thinking,” not the stock market. He noted how many times people expected a recession or expansion and got the opposite. For example, after World War 2, people anticipated inflation, but it never materialized.
Of BABES and O’BUCS
If contrary opinion is fundamental at predicting the economy or stock market, as I and many others think, then it follows that there must be a BABES and an O’BUCS.
BABES stands for Broadly Accepted But Essentially Wrong Scenario. OBUCS means “Occluded But Ultimately the Correct Scenario.” Applying the theory entails looking for the O’BUCS concept, which represents the economic scenario people are missing or overlooking. It’s finding the economic scenario that will soon emerge that will explain why stock prices went opposite everyone’s expectations.
So, if sentiment indicators show extreme levels of bearish sentiment and are pointing to higher prices, you don’t simply deny it and go on agreeing with the economic reasons making people so bearish. You question it. You have confidence in what the indicators are saying and start searching for the alternate economic situation that is most likely come about.
So, what’s the O’BUCS idea? I believe it’s the same OBUCS idea I detailed in the July 28th article, which is contained below:
So, what’s the current O’BUCS idea? It’s that this sudden jump in inflation is temporary and about to end. Serious, endemic inflation doesn’t start this way; it starts gradually then grows bigger and bigger. Both the suddenness and the size of this current round are clear signs to me of a temporary situation. I think the Fed rate hikes will bring an end to it real fast and even bring about some deflation and they will quickly reverse their actions. By that time the market will be 25% to 50% higher.
Be the first to comment