

YvanDube
This article looks at the past 20 years of Costco’s (NASDAQ:COST) financial performance on a square foot basis. Figures presented are annual and do not include the most recent Q1. There’s a good deal of information in the charts below, so I’ve kept the wordcount low and let the charts tell the story.
We’ll be using a variation of the ‘Dupont’ breakdown derived exclusively for brick & mortar retail. The governing equation is shown below. I believe it’s the best way to analyze the unit economics of a B&M retailer.
Author Generated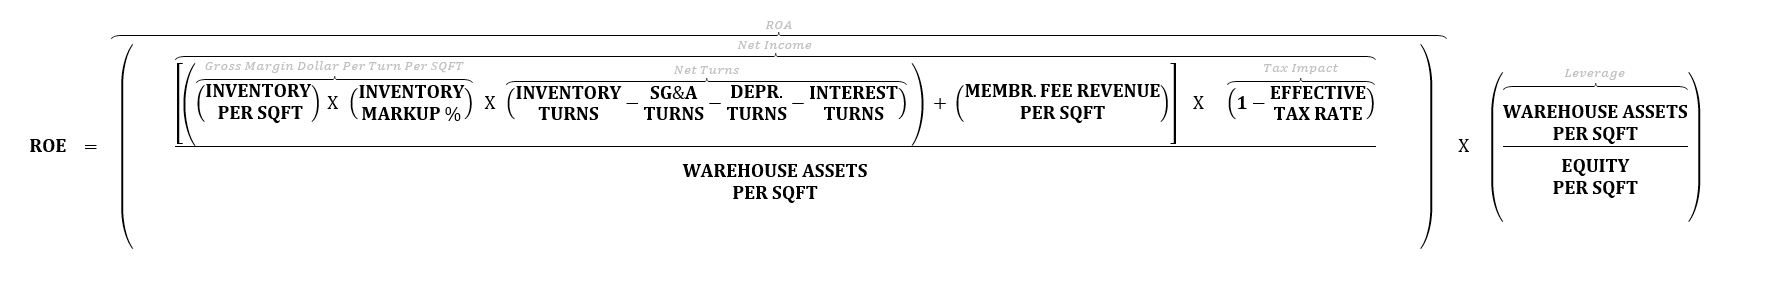
Note: The terms in the equation correspond with charts C – N below. Additional detail on term definitions and derivation can be found here.
Costco’s Value Proposition
Despite popular belief, it only takes a few hundred dollars (not $3k) of spending to save vs. popular retailers. Once you make the choice to join, upgrading to Executive status makes sense above $3,000 of spending (not $6k). Recent inflation may even be helping push more members over to Executive…
Author Generated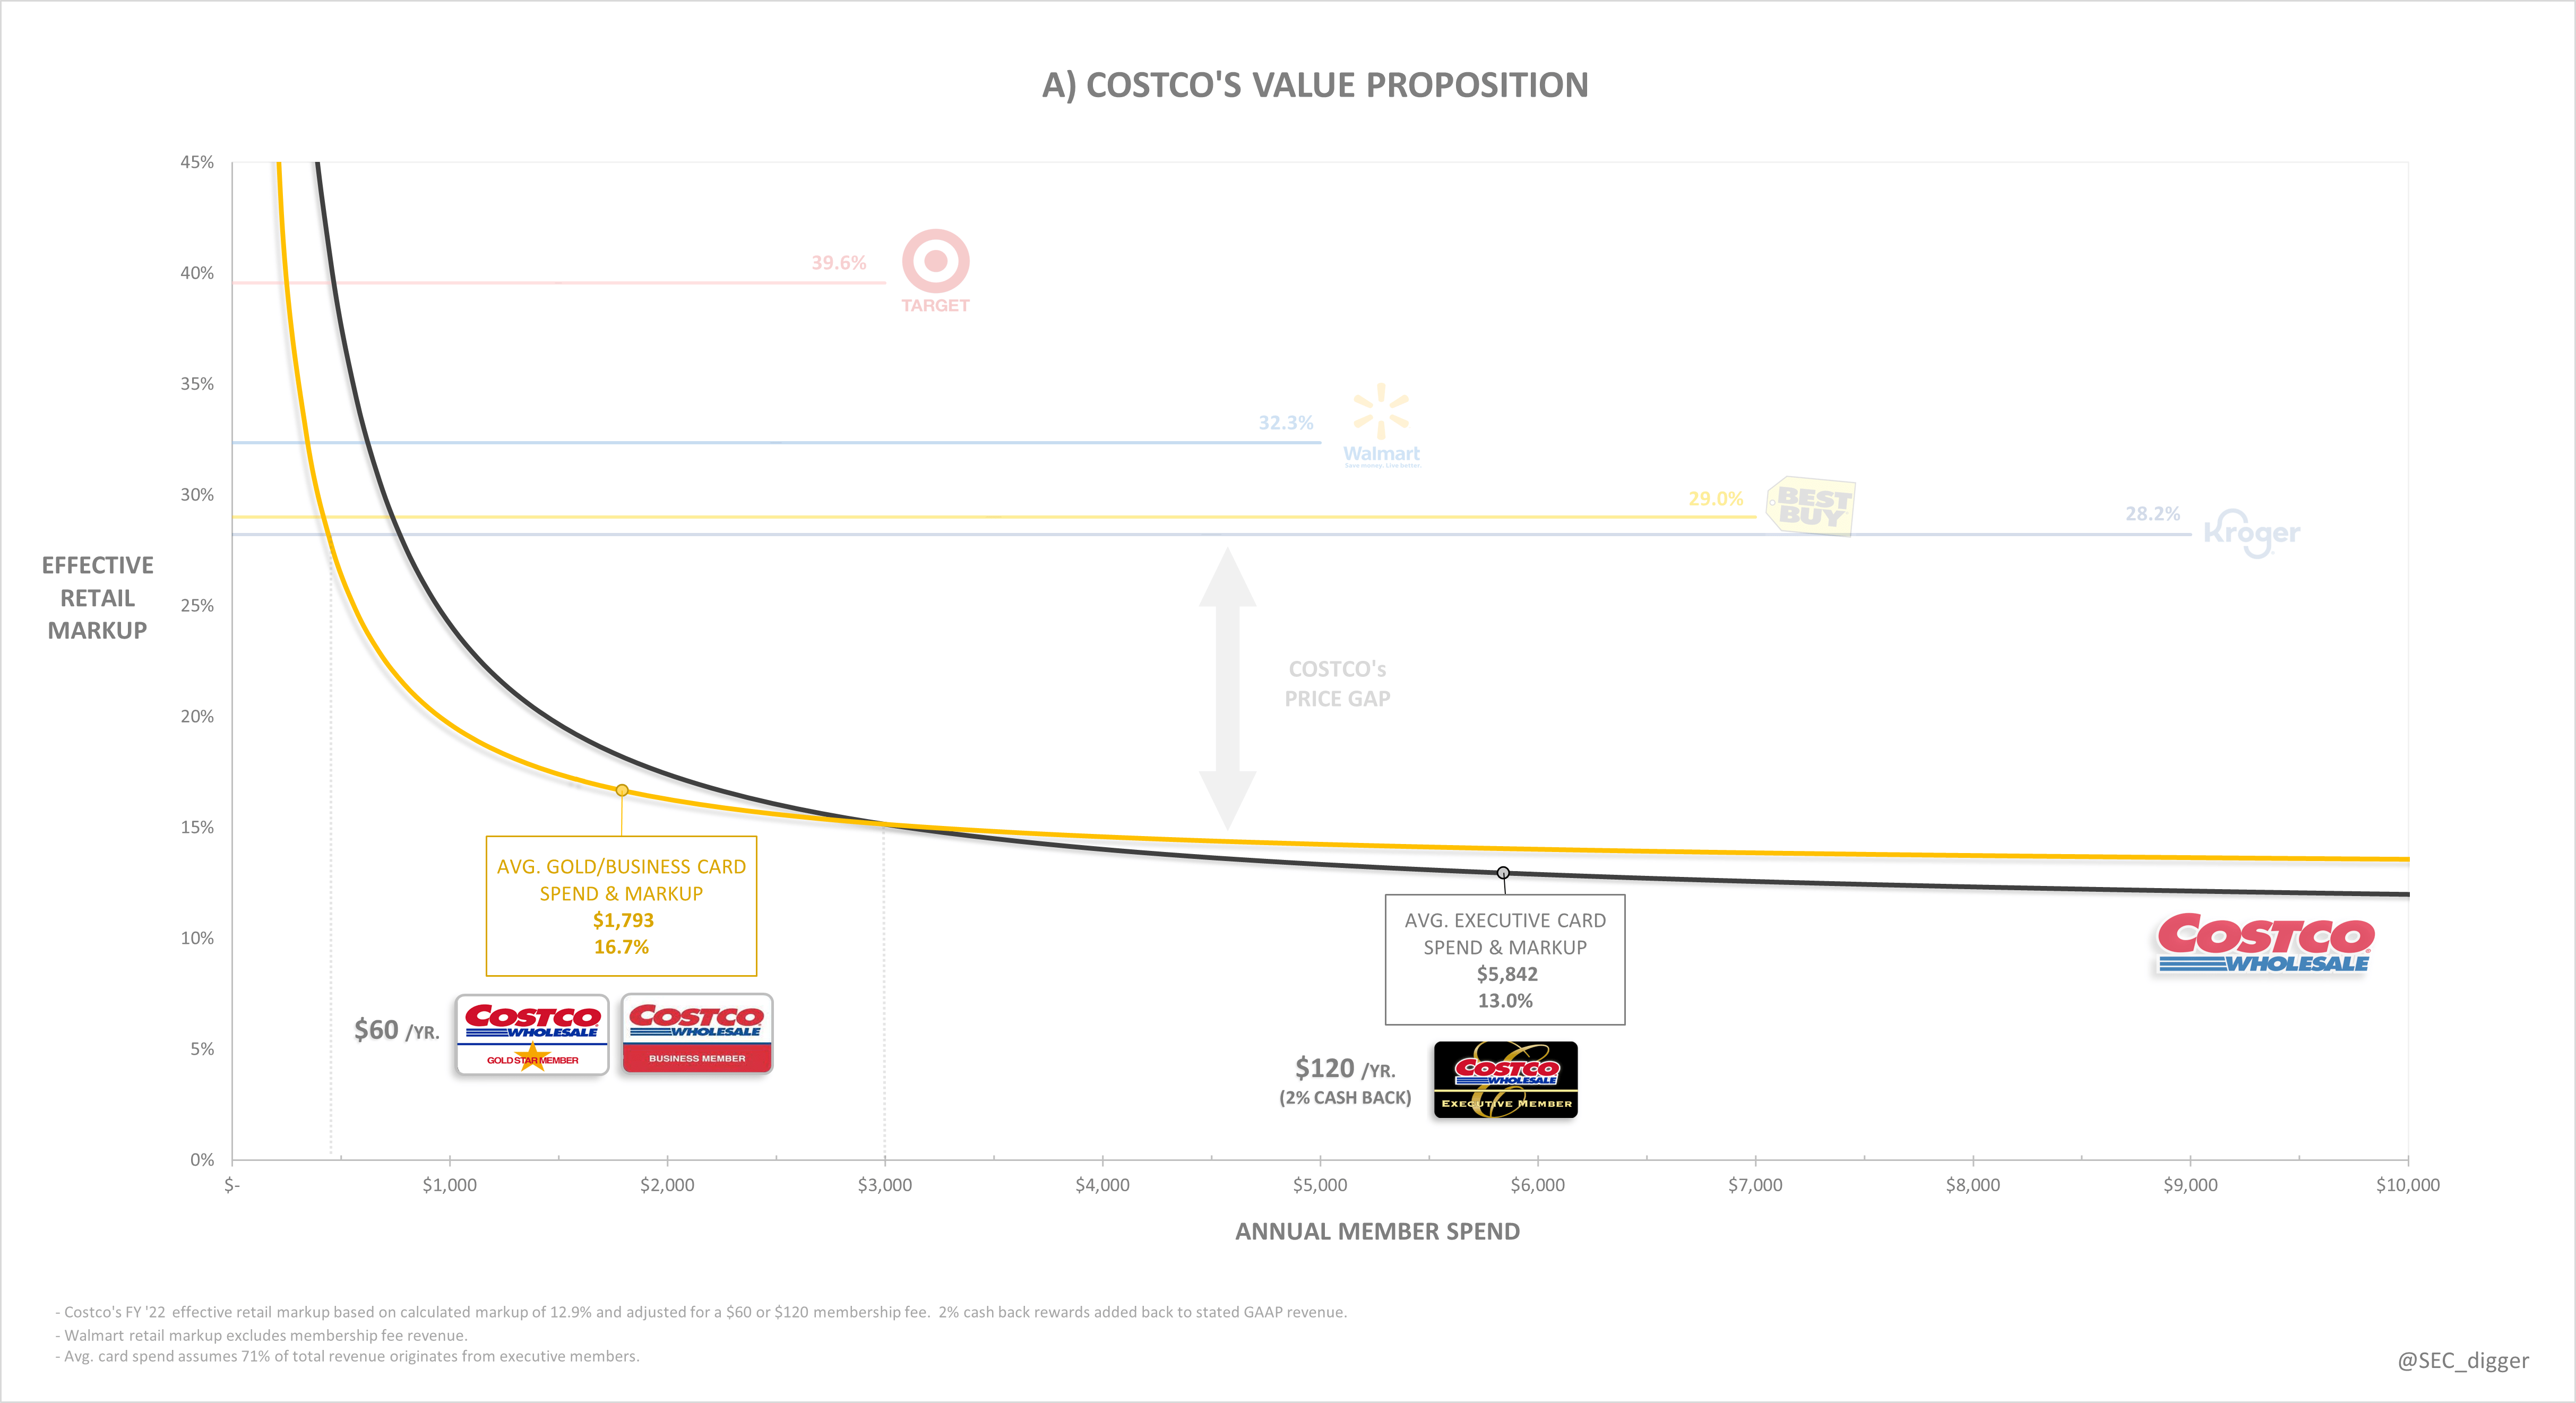
Products
Product SKUs are kept at a less than 4,000. Food & Sundries have contributed the most dollar growth this decade, but Ancillary & Other are growing the fastest…
Author Generated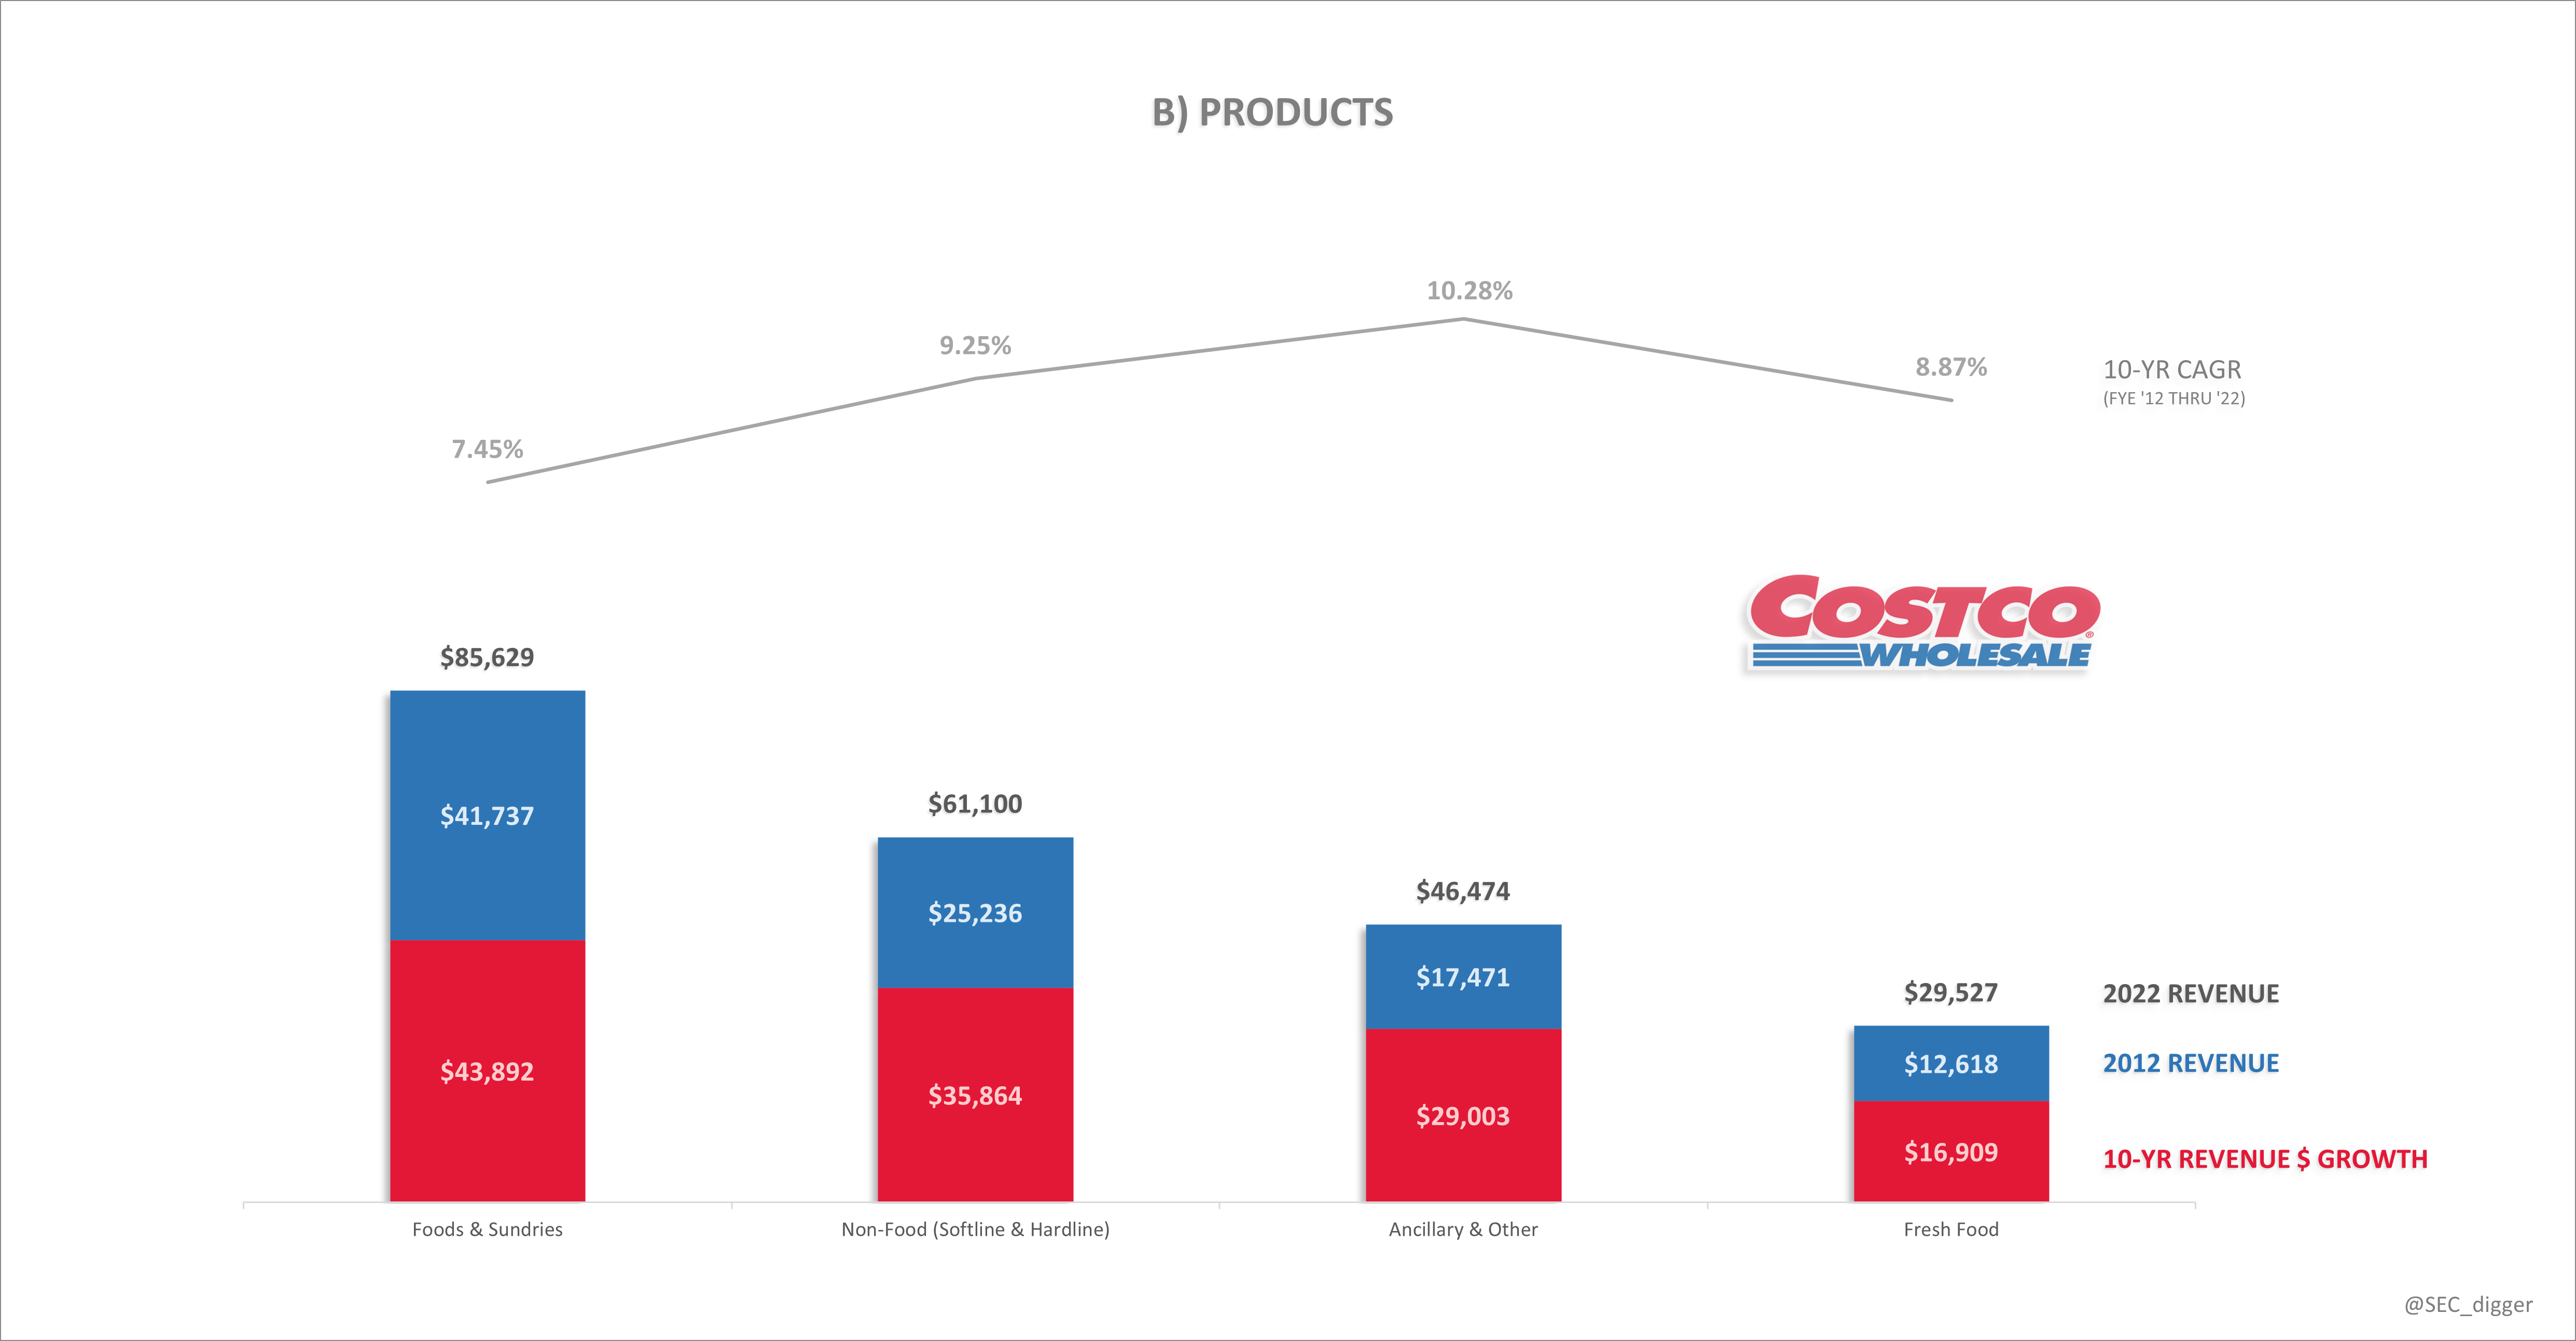
Total Square Feet
Costco’s average retail footprint has grown at a 4.5% CAGR over the last 2 decades but has been slowing recently. Their 2020 acquisition of Innovel has accelerated distribution center, or DC, growth to help support the company’s shift to online…
Author Generated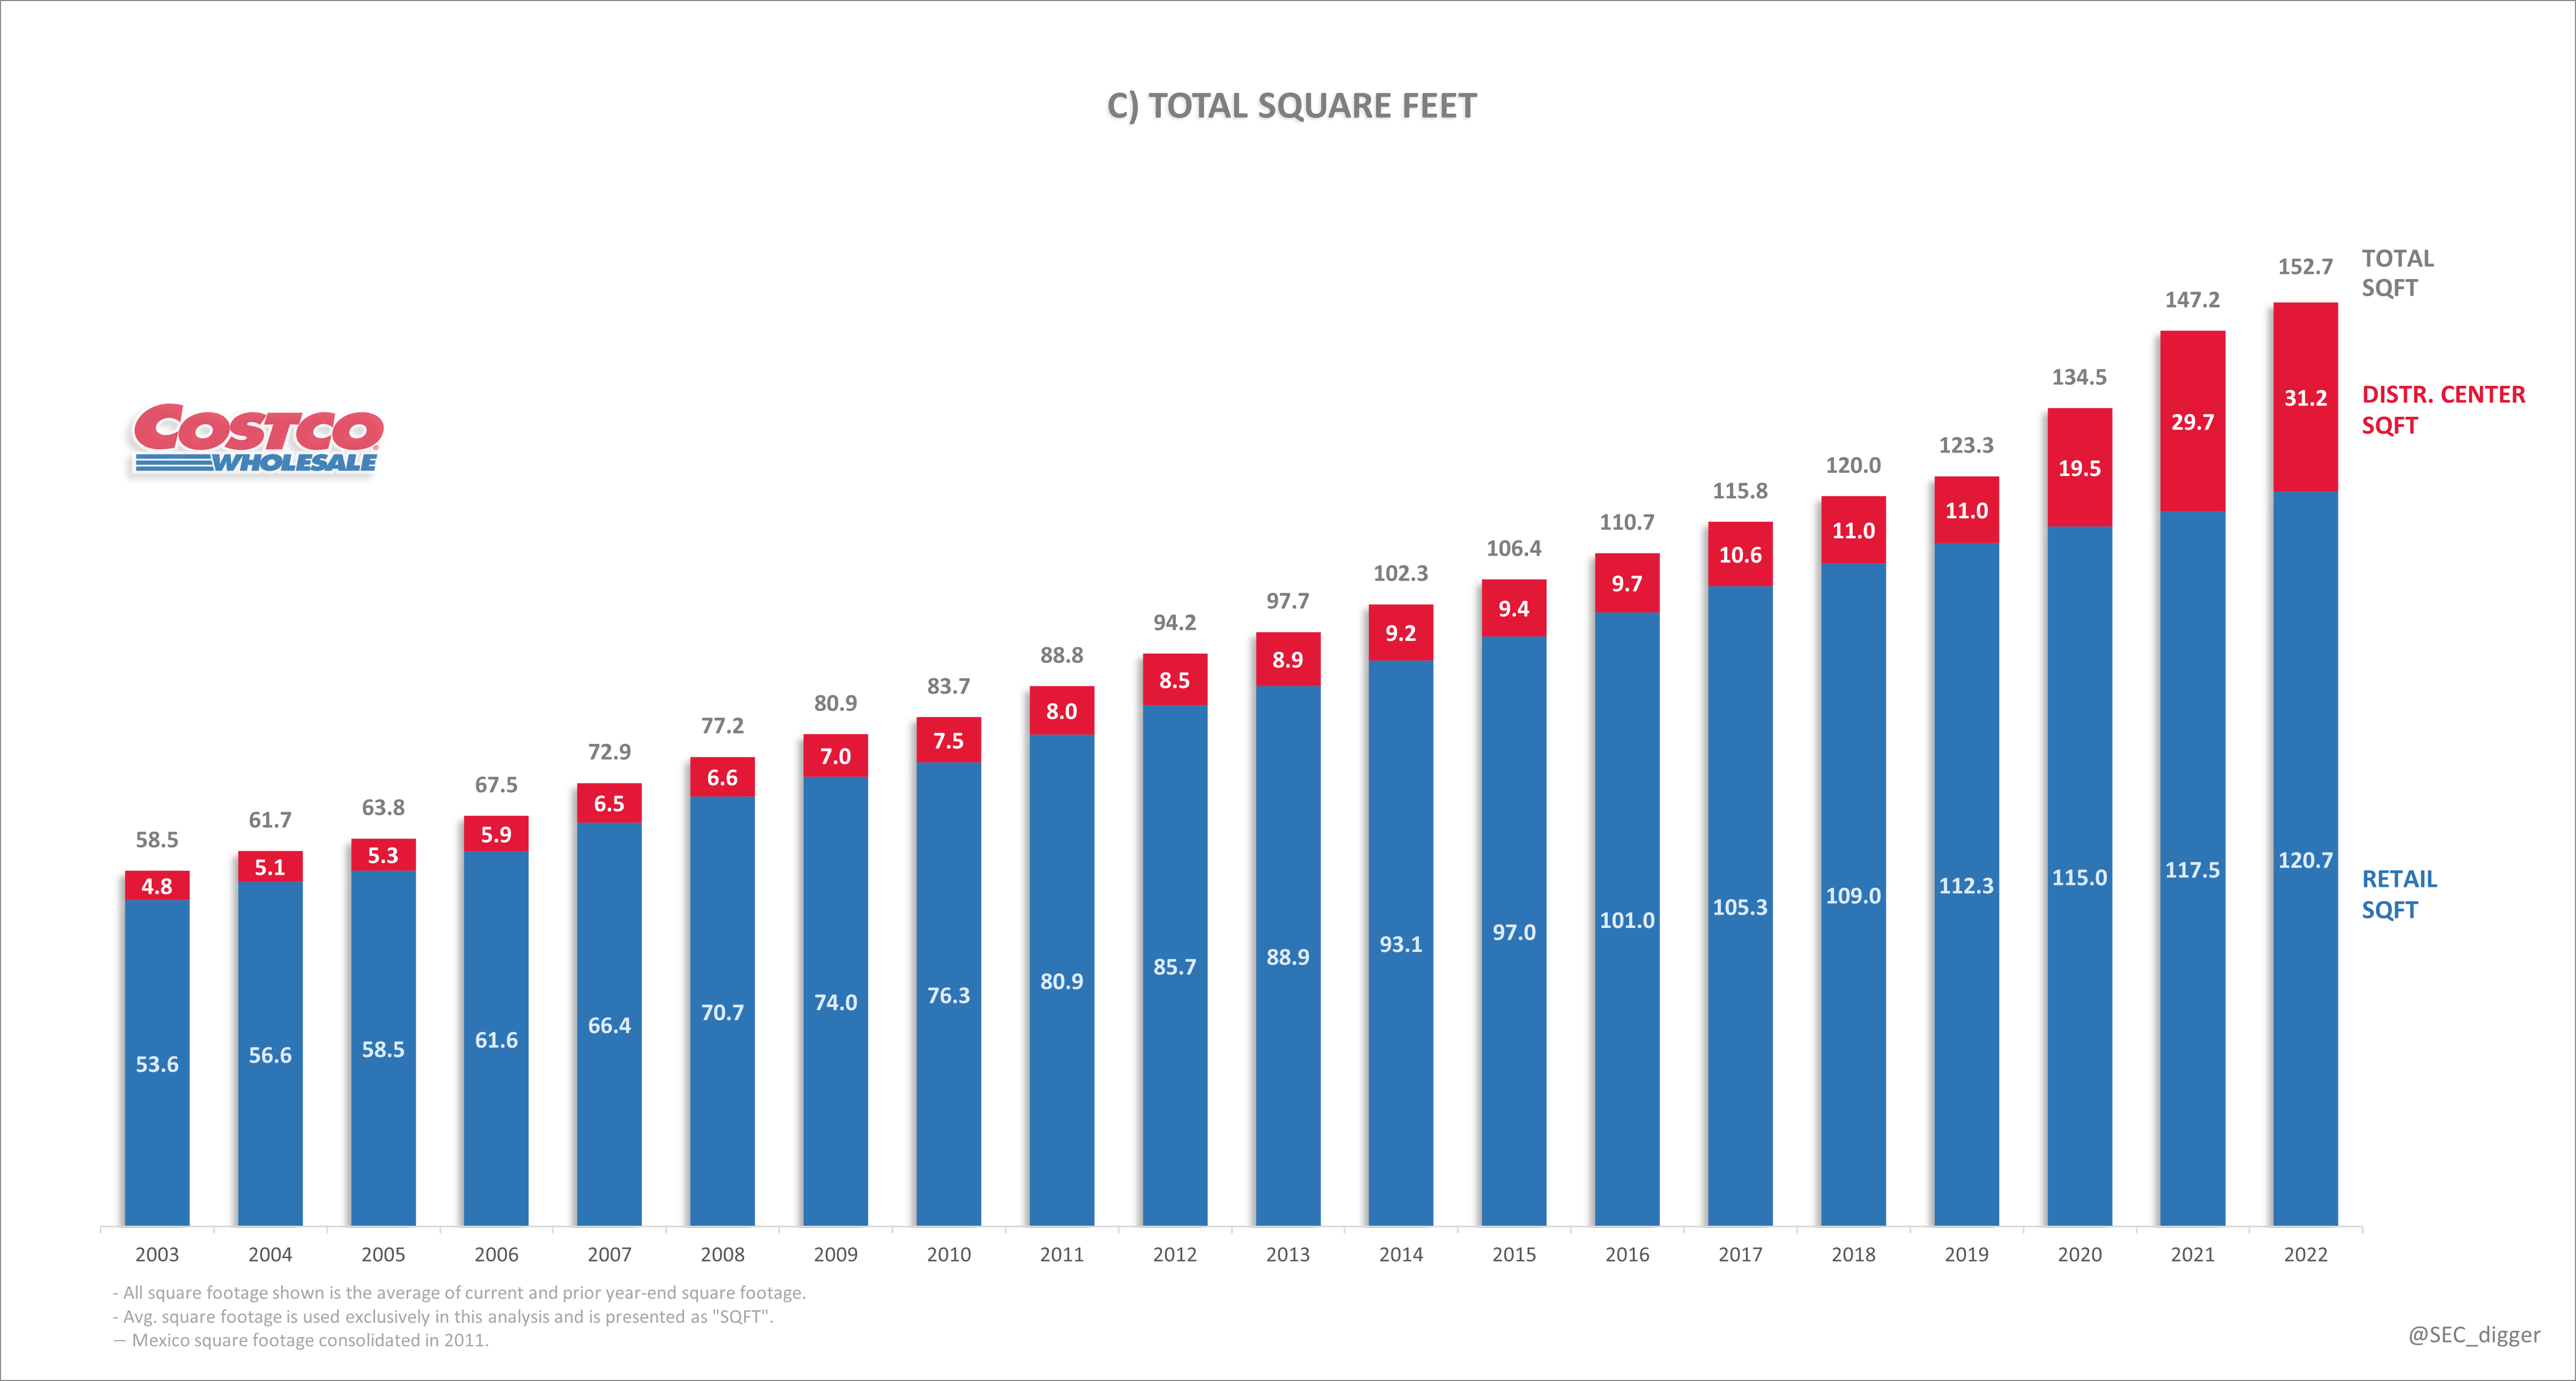
Gross Profit Dollars Per-Turn
In FY’ 22, Costco stocked $109 of inventory/sqft, marked it up 12.9%, and turned it – earning $14.02-per-turn….
Author Generated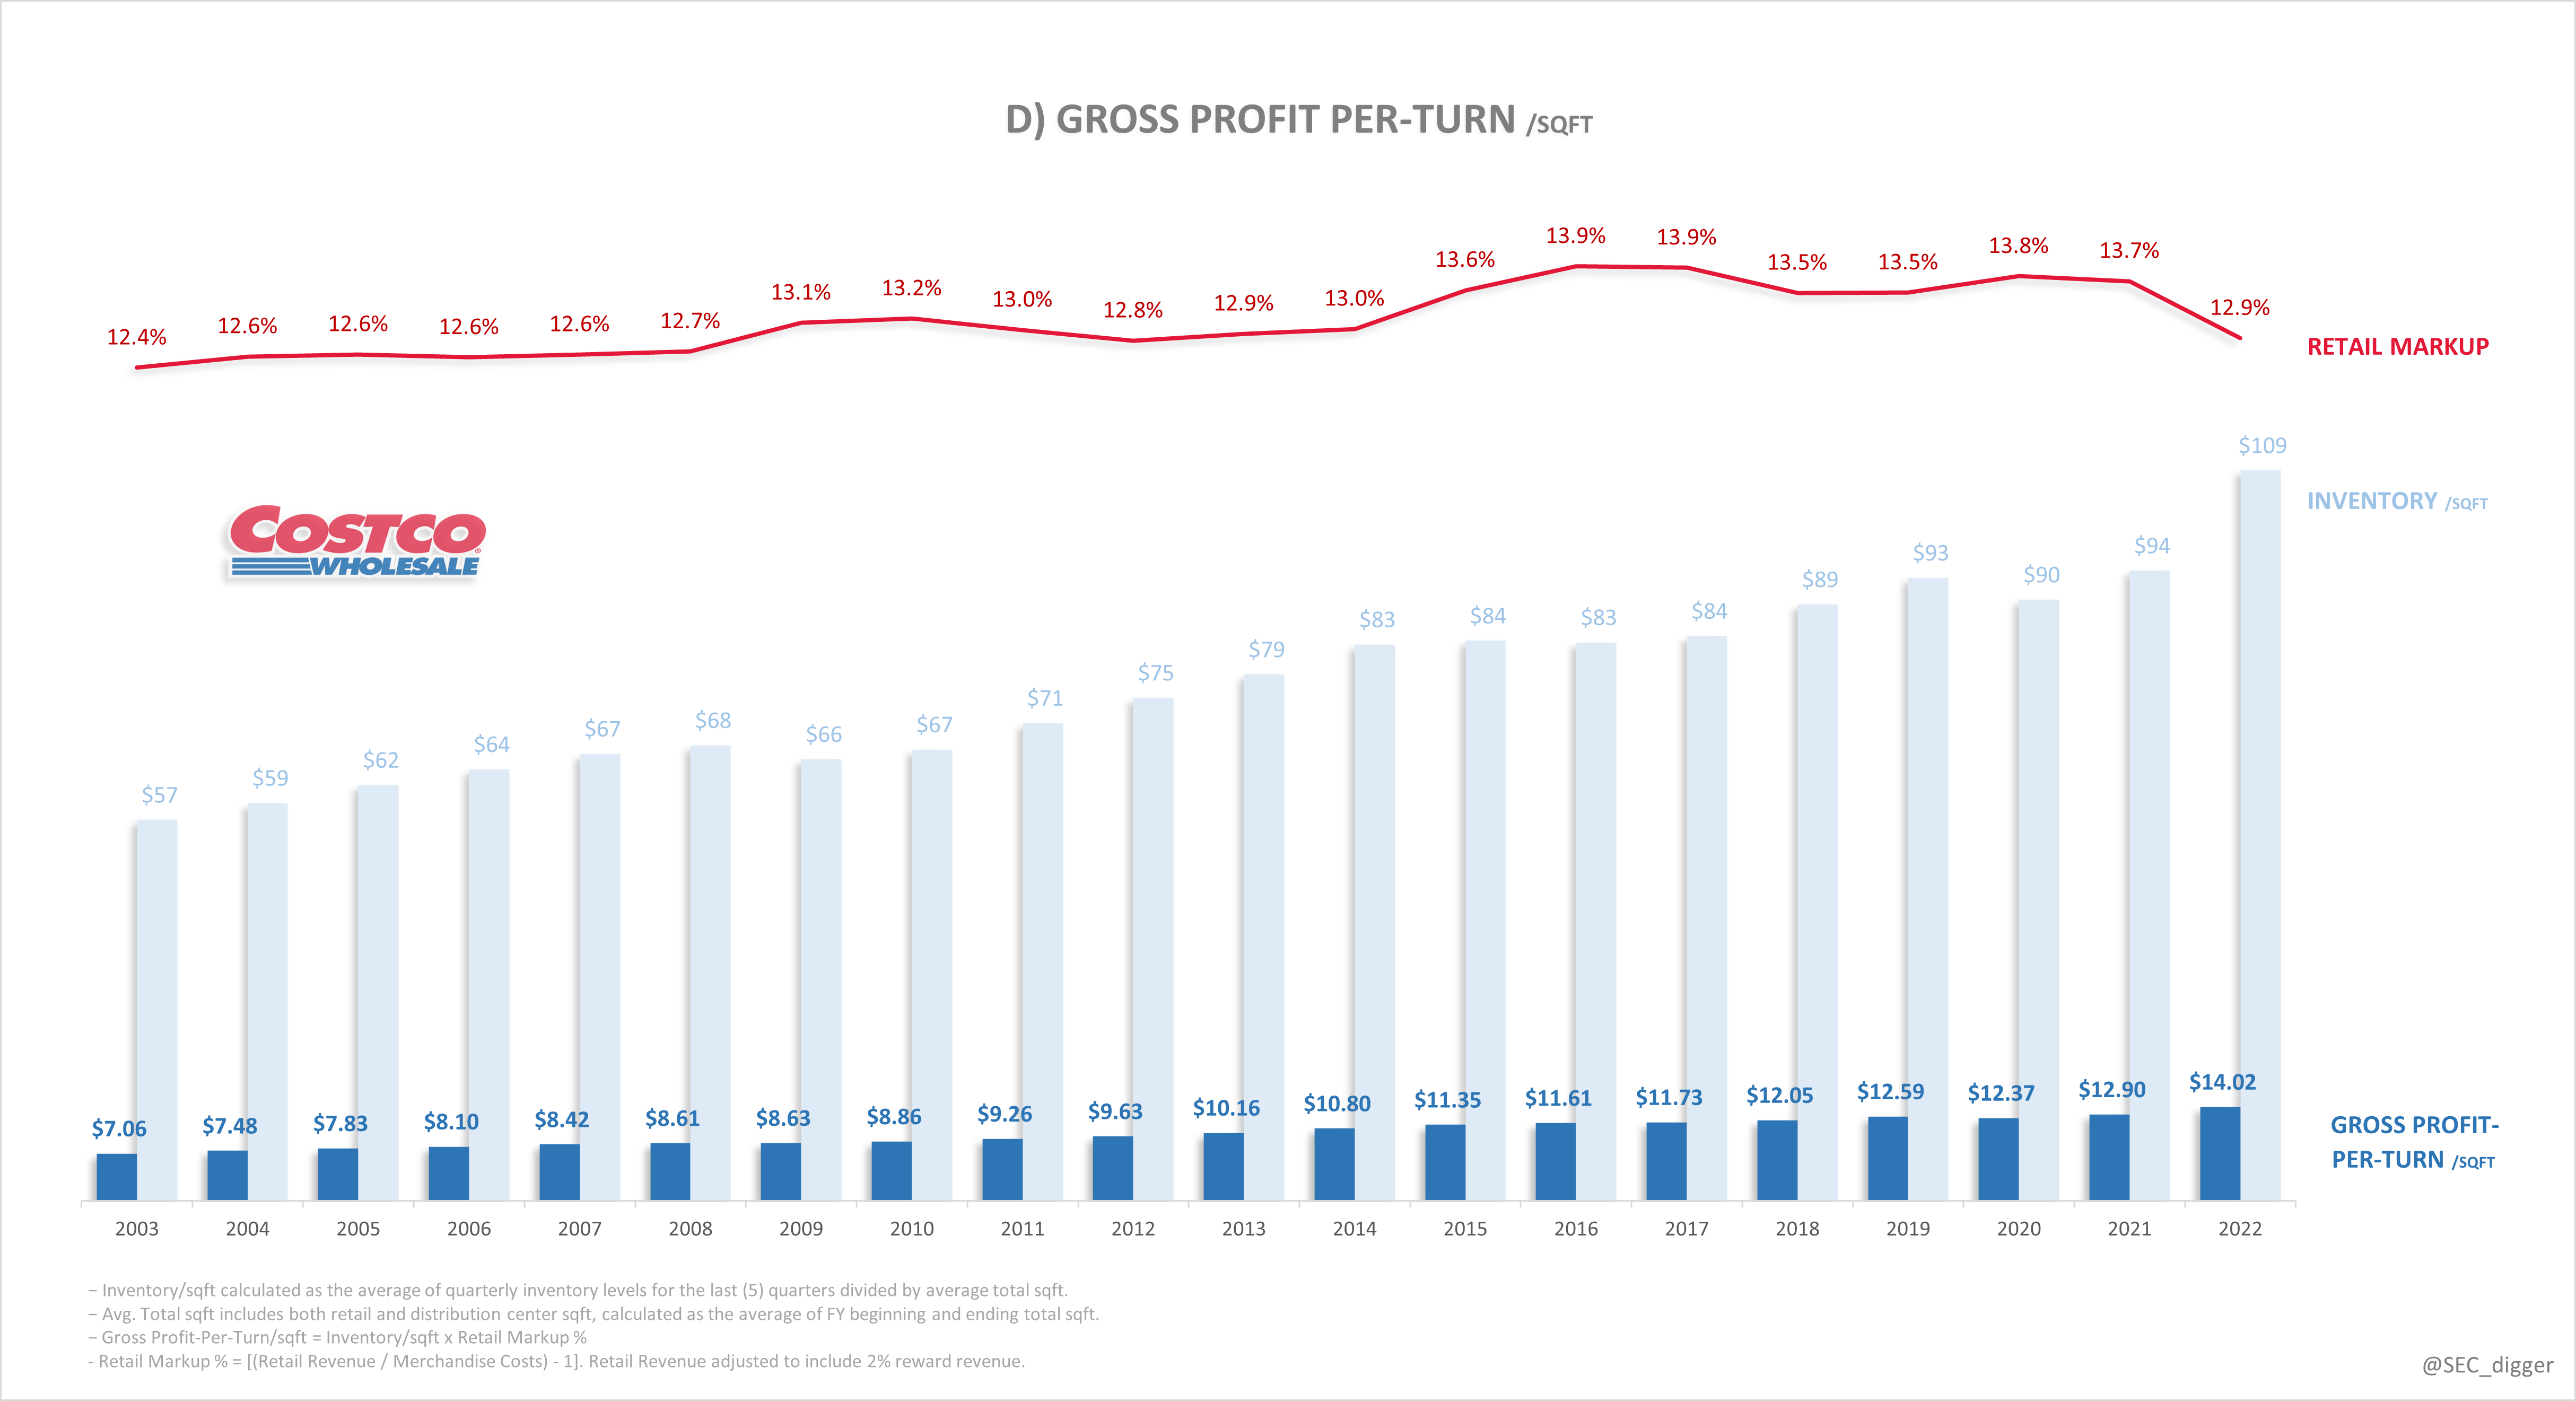
Note the stability and gradual increase of gross-profit-per-turn. The figures suggest that gross profit dollars, not rate, is management’s target metric for pricing decisions. As demonstrated in the upcoming charts, the growth in GM-dollars-per-turn over time has resulted in retail income growth, offset by increases in the 2% cashback expense generated by Executive spending.
Inventory Turns
The company turned inventory 12x this past year. 10.4 of those turns covered operating and interest expenses with gross margin dollars. The remaining 1.59 turns went to shareholders as pretax profit…
Author Generated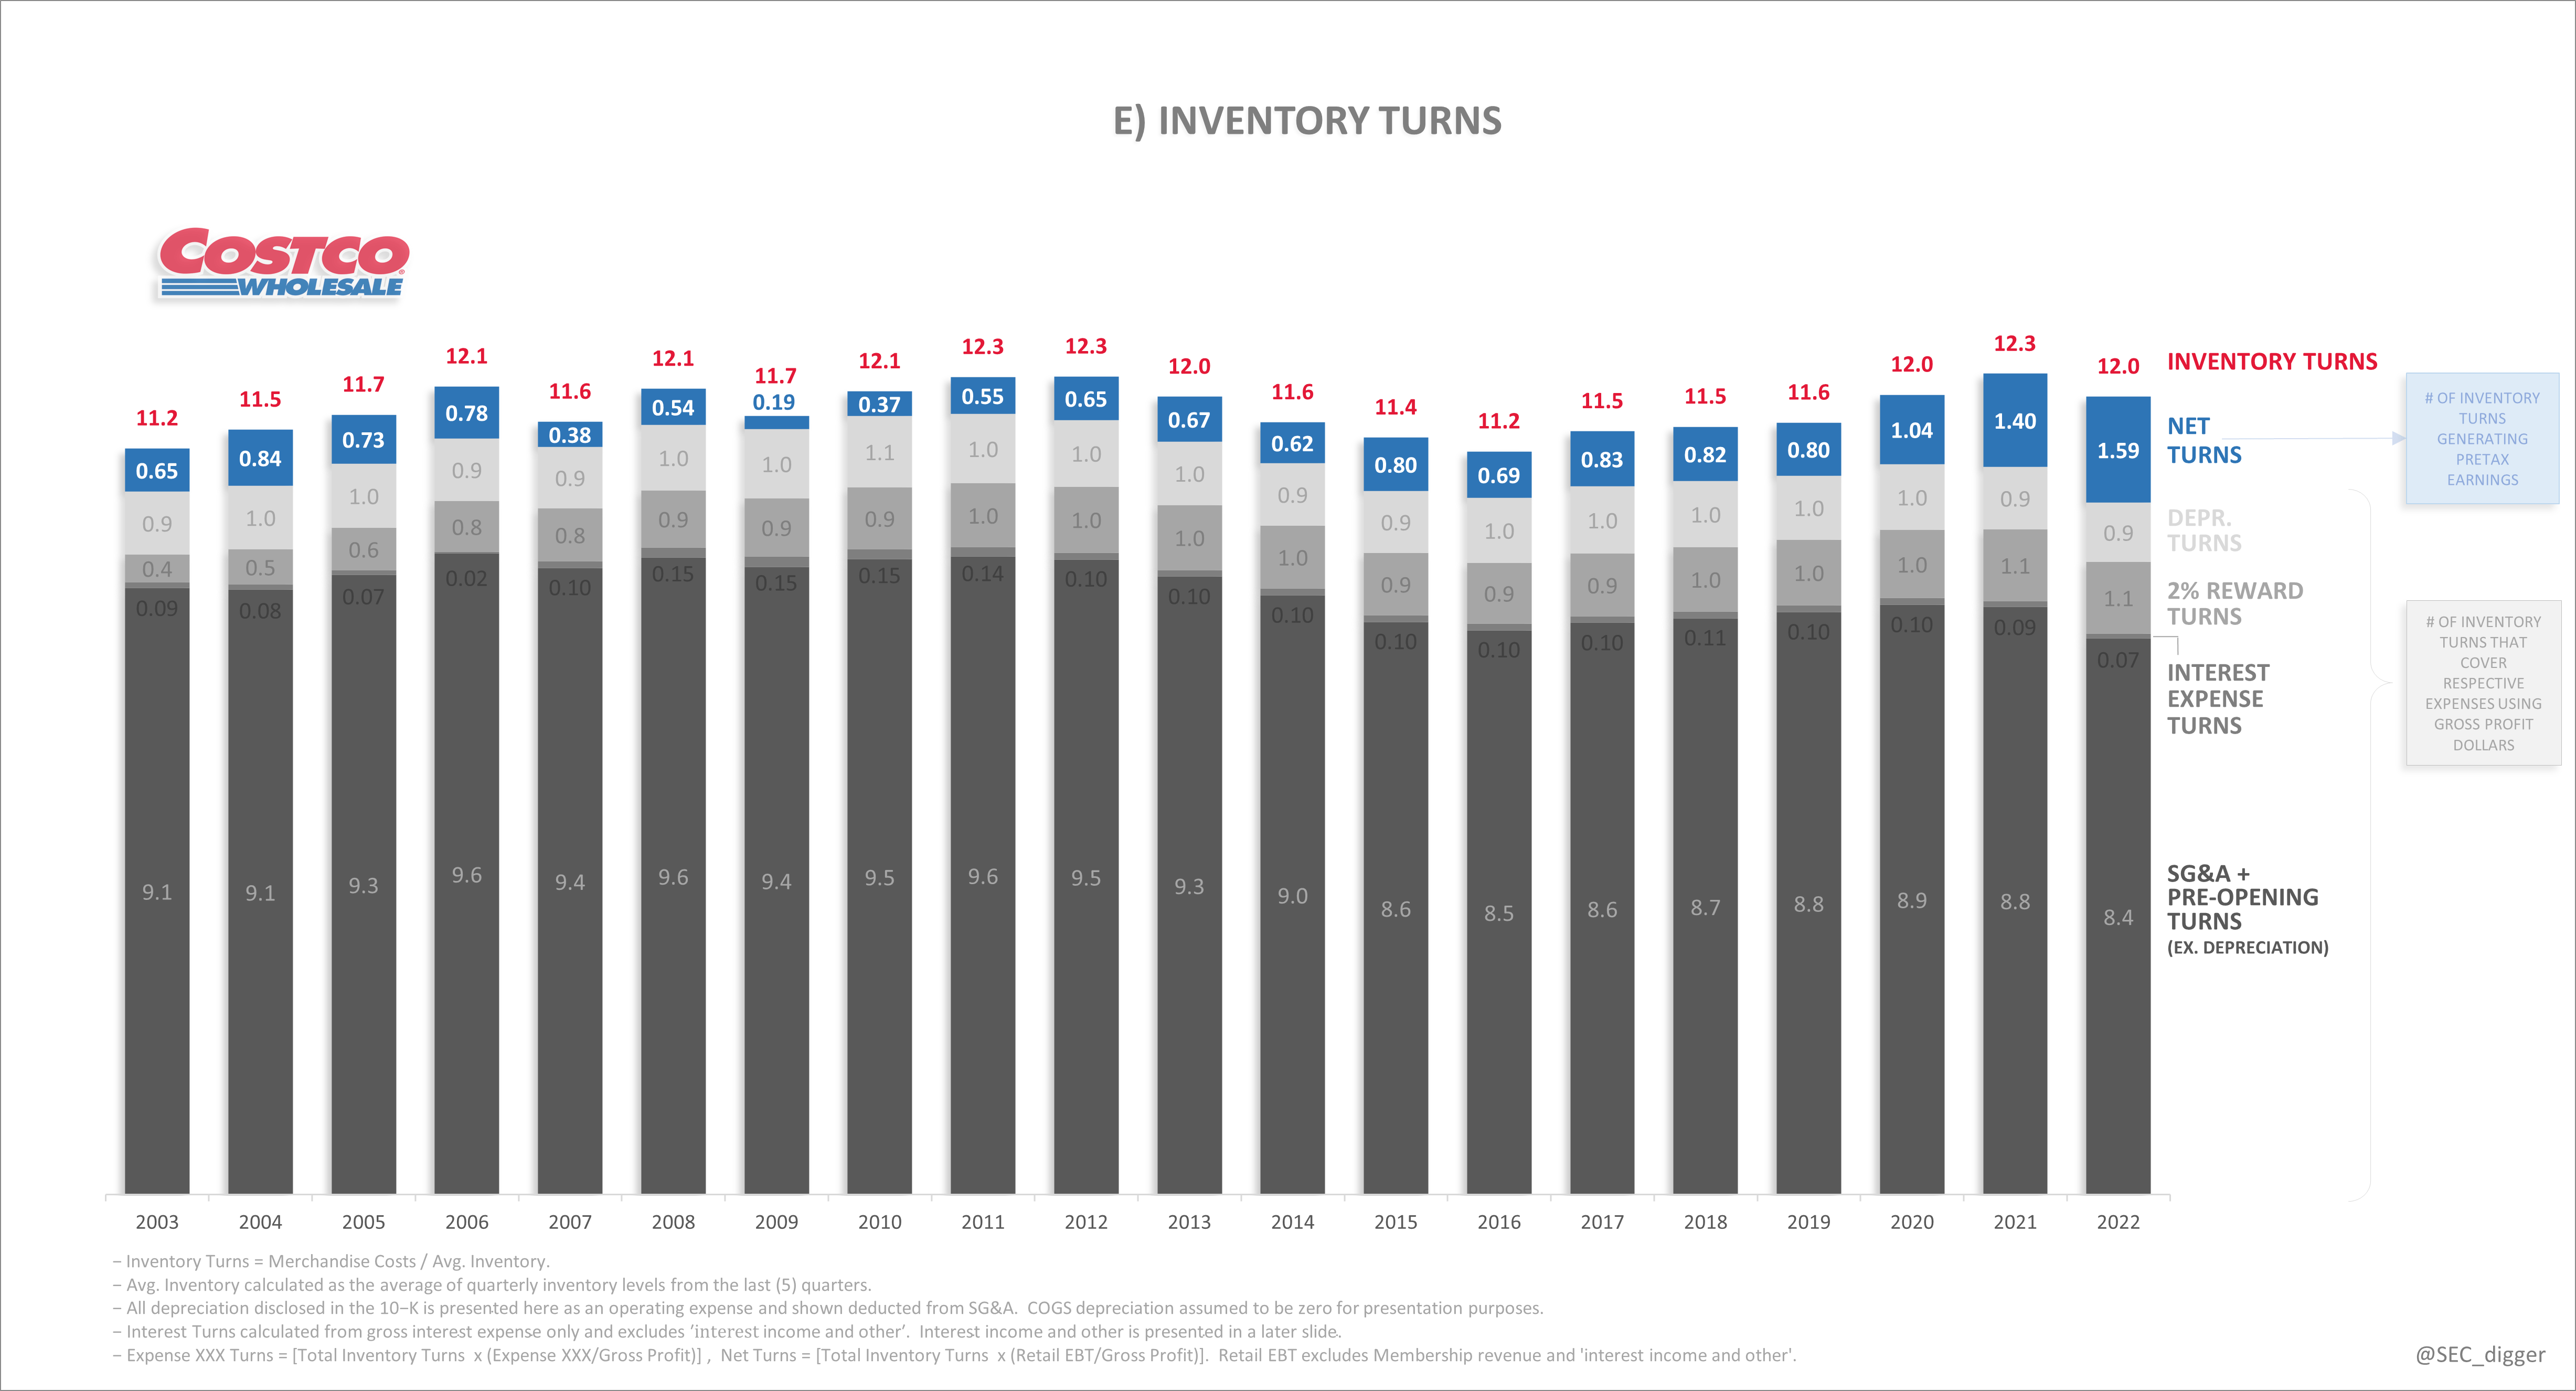
Inventory turns have remained relatively stable over the years at about 1/month. Interestingly, there seems to be no correlation between changes in markup rate and inventory turns. This suggests there may be some pricing headroom management is leaving on the table for strategic reasons.
Turnover this frequent also has the benefit of improving the cash conversation cycle, helping to leverage ROE and ROIC. If Costco can sell products faster than they have to pay suppliers, the suppliers effectively become a source of free capital. In effect, suppliers end up financing part of the company’s expansion. This benefit has been increasing over the years as inventory levels have grown relative to equity. This, along with its growing pool of differed membership fees, can be viewed as a type of ‘float’.
Pretax Retail Earnings
Since shareholders kept 1.59 turns @ $14.02 per-turn (per-sqft) in 2022, they earned $22.3/sqft pretax. Over time, growth in gross margin $’s has outpaced the rise in operating expenses and the 2% cashback drag from Executive cardholder adoption discussed above.
Author Generated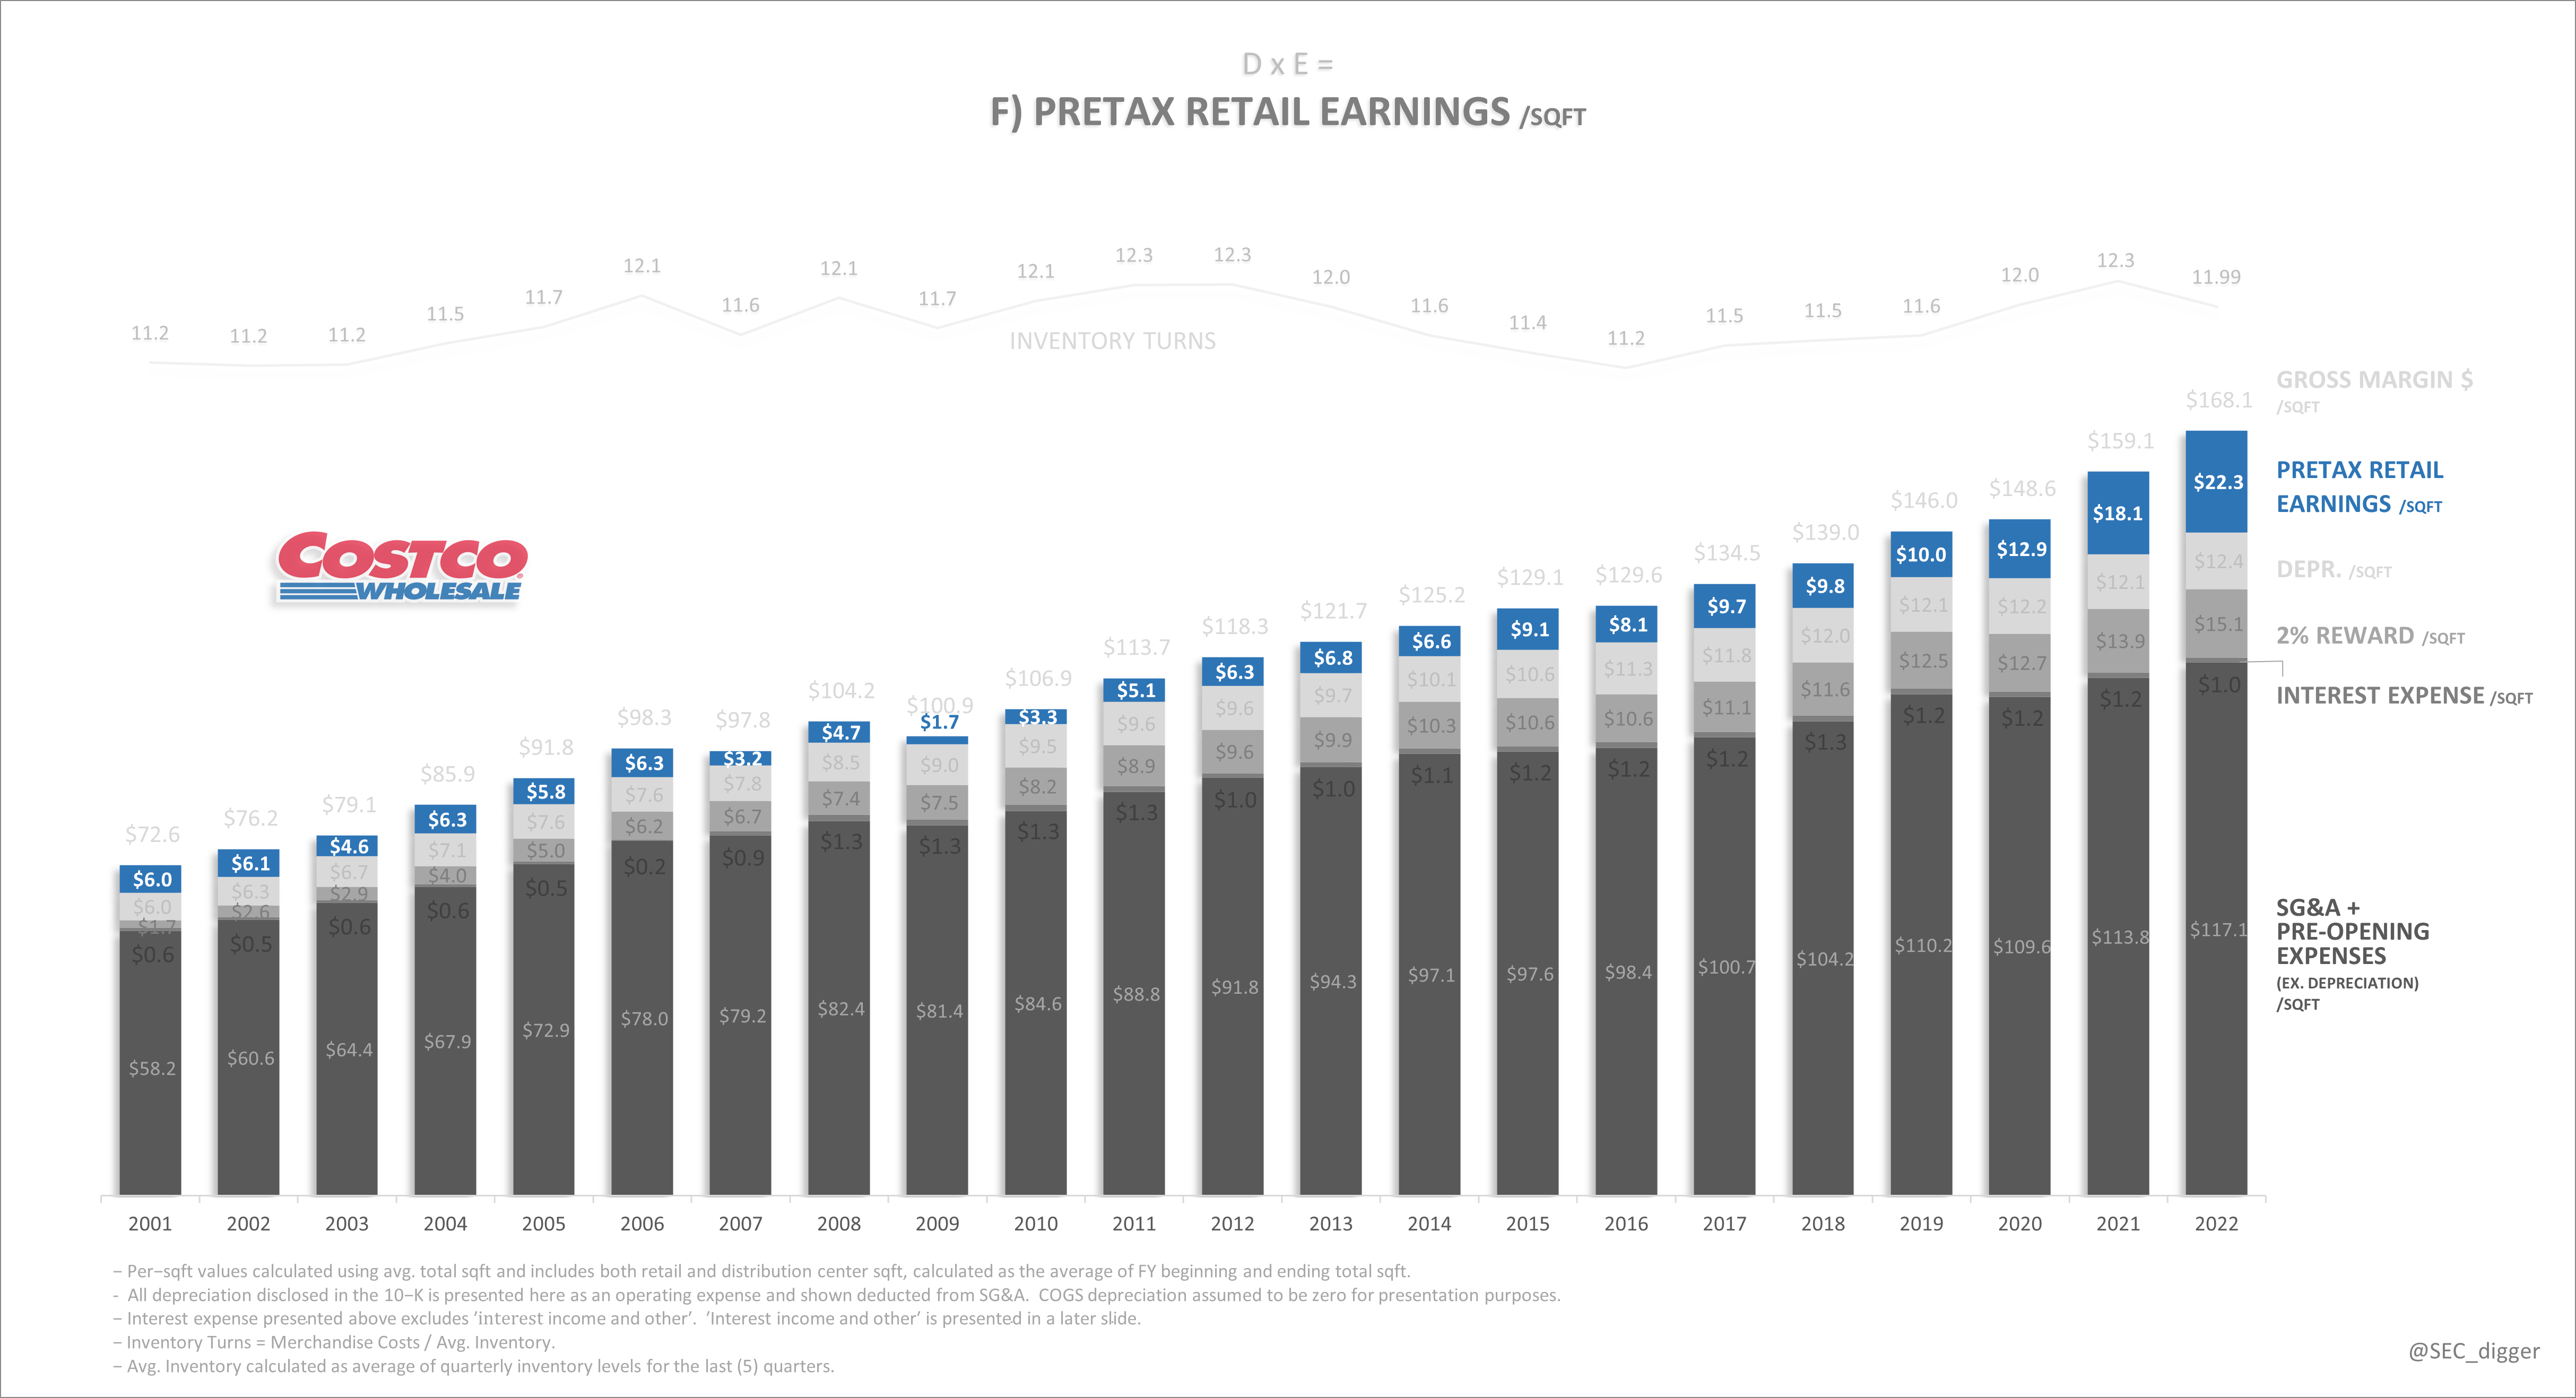
Total Pretax Earnings
Adding membership fees and interest income to retail income yields the below…
Author Generated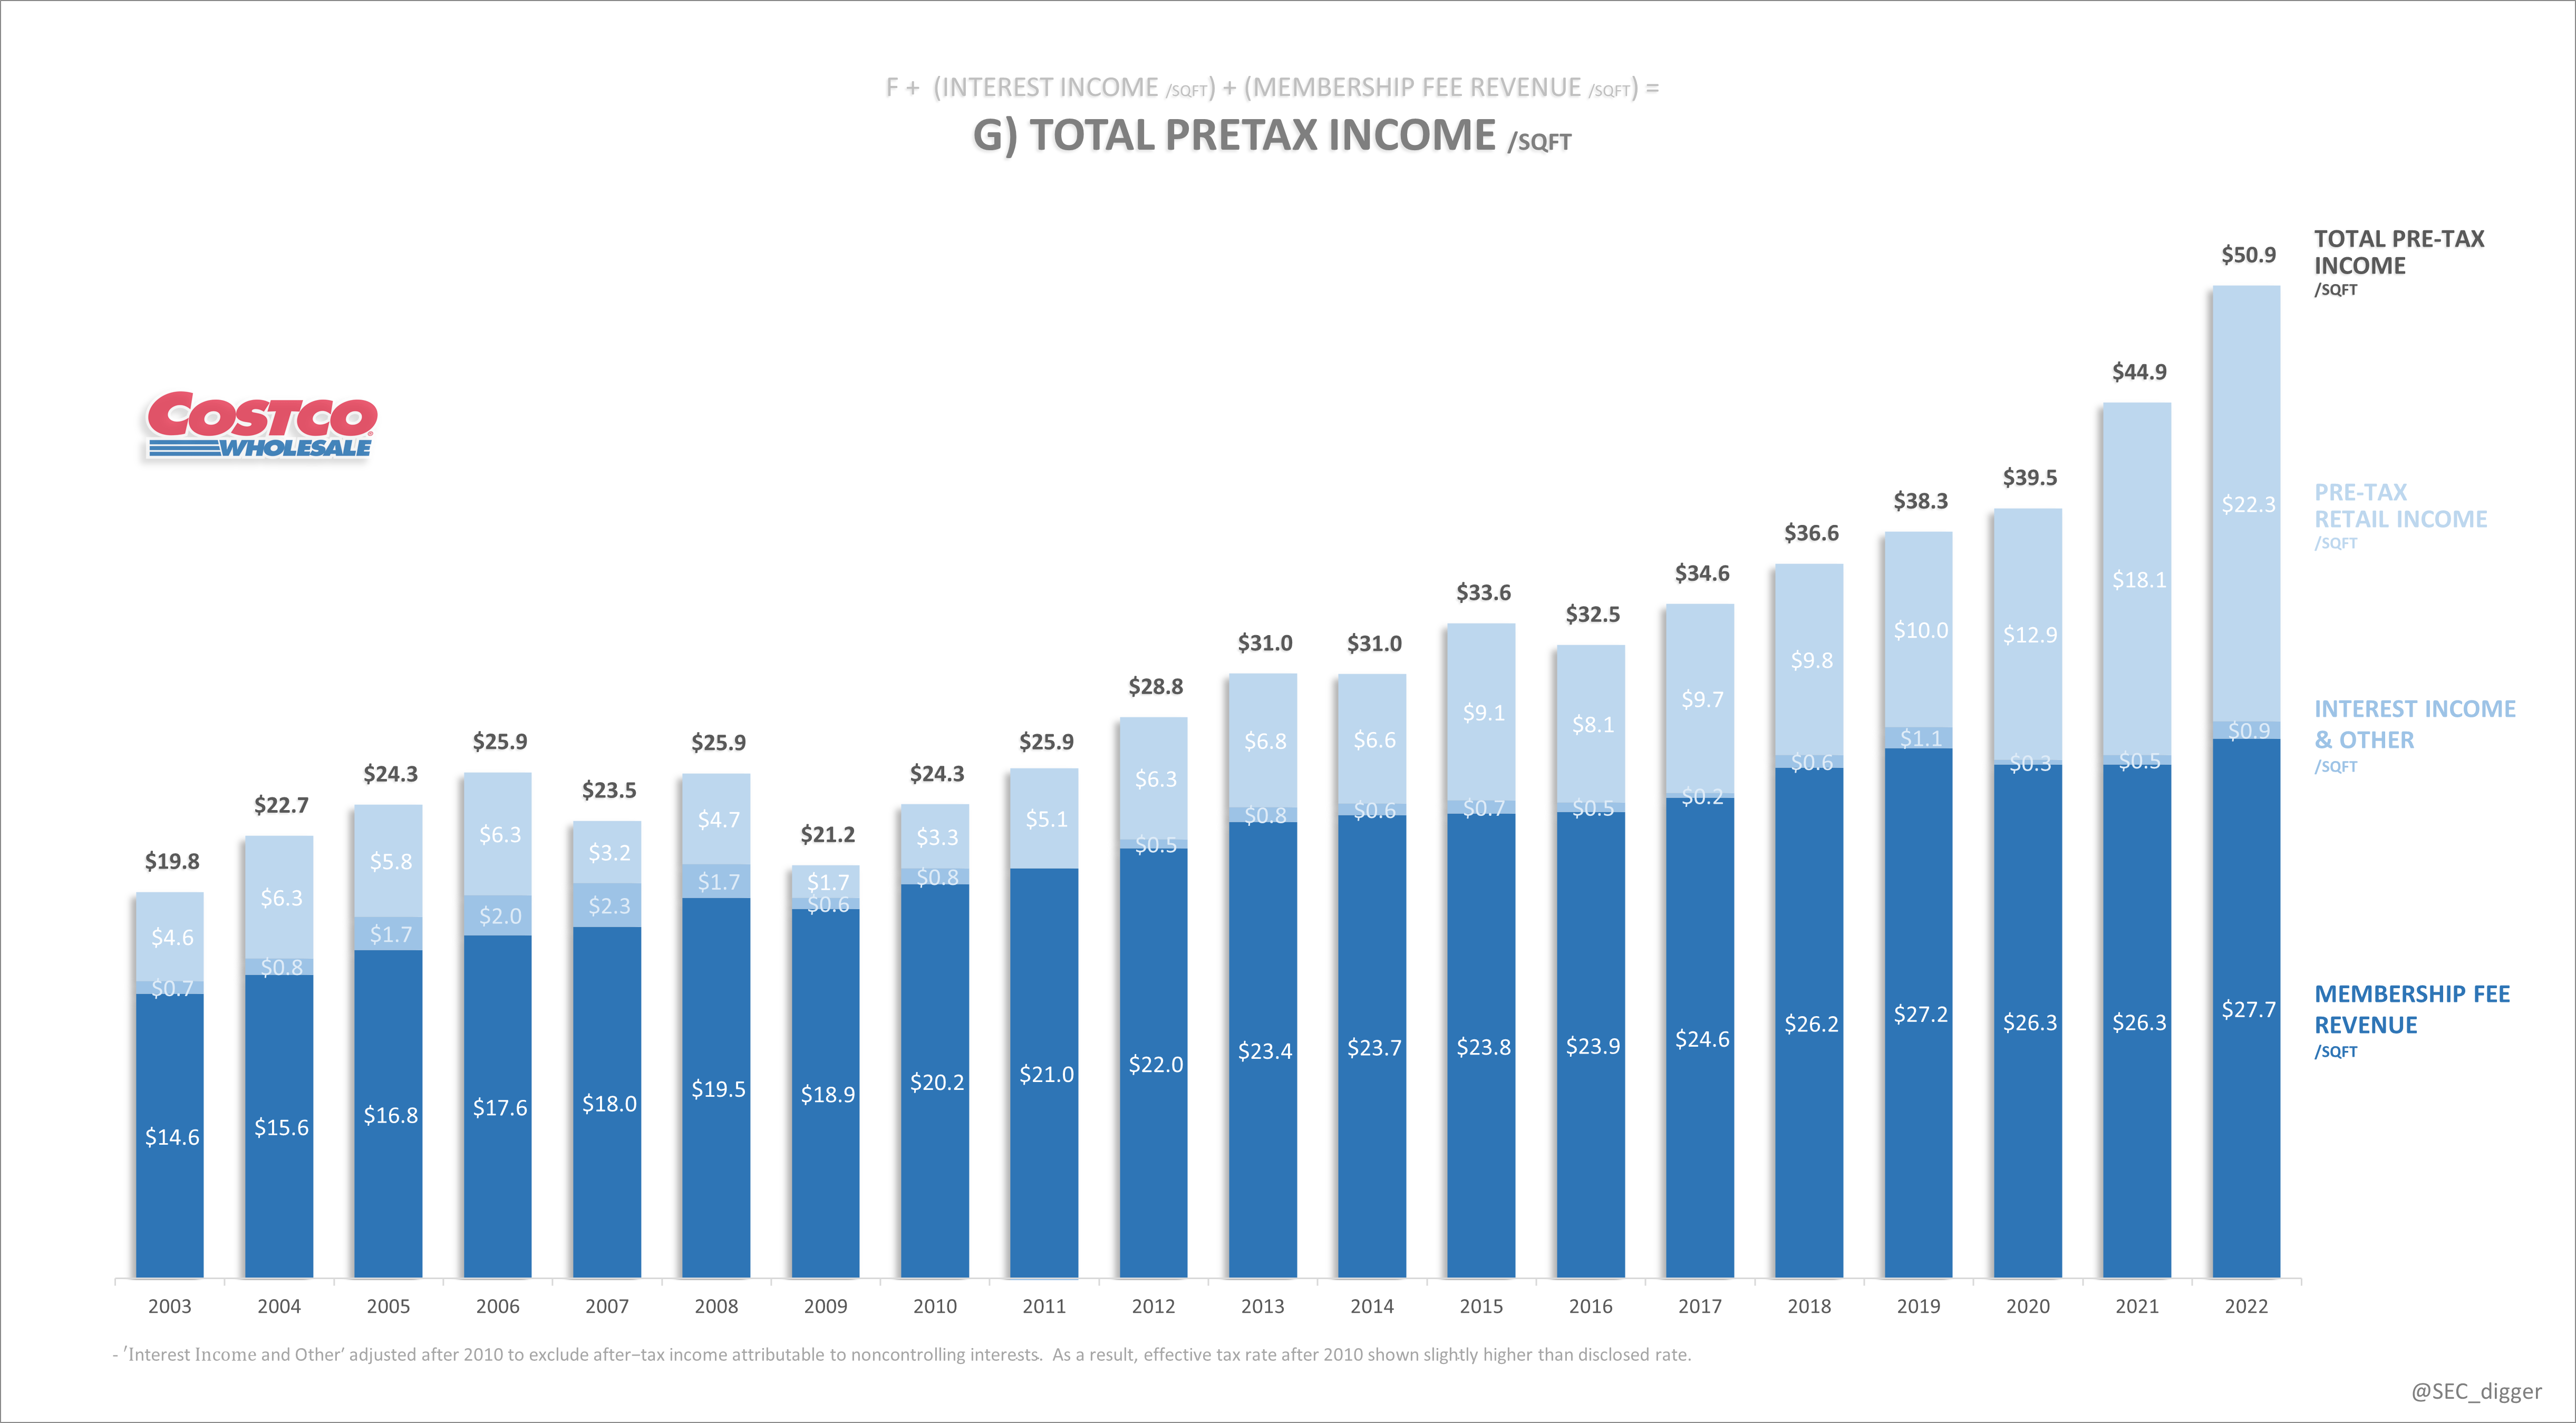
Membership fee revenue is both stable and predictable in the short term (A quick regression analysis shows that FYE fee revenue is highly correlated with the prior year’s deferral account). The membership model has the added benefit of decreasing the company’s degree of operating leverage.
Chart G shows fee revenue/sqft increasing steadily over time, but decreasing as a percentage of total income. The current split between retail income and fee revenue is now almost 1:1. Given the excellent retail performance in the past few years, the company can drag their feet raising membership fees and the shareholders will still do fine. As mentioned above, avoiding the urge to squeeze every last dollar out of their customers in the short term is only reinforcing the company’s longer-term reputation.
Net Income
Adjusting chart G for taxes yields net income…
Author Generated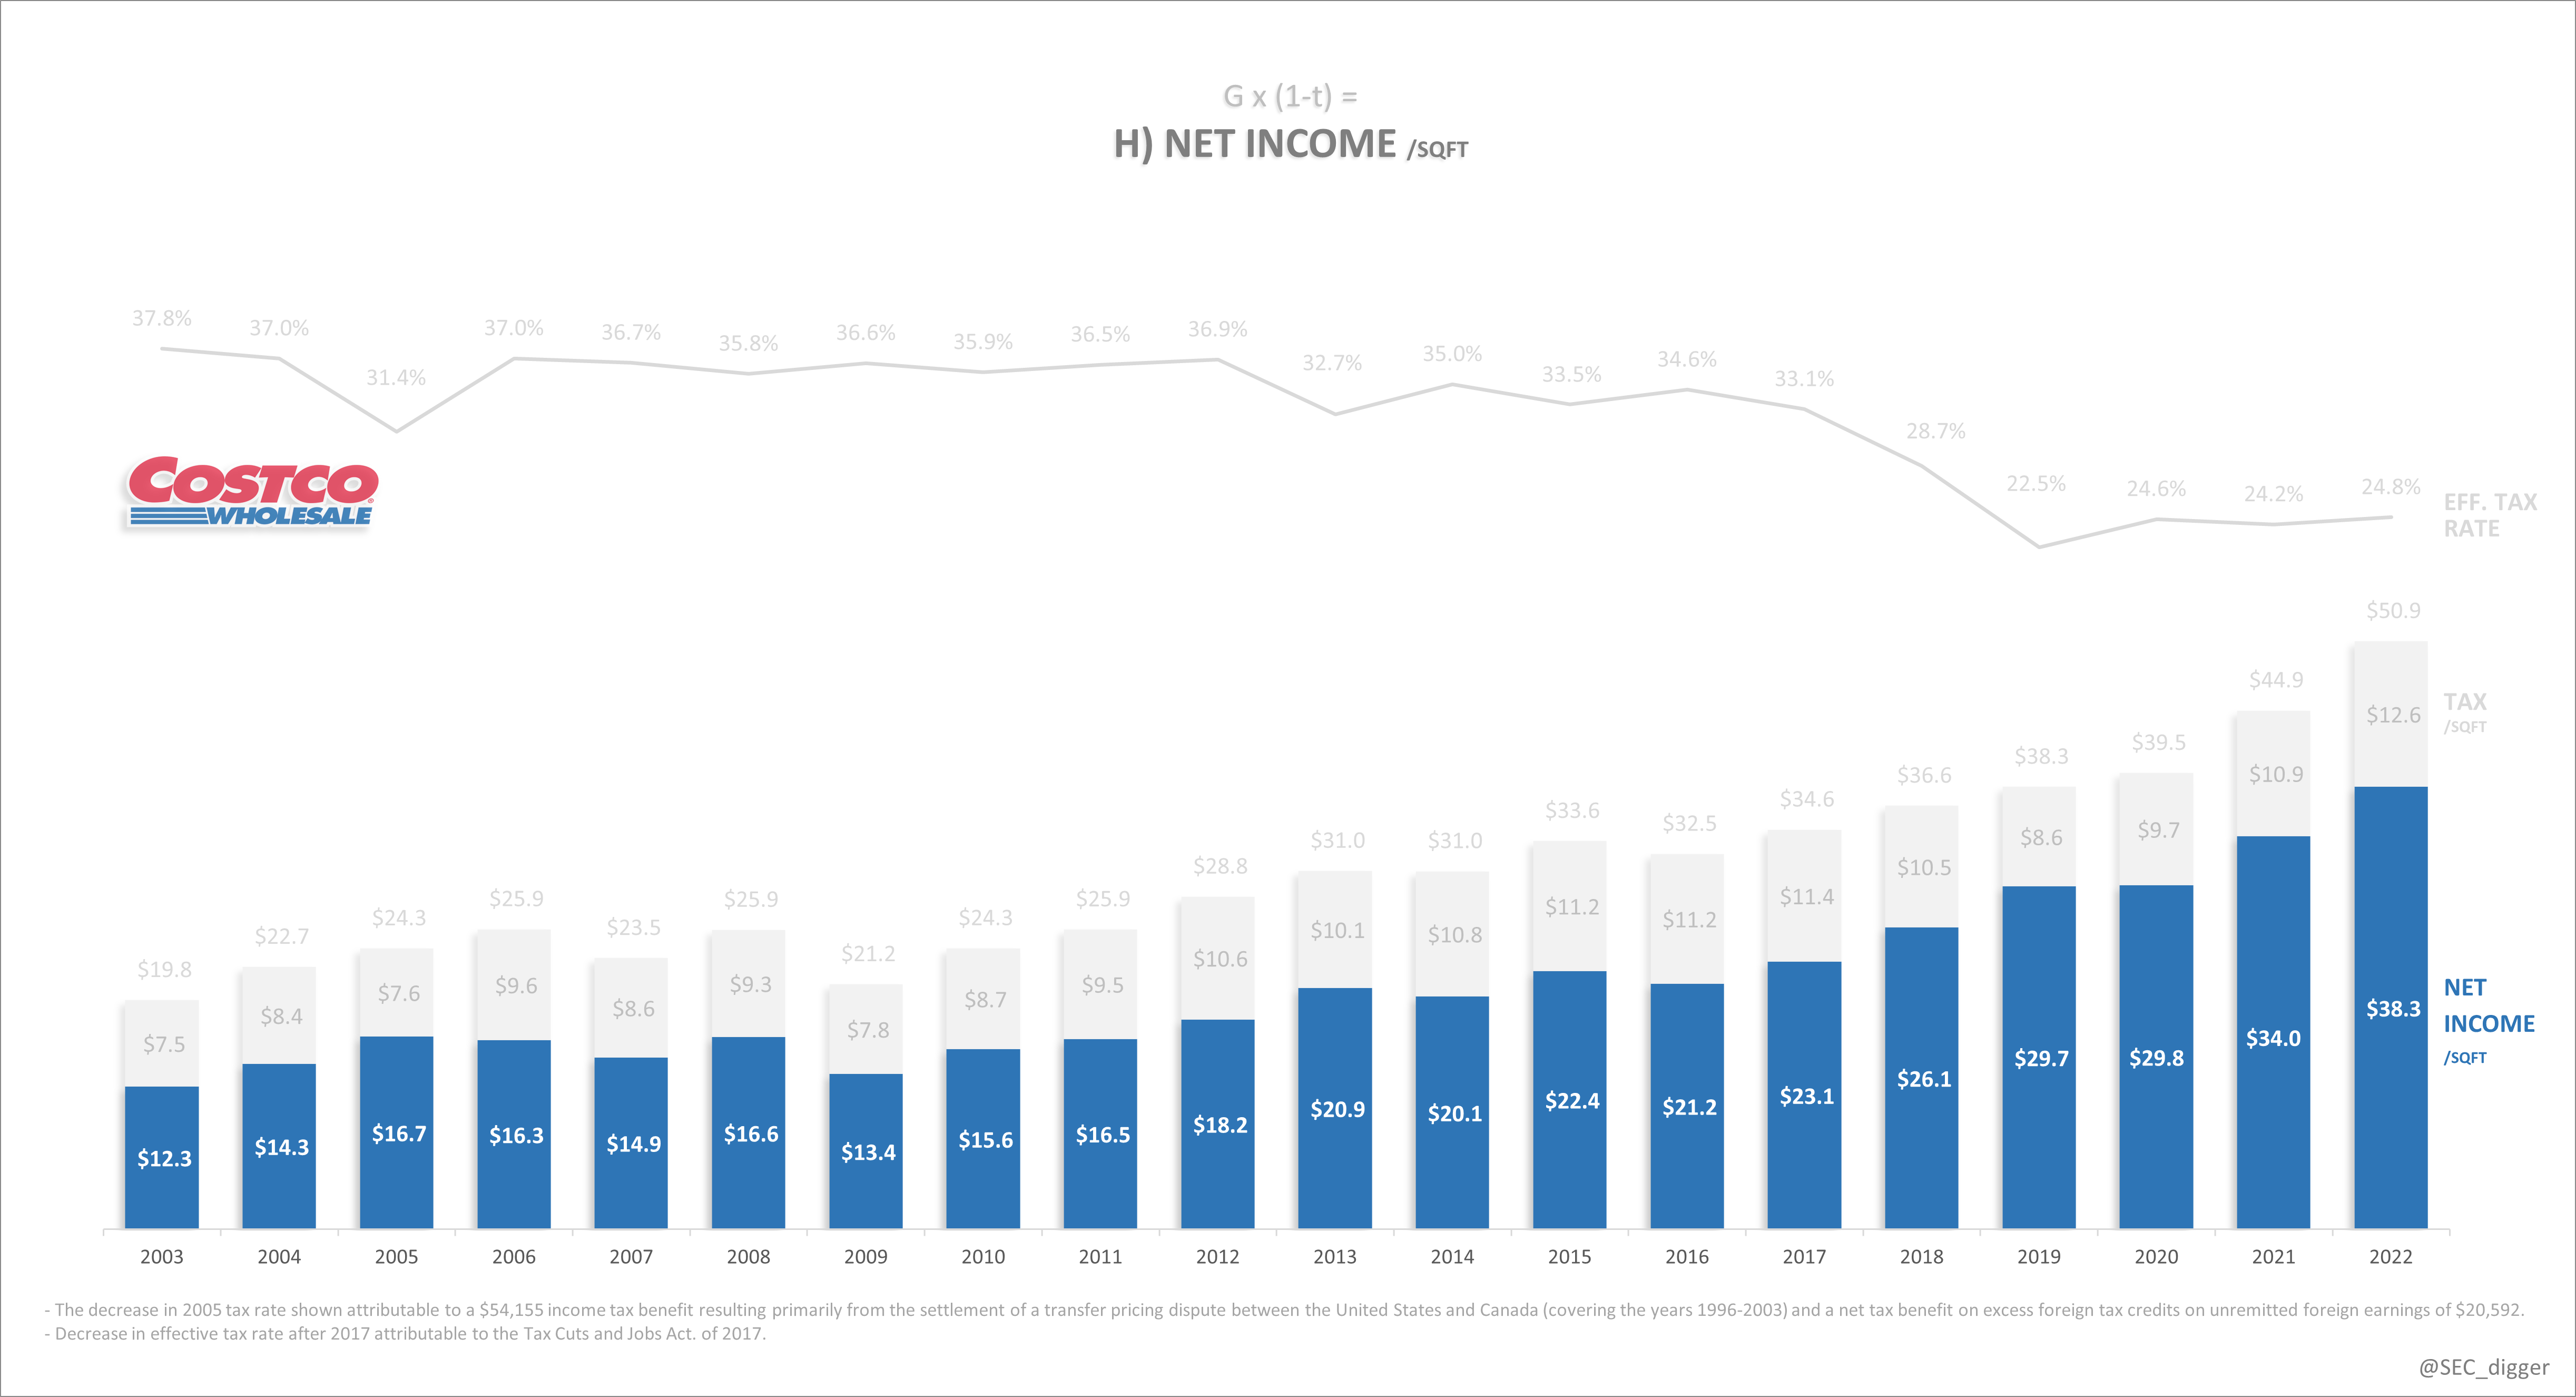
Square Foot-Per-Share
We get from net income/sqft to EPS using the conversion factor below. It shows the portion of 1 square foot that could be bought with 1 share of stock.
An increase in footprint and/or buybacks will be a tailwind for sqft/share (and thus EPS)…
Author Generated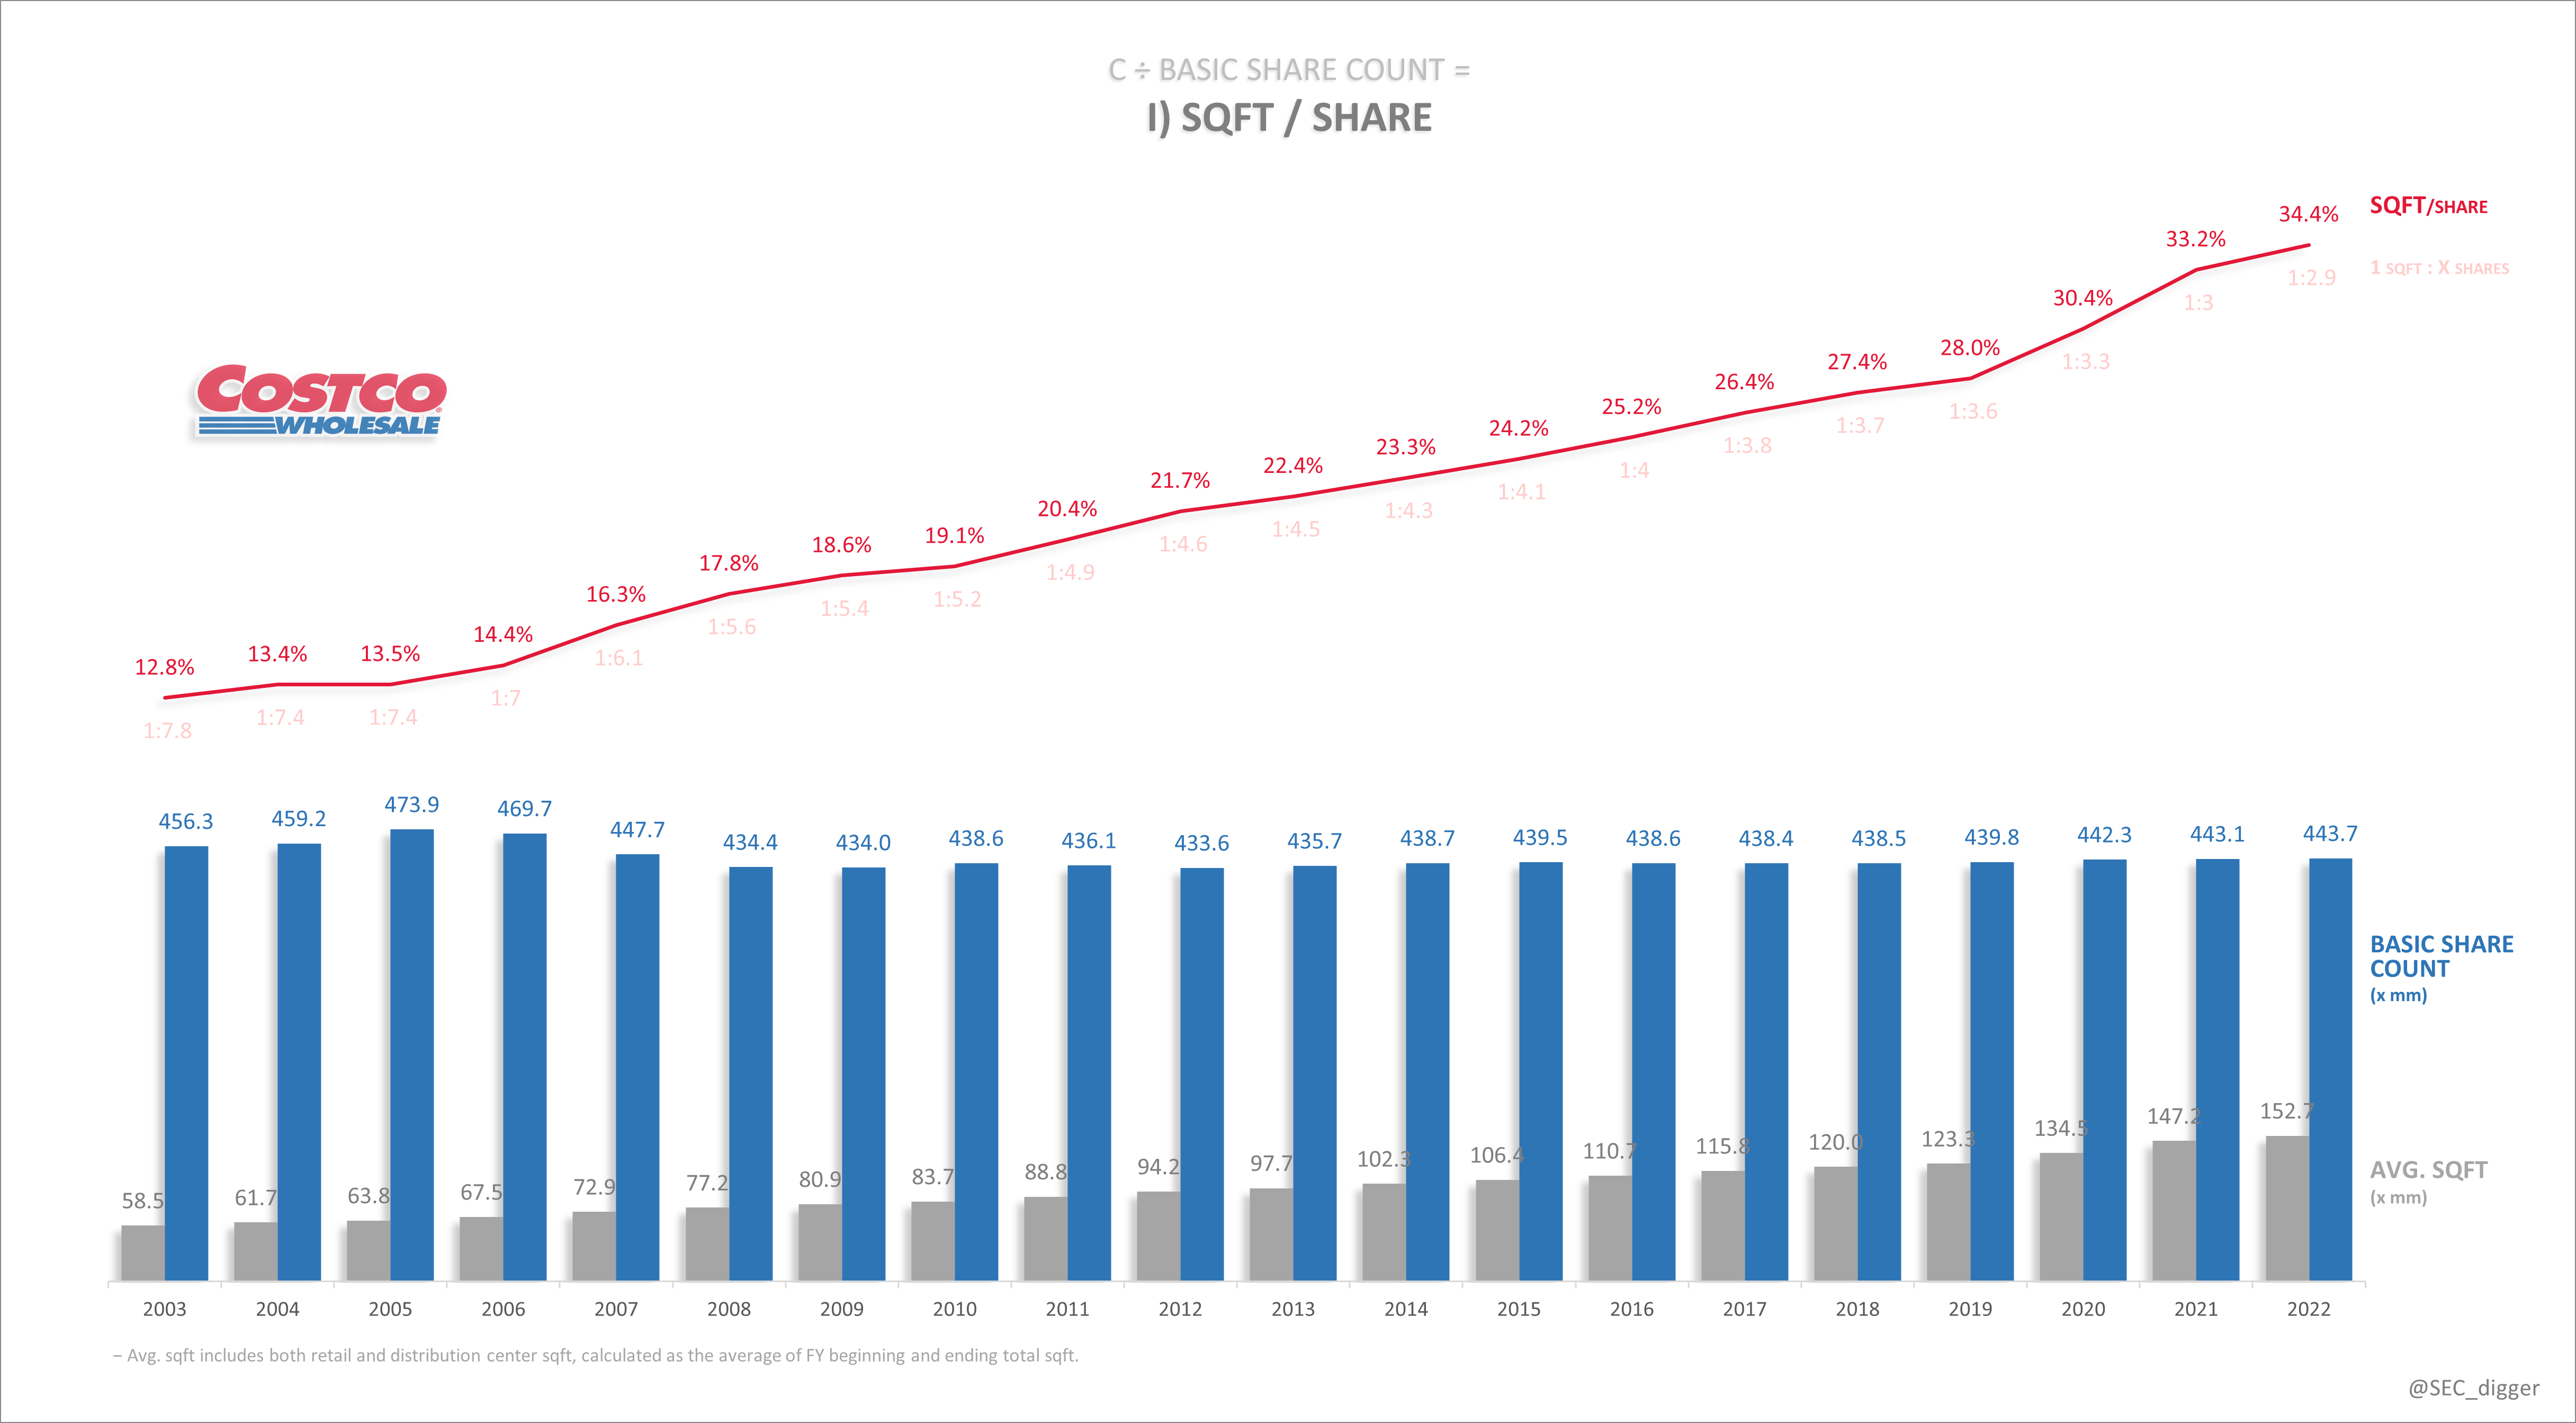
EPS
For B&M retailers like Costco, EPS changes can be viewed as a composite of changes in sqft economics, retail footprint and share count. The company is conservative with buybacks, so most of the EPS growth has come from improving unit economics and footprint growth…
Author Generated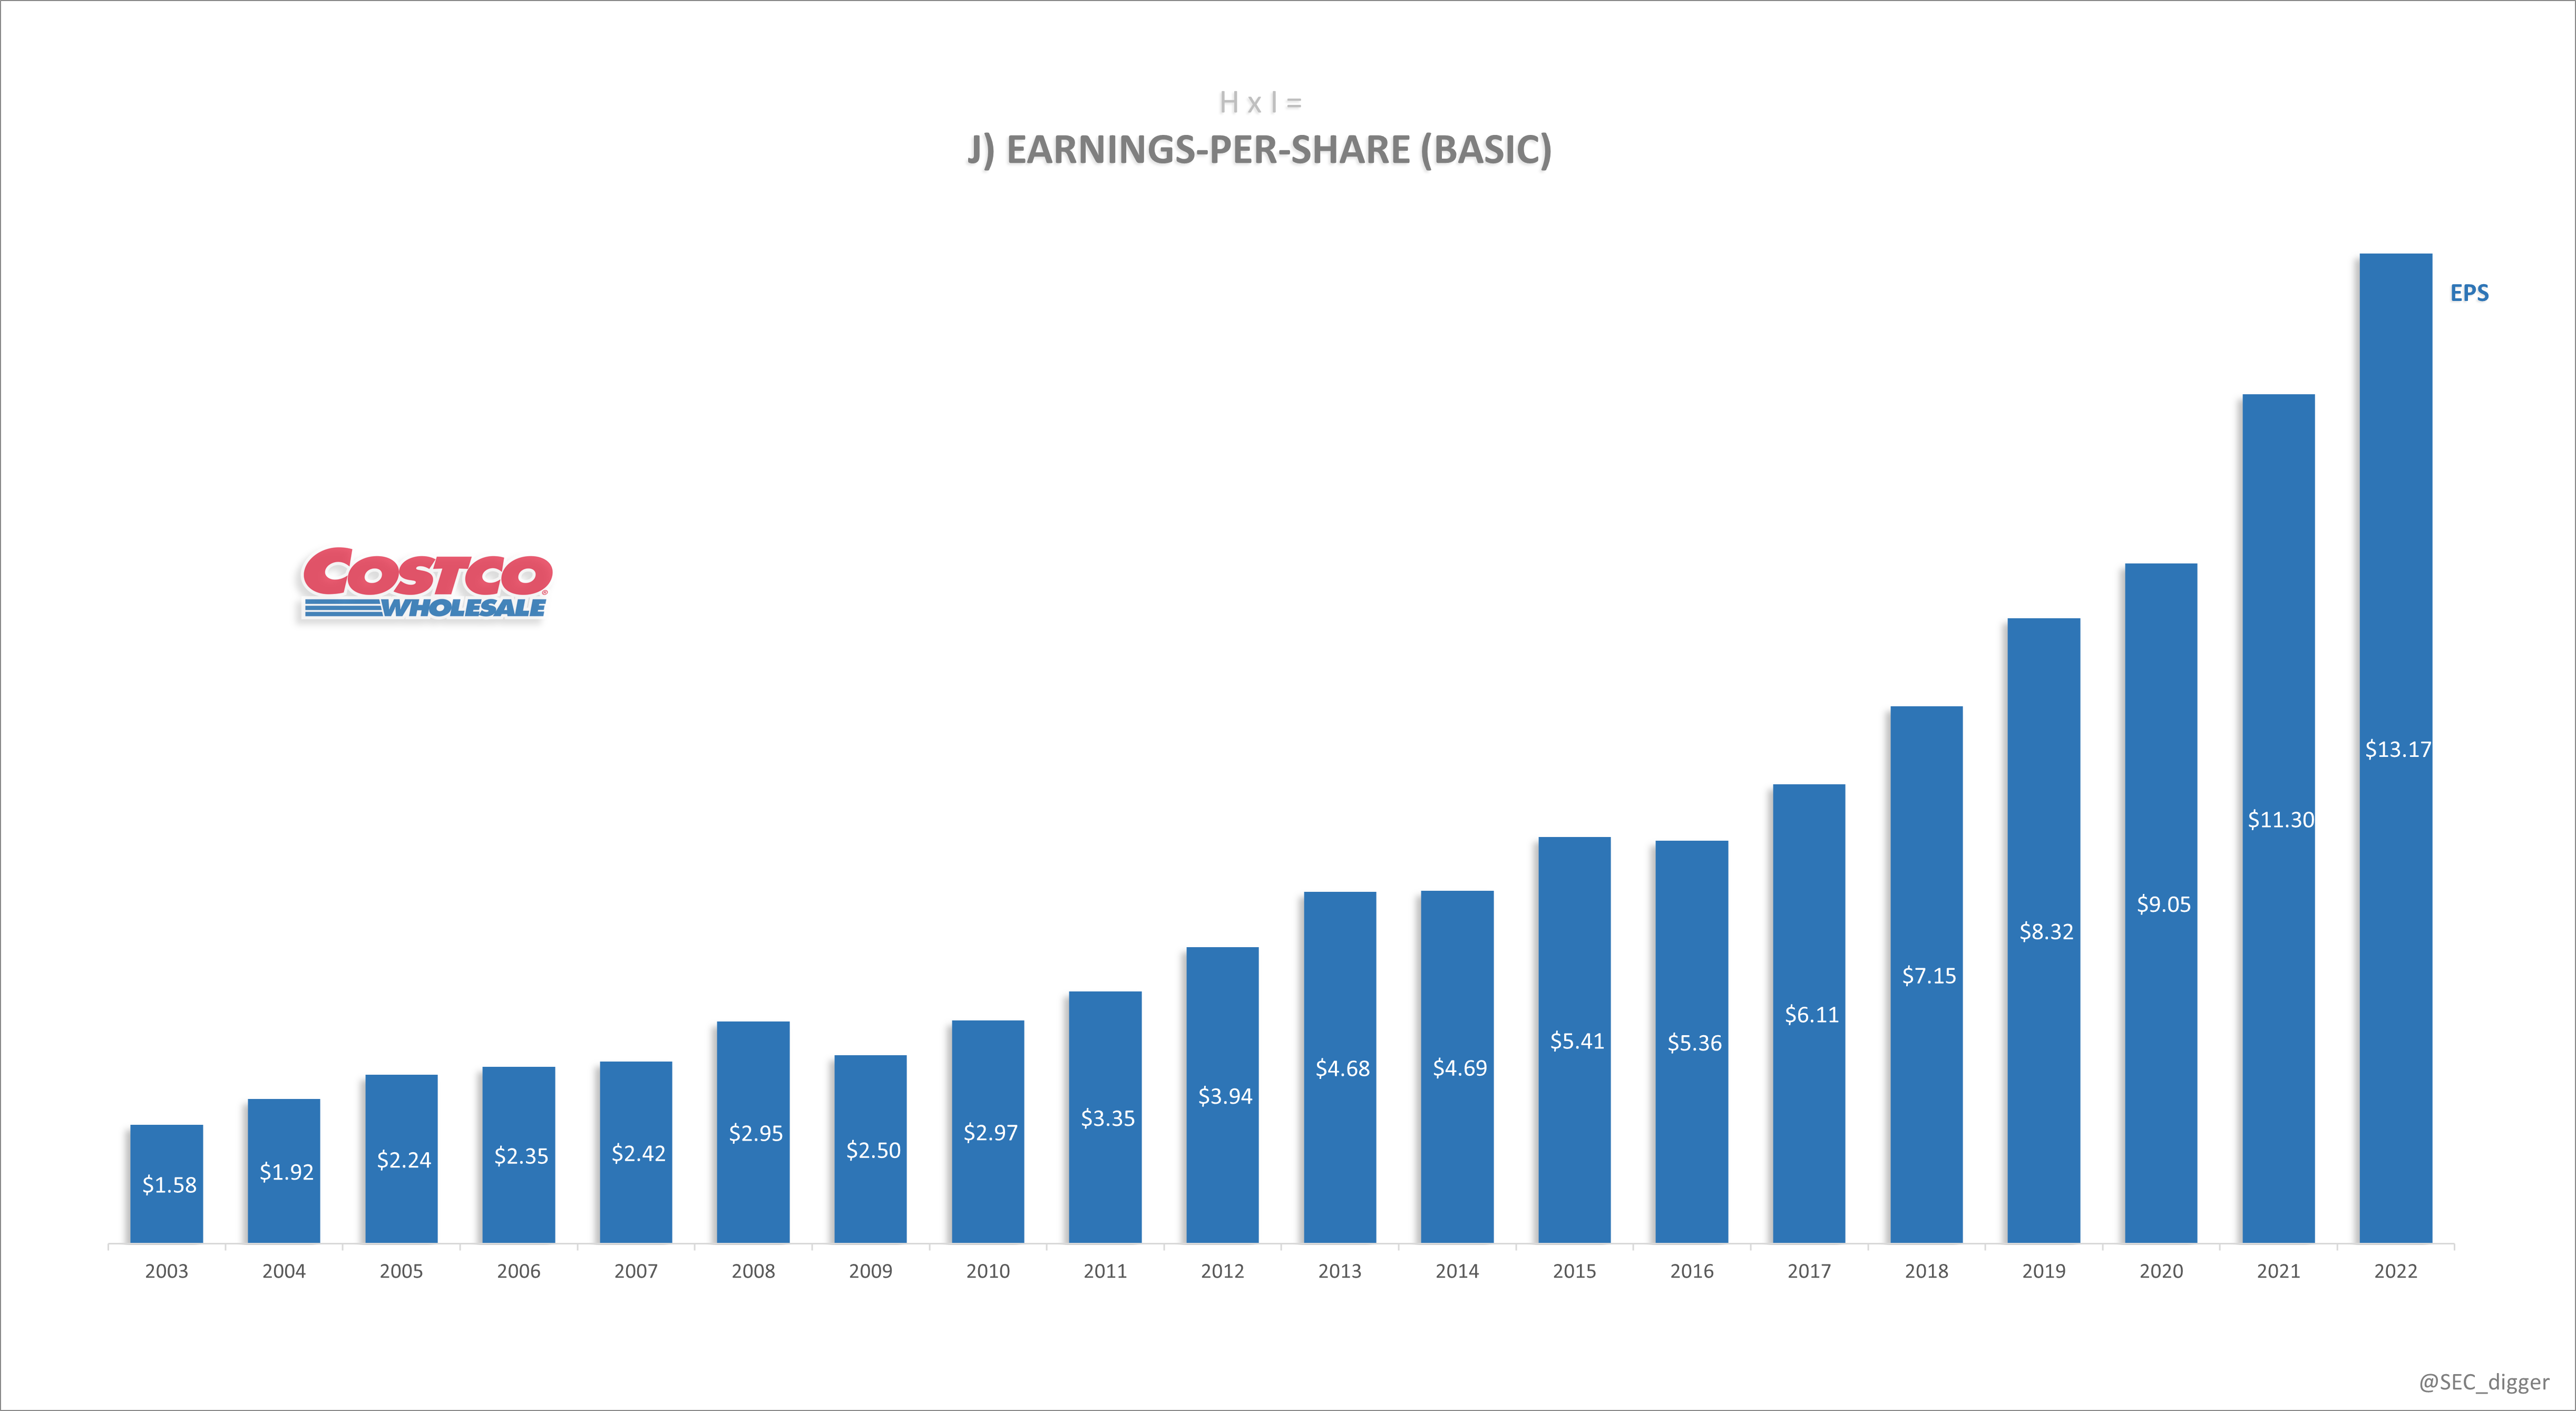
Warehouse Assets
Construction and inventory costs have been rising over time, increasing their average sqft cost basis to ~$372 in 2020. Costco was able to reverse trend temporarily by securing Innovel’s DC space at $67/sqft to support their omni-channel strategy…
Author Generated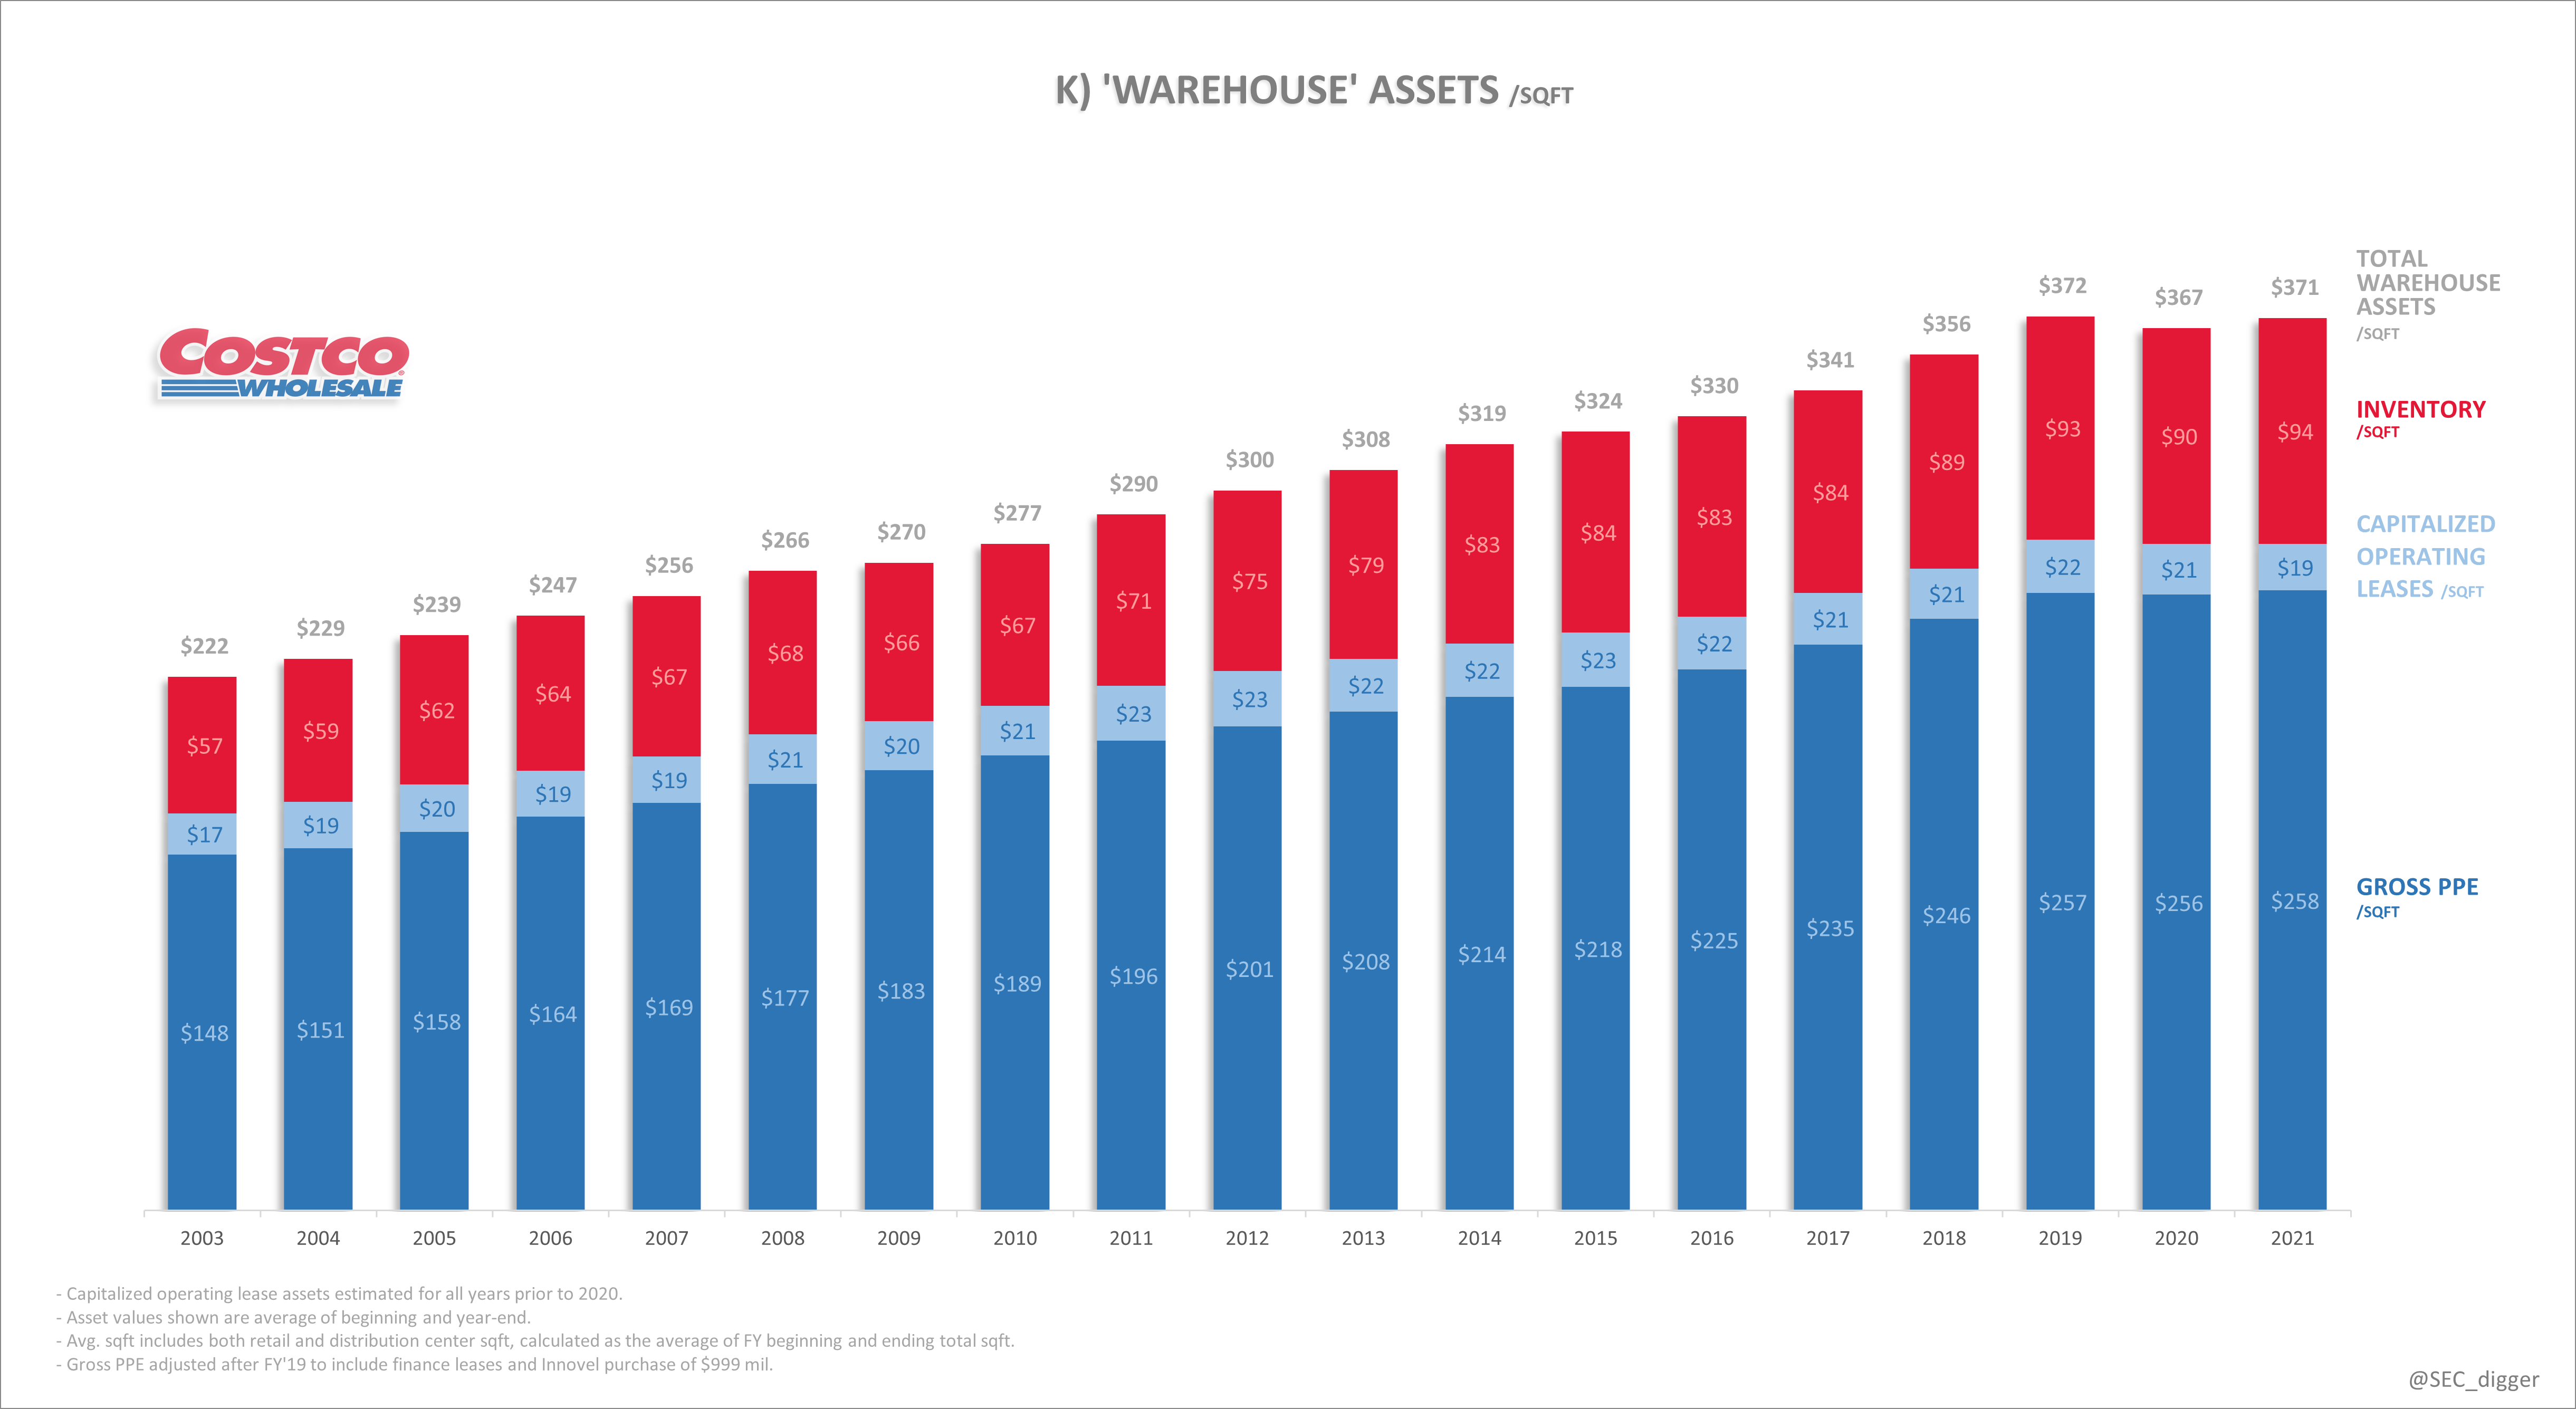
Return on Assets
Over time, Costco has grown earnings faster than growth in their average asset base. Recent retail performance (numerator) coupled with the acquisition of low priced DC square footage (denominator) has resulted in a respectable boost to ROA as of late. The eventual increase of membership fees paired with continued expansion into lower cost DC space could help future ROA stay elevated…
Author Generated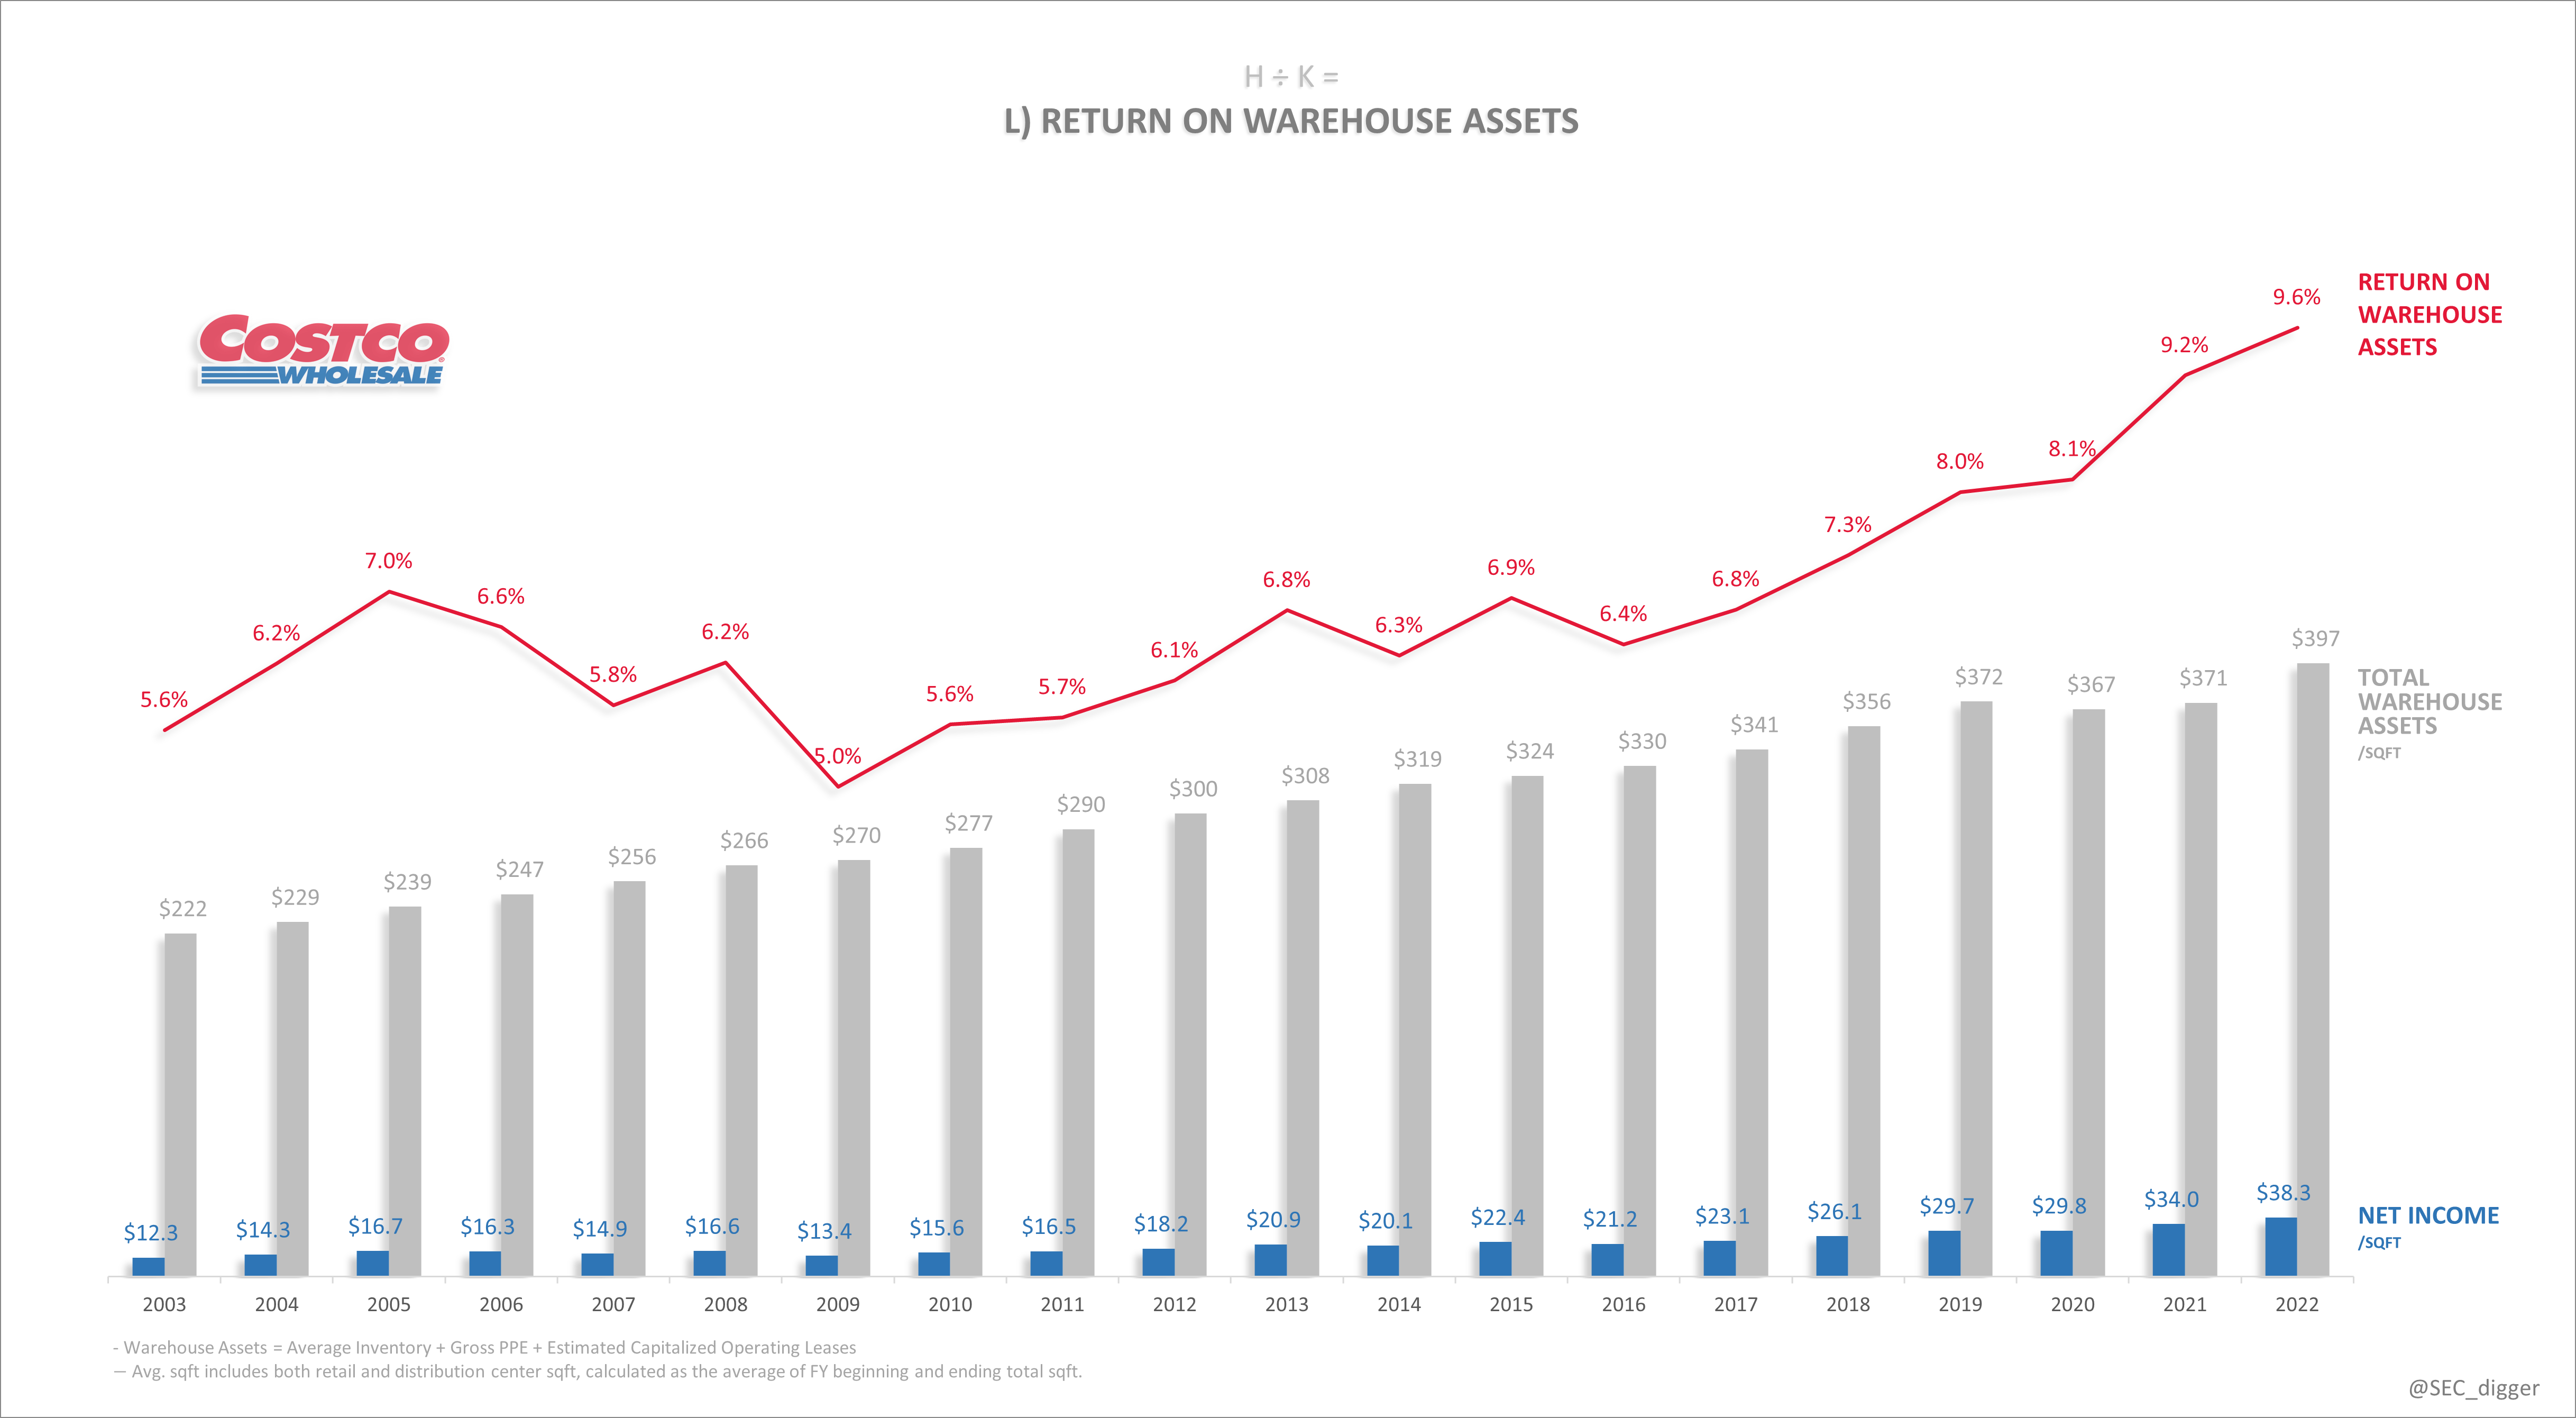
Leverage
Costco has increased leverage (assets/equity) over time. As previously discussed, it’s been suppliers and not bond holders doing the heavy lifting. Assuming inventory turns stay high, vendor ‘float’ will increase as net AP ÷ equity grows…
Author Generated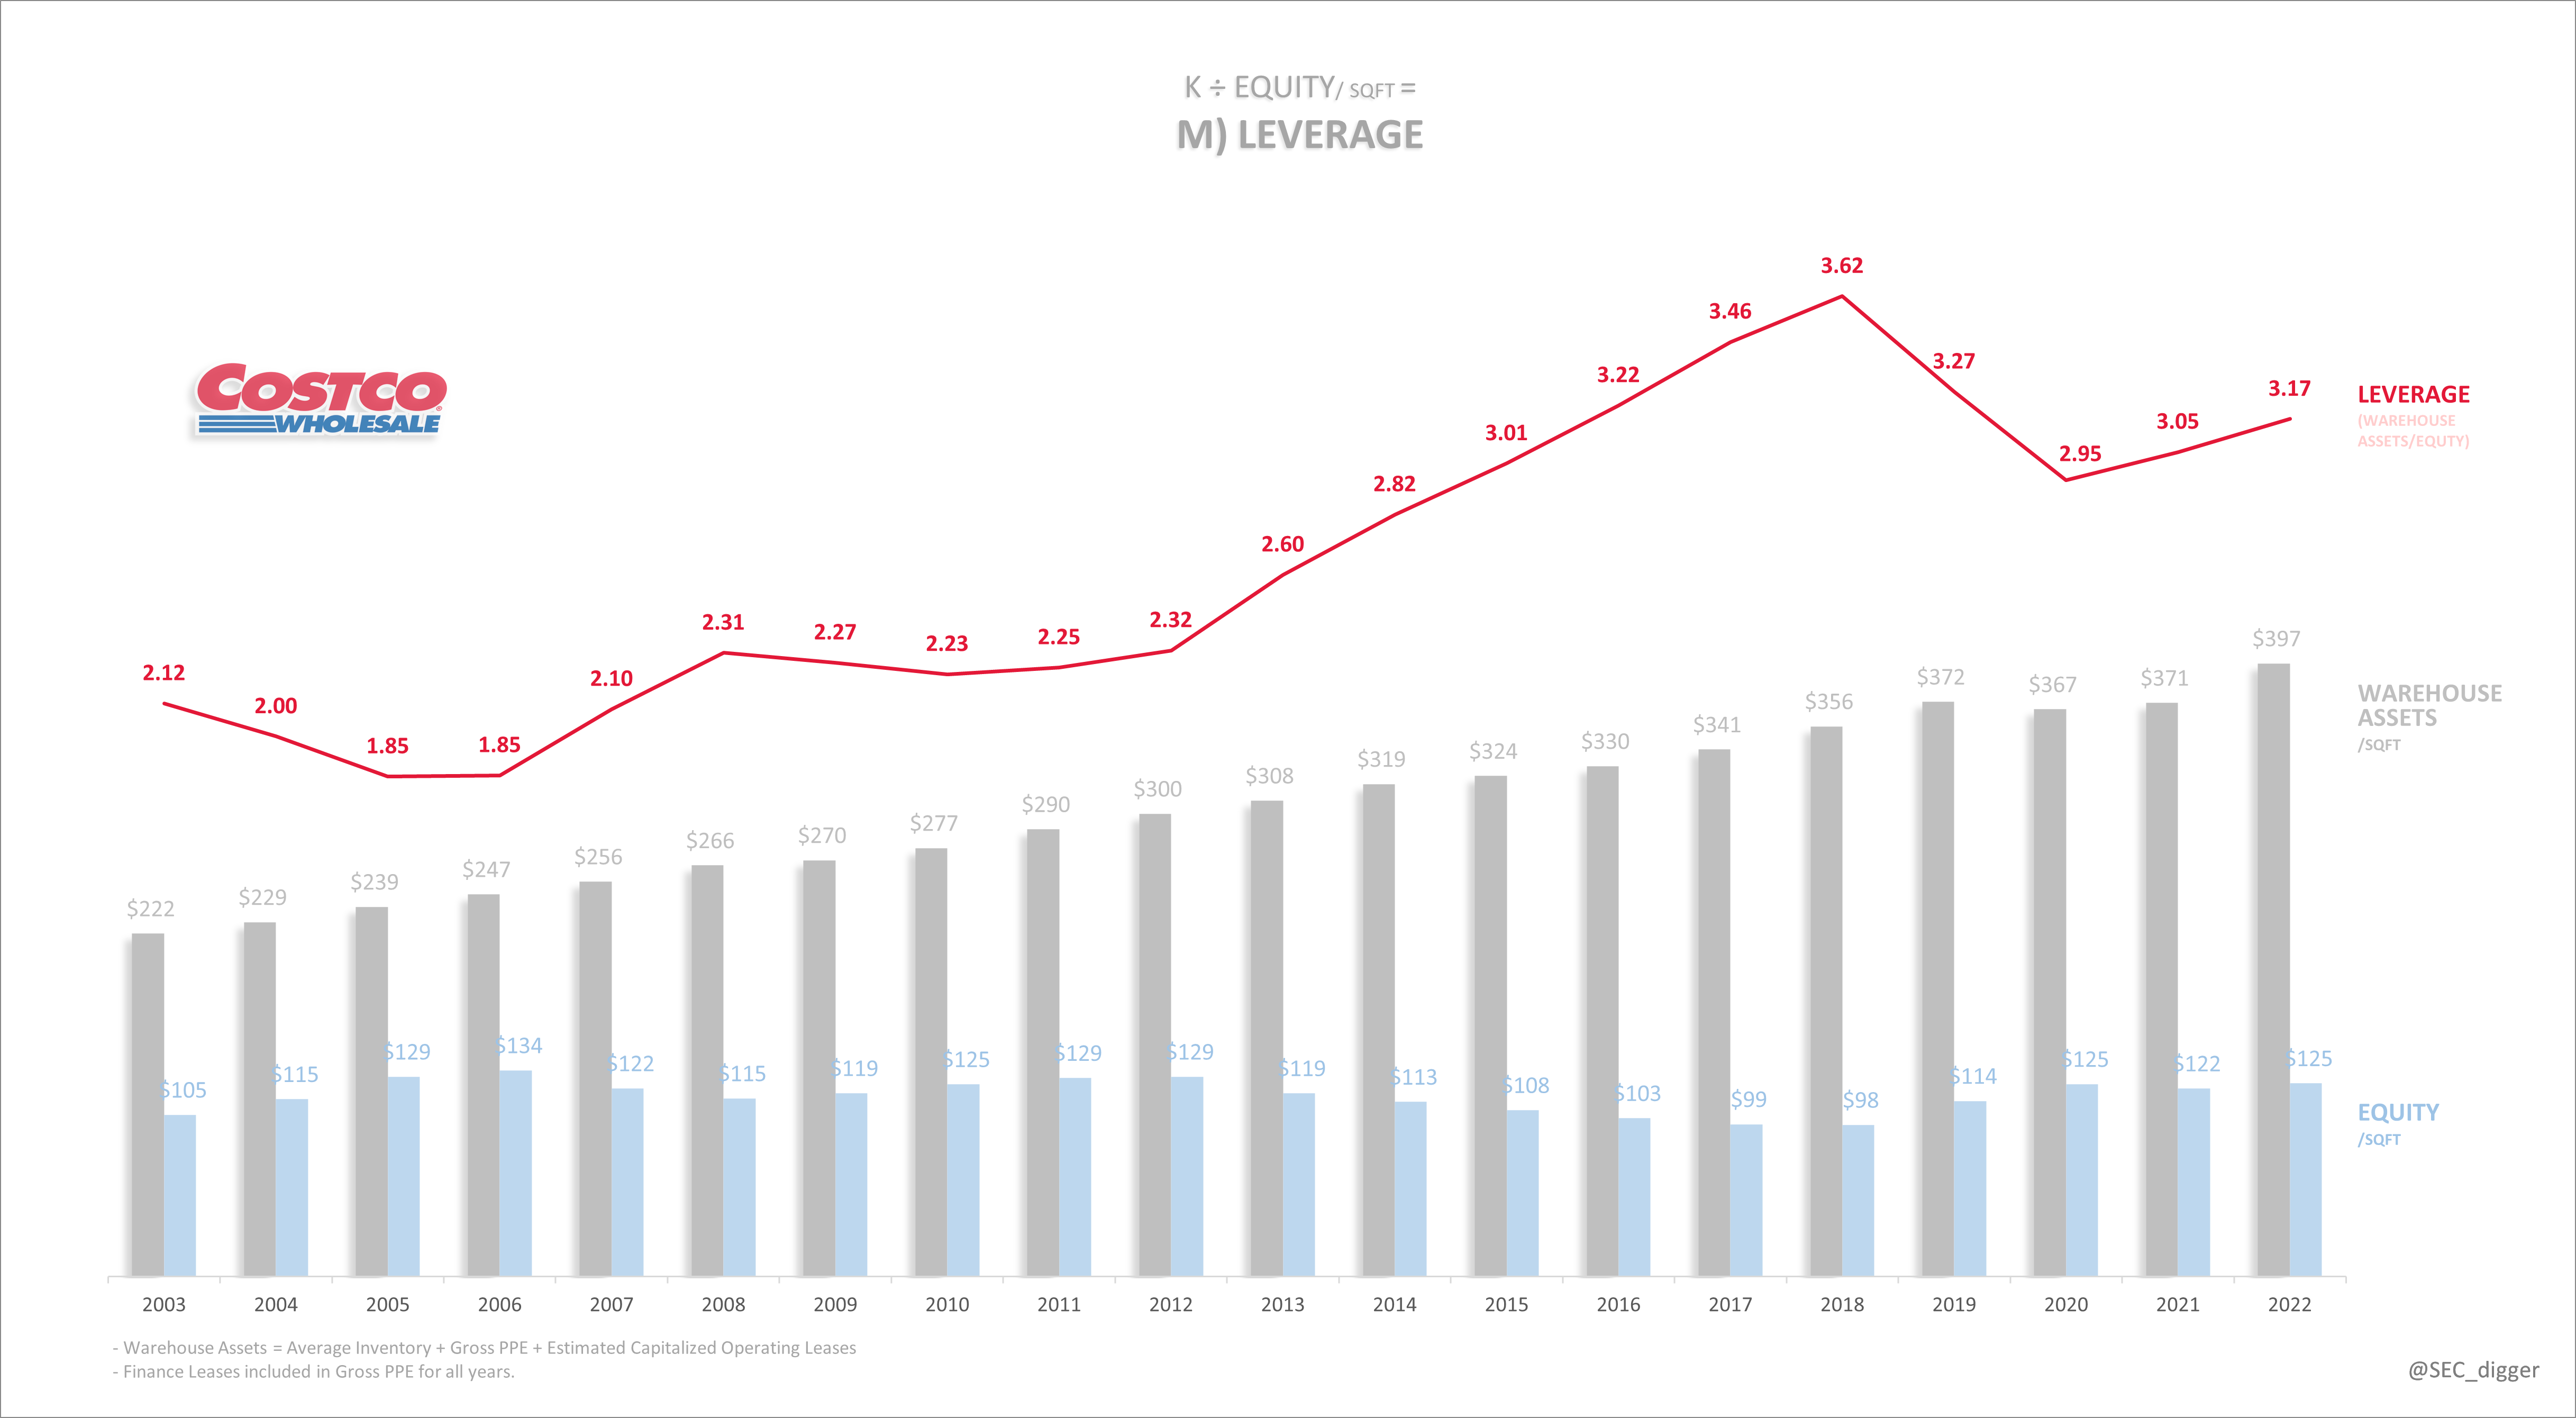
Return On Equity
ROE was in excess of 30% in 2022, driven more by exceptional earnings performance and less by leverage…
Author Generated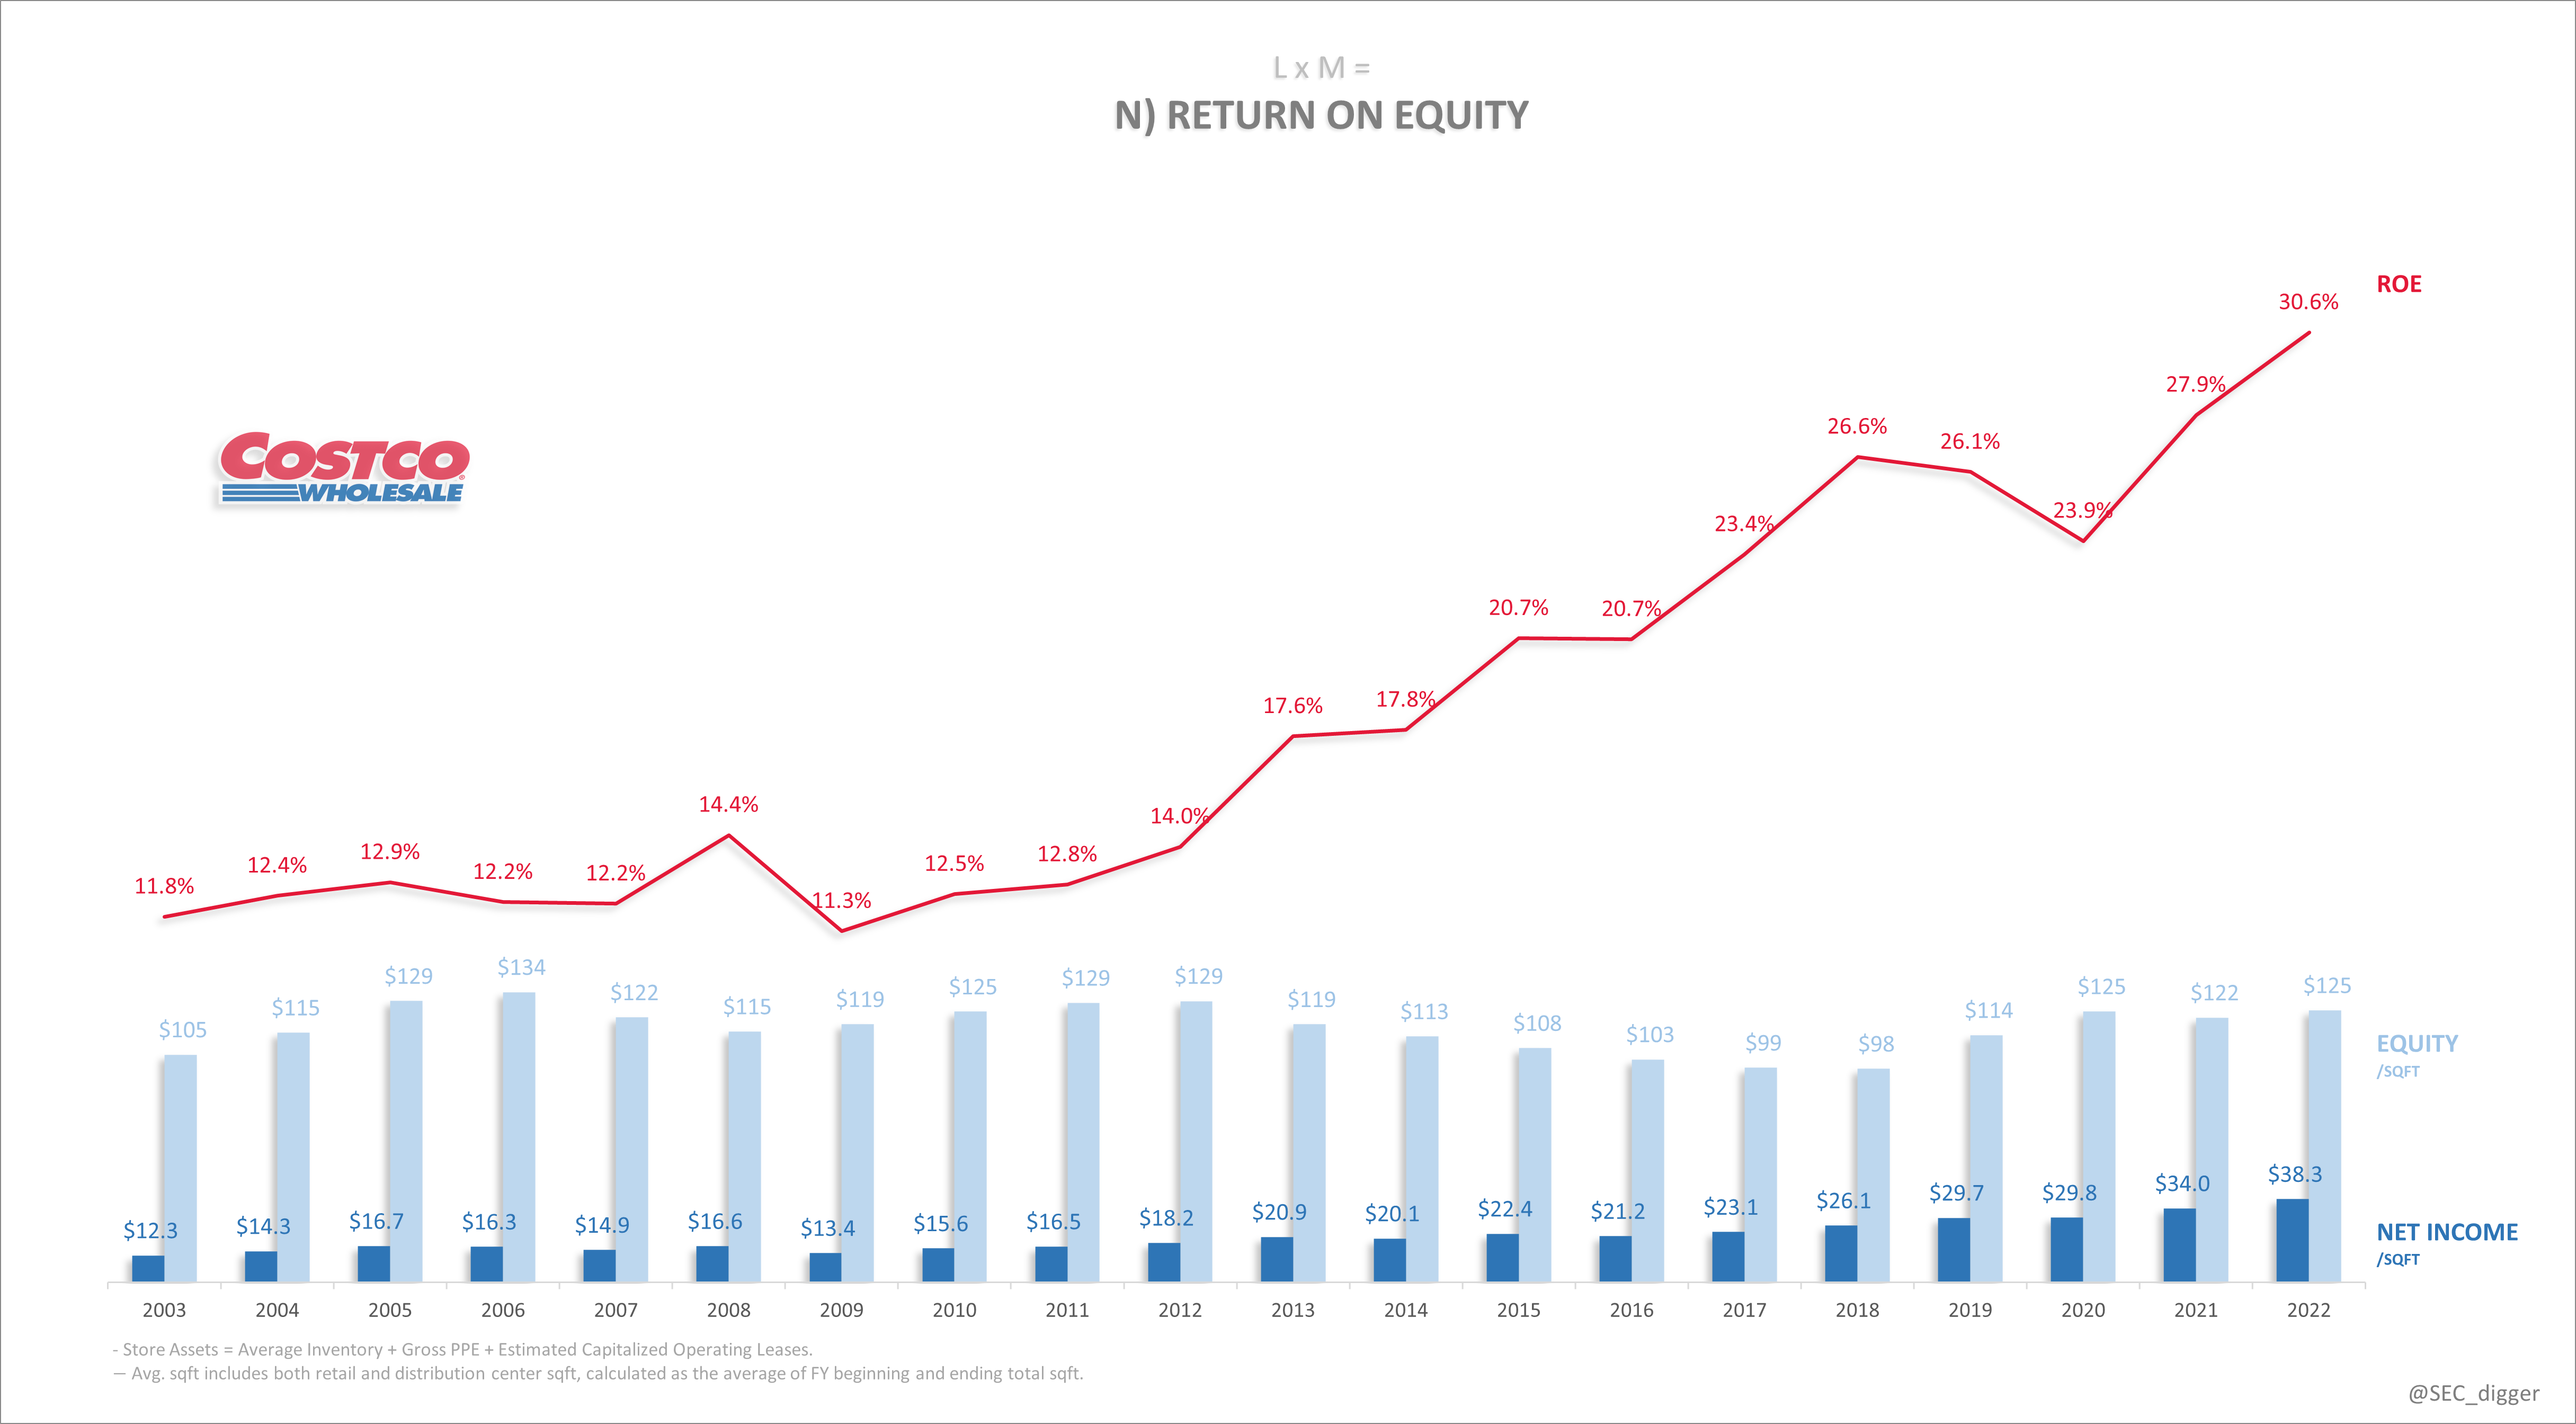
Price-Per-Square Foot
That said, the stock has also gone parabolic to just under $1400/sqft by year-end ’22.
Thankfully management’s been good to LT shareholders by resisting buybacks at those price levels. After all, why should shareholders pay $1400/sqft to buy back retail space when they can build more for a 1/3 of that…
Author Generated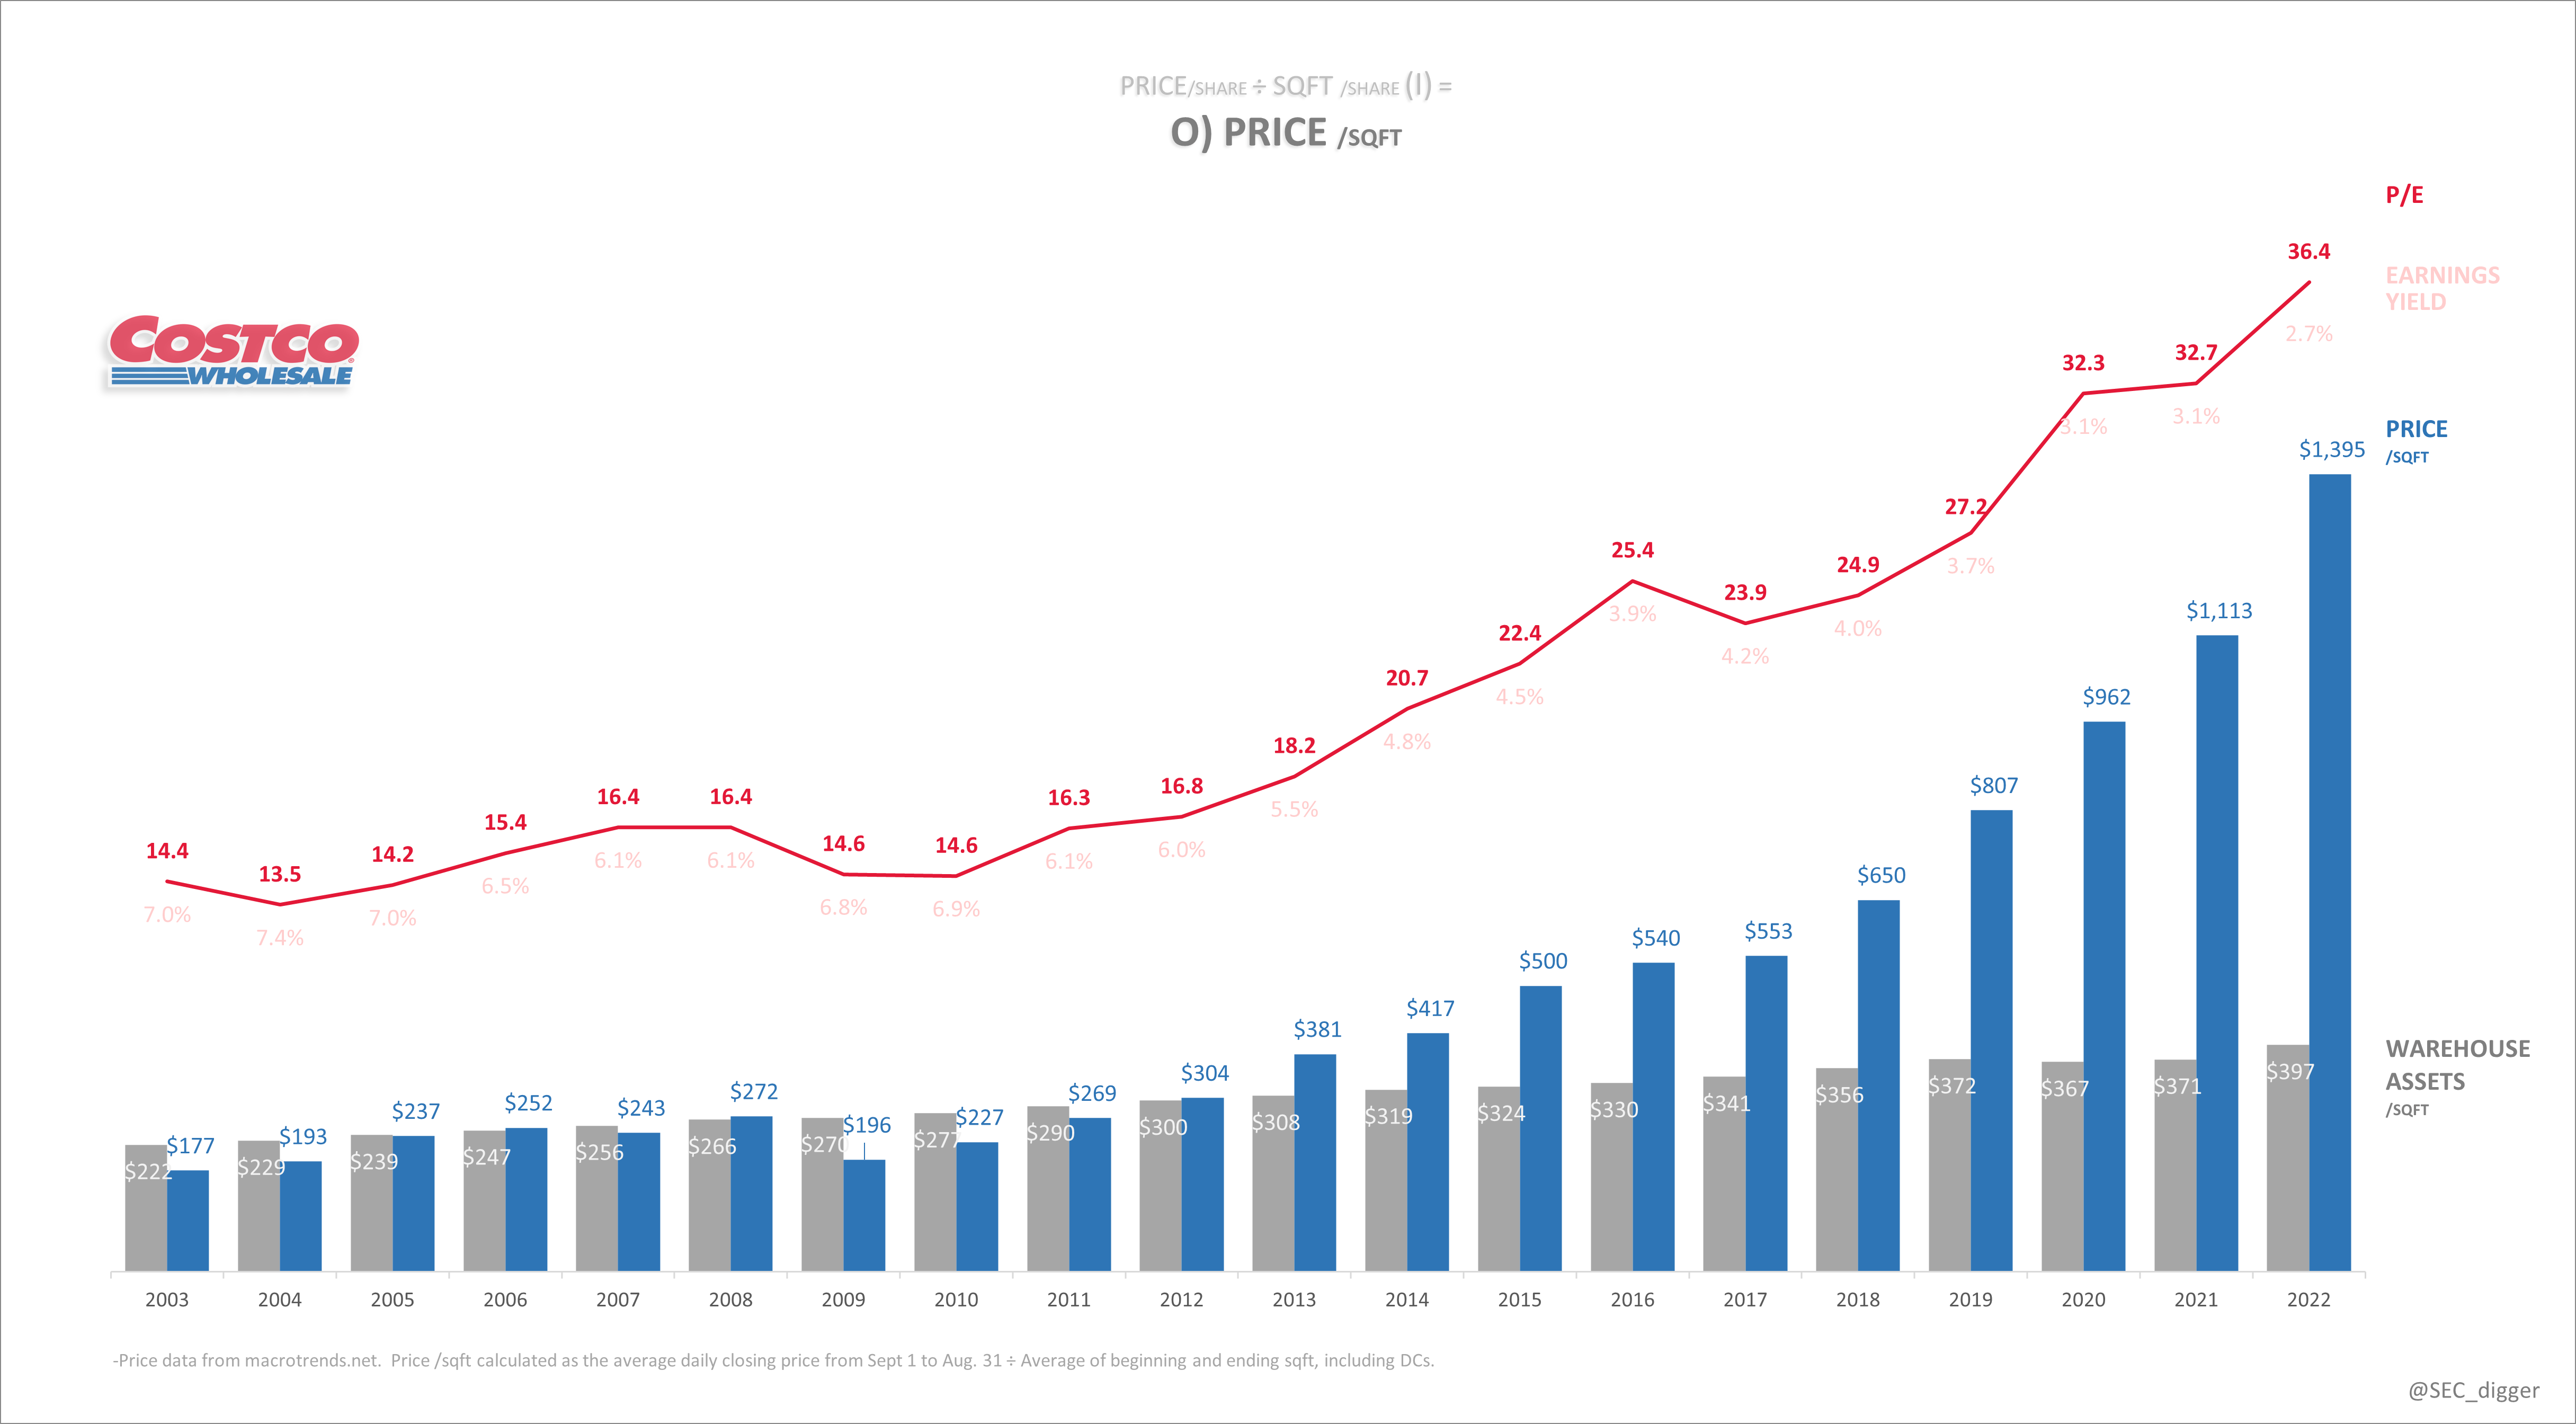
Conclusion
Costco is an exceptional company, there’s no denying that. However, as with any investment, it’s important to consider price. At the moment, the company’s earnings yield is lower than other risk-free options, making a purchase a gamble on future earnings growth. If they’re able to execute on their omni-channel strategy, the high valuation may be justified. Only time will tell if this gamble pays off. As for now, you’ll find me on the sidelines with all the other value curmudgeons… complaining about the lost decade.
Be the first to comment