

bjdlzx
The 50% reduction in the discount on Russian crude is temporary
The discount on Russian crude has declined by almost 50% in mid-August to $21 from almost $35 previously (FUDBM1 Index – Chart 2). We believe that this is temporary. This could be coming from higher Russian supplies to Europe as the latter scrambles to build inventories ahead of implementation of sanctions on Russian seaborne oil. This will be validated in the coming weeks as more than 40% of Russian oil shipments since mid-July as still in transit. It is unlikely that Russia has further increased its oil exports to Asia on logistical and price considerations. Following the start of the Russia-Ukraine war, Asia’s share (mainly India and China) of Russia’s seaborne crude shipments has already soared to as high 36% compared to below 25% previously (Chart 2).
Chart 1 – Urals Med Crude vs Dated Brent Month 1 ($/bbl) (Bloomberg)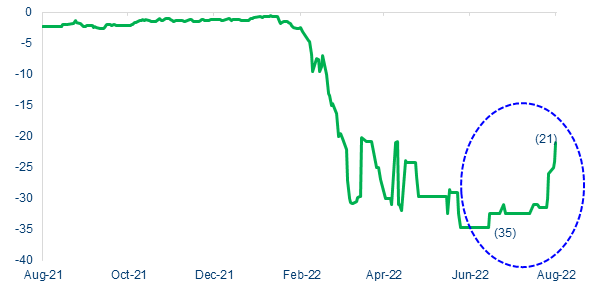
Market is underestimating the impact of EU sanctions on Russian seaborne crude
In our view, the market is understating the impact of European Union sanctions on Russian seaborne oil. While Russia’s crude production has remained fairly stable in the aftermath of the Ukraine war, ranging between 9.2-10.1 mb/d and averaging 9.5 mb/d. There will be a ban on Russian crude oil imports as of December 5, 2022 and ban on petroleum product imports as of February 5, 2023. Pipeline imports of crude oil and petroleum products will be permitted. Exempted countries include Hungary, Slovakia, Czech Republic and Bulgaria. With the war showing no signs of ending, post-sanctions, around 1.5-2.0 mb/d of Russian crude production could be cut-off from the oil markets. This is Russia’s average shipments in recent months to Eastern and Western Europe. The market seems to be assuming that Russia will be able to secure alternative markets and fully divert its exports. This is unrealistic and as the sanctions come into play, there will be an added risk for global supply.
Chart 2 – Russia Crude Oil Seaborne Exports by Destination (mln bbls) (Bloomberg)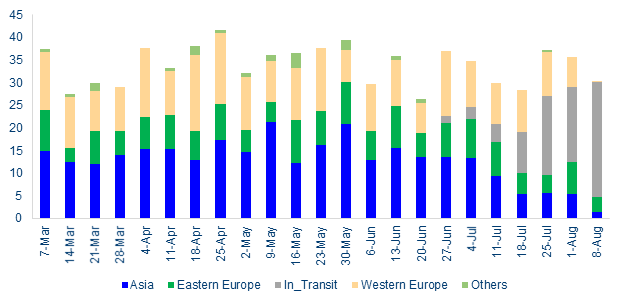
WTI down over 15% QTD on oil market surplus expected in Q3
The oil market in Q2 2022 was more or less balanced on flat OEPC supply and lower non-OPEC production. Q3 supply is anticipated to be more generous on the back of surge in Non-OPEC liquids as well as marginal increments in OPEC crude. All energy agencies are estimating moderate to high surpluses in the oil market during Q3 2022 (Chart 3). The inventory build-up is coming from many sources. Russian exports have been till now steady. The market has felt the impact of strategic release of oil reserves by several countries. Further, there seems to have been slight destruction in U.S. summer demand coming from higher prices. Jet fuel demand in Europe has been dampened on airport restrictions and capacity constraints. Also, of course, China consumption has been lower than expected on intermittent, though continuous COVID-19 related restrictions. Therefore, it is not surprising that WTI and Brent are down approx. 16% and 12% QTD as the market is pricing-in recessionary concerns.
Chart 3 – Market Balance (Bloomberg)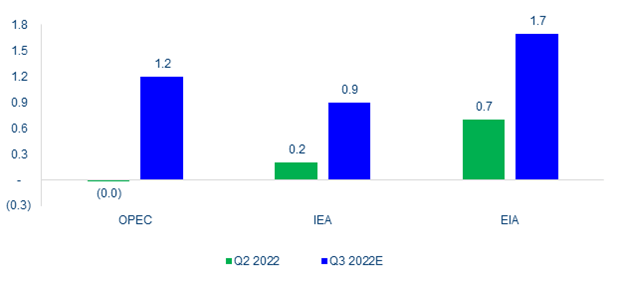
Significant potential for gas-to-oil switching this winter
Significant potential for gas-to-oil switching remains, particularly in Europe this winter on limited gas supplies from Russia amidst burgeoning prices. Natural gas prices in Europe are at records highs as Russian supplies are at just 20-40% of capacity on various pretexts. At the same time, LNG that is being used to replenish Europe storages sites have also rocketed as Korea and Japan build-up supplies ahead of the winter and there are supply disruptions across-the-globe. Natural gas inventories in Europe are less than 65% full with potential for additional supply curtailments. Particularly, in Germany inventories are just 59% full as against the 5-yr average of 75% and in France they stand at 53% compared to 66%. This raises the possibility that gas-to-oil switching will be higher than projections and could be anywhere between 0.5-1.0 mb/d this year. This means that demand could surprise on the upside.
Chart 4 – Europe Gas and Asia LNG have shot up sharply again (Bloomberg)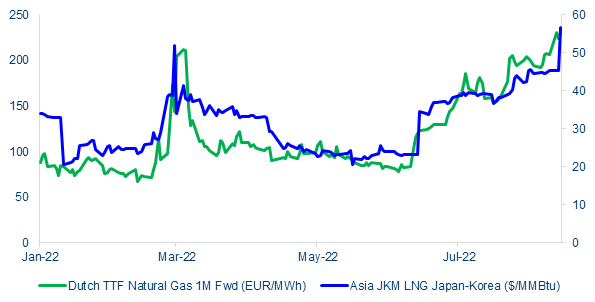
Demand outlook for 2023 is already very upbeat
Energy agencies across-the-board are very positive on the demand outlook for 2023. OPEC is expecting demand growth of 2.7 mb/d. While IEA and EIA are both estimating demand growth at 2.1 mb/d. This is despite the economic slowdown and recession risks. There are upside risks to this on a faster reopening of China and surge in travel demand. Moreover, a milder recession and dovish stance by the Fed could be positive factors.
2023E Oil Demand Growth Expectations
|
2022E |
2023E |
Change |
|
|
OPEC |
100.0 |
102.7 |
2.7 |
|
IEA |
99.7 |
101.8 |
2.1 |
|
EIA |
99.4 |
101.5 |
2.1 |
Source: Bloomberg
Global spare capacity outside OPEC+ is almost negligible. Rather than raise production, the group may consider to tighten supplies if oil prices decline anymore. Most OPEC+ member states are consistently underperforming on their production increase targets. Further, let us not forget that Russia is producing more than a million barrels less than its quota. Thus, considering the constrained supply situation amidst upside risks on the demand side, we believe that the recent soft trend in crude oil will quickly reverse. As we move from Q3 to Q4, Brent crude is likely to soar to the $105-110 level. This gives us an opportunity to take long positions in Exxon Mobil (XOM) and Chevron (CVX) that are 12-15% below their peak points.
Be the first to comment