

Fokusiert
Real Estate Weekly Outlook
This is an abridged version of the full report and rankings published on Hoya Capital Income Builder Marketplace on January 14th.
U.S. equity markets posted broad-based gains after the closely-watched CPI inflation report showed signs of easing inflationary pressures, strengthening the case for the Fed to slow its pace of interest rate hikes and potentially avoid a “hard” economic landing. The “D word” – disinflation – dominated the discussion after the closely-watched CPI-ex-Shelter Index – the metric that showed the historic surge in inflation a year before it was reflected in the headline CPI – was negative for the fifth month in the past six.
Hoya Capital
Pushing its year-to-date gains to above 4% following a dismal year of performance in 2022, the S&P 500 advanced 2.7% on the week while the tech-heavy Nasdaq 100 rallied 4.5%. The more domestic-focused Mid-Cap 400 and Small-Cap 600 each posted gains of roughly 4% as well. Real estate equities – the sector with perhaps the most upside from easing rate pressures – were leaders in the week. The Equity REIT Index rallied 4.5% this week with all 18 property sectors in positive territory while the Mortgage REIT Index rallied 5.9%. Homebuilders and the broader Hoya Capital Housing Index – were broadly higher for a second-straight week, buoyed by signs that moderating mortgage rates have begun to revive the icy-cold housing market.
Hoya Capital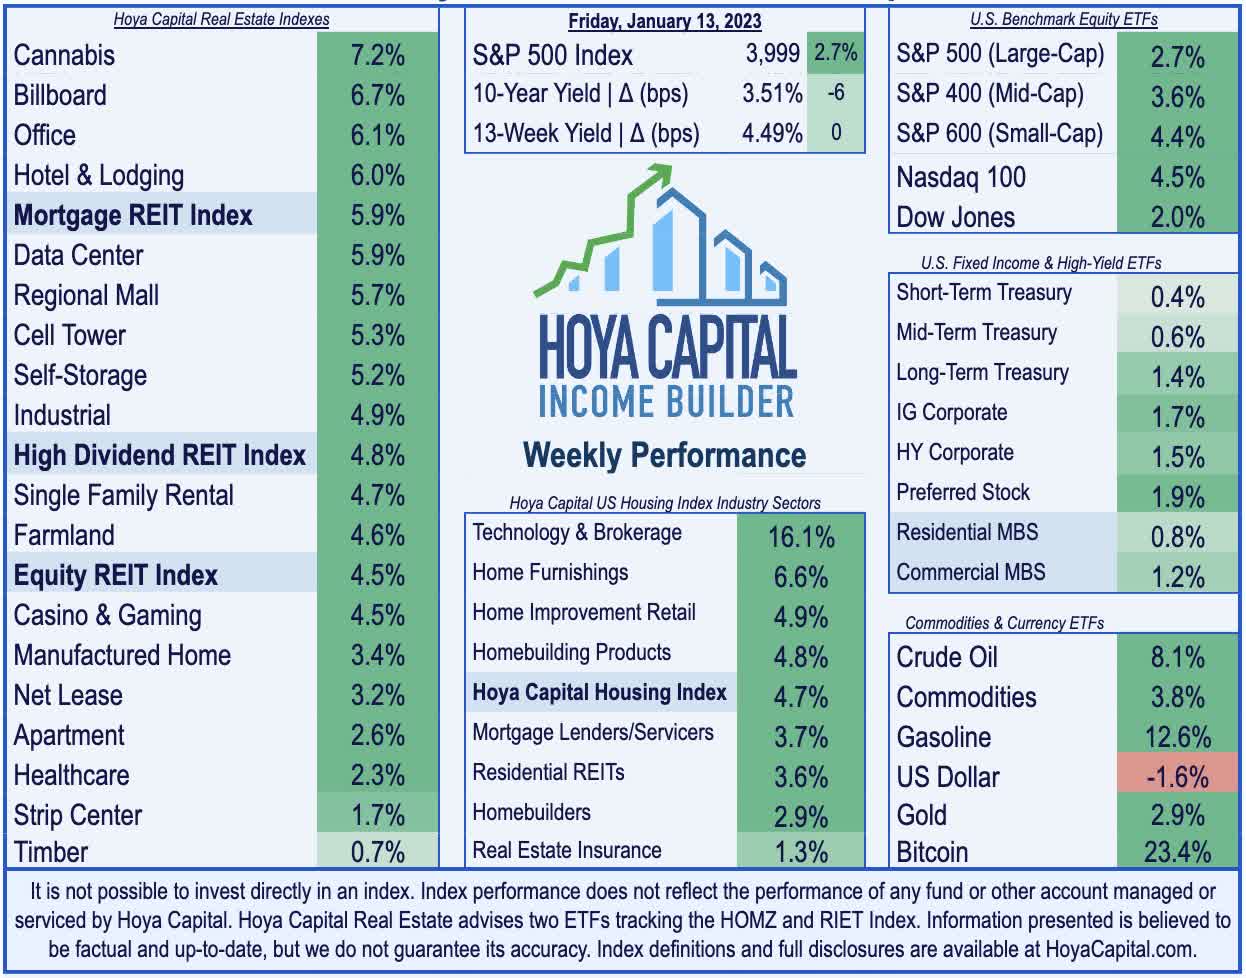
Encouraging inflation data also sparked a broad-based rally in bond markets across the credit and maturity curve as the 10-Year Treasury Yield dipped 6 basis points to close at 3.51% – back on the cusp of the lowest levels since September and well below its peak closing high of 4.25% in October. With the Federal Reserve now expected to downshift rate hikes to standard 25 basis-point increments beginning with the February meeting, the US Dollar Index dipped nearly 2% to close at its lowest levels since June. A potential “thorn in the side” of the encouraging inflation trends, Crude Oil and Gasoline prices rebounded sharply this week from recent eighteen-month lows as investors monitor high-frequency data from China to assess the economic impacts of recent easing in COVID-related lockdown measures. Nine of the eleven GICS equity sectors were higher on the week with Consumer Discretionary (XLY) and Technology (XLK) stocks leading to the upside.
Hoya Capital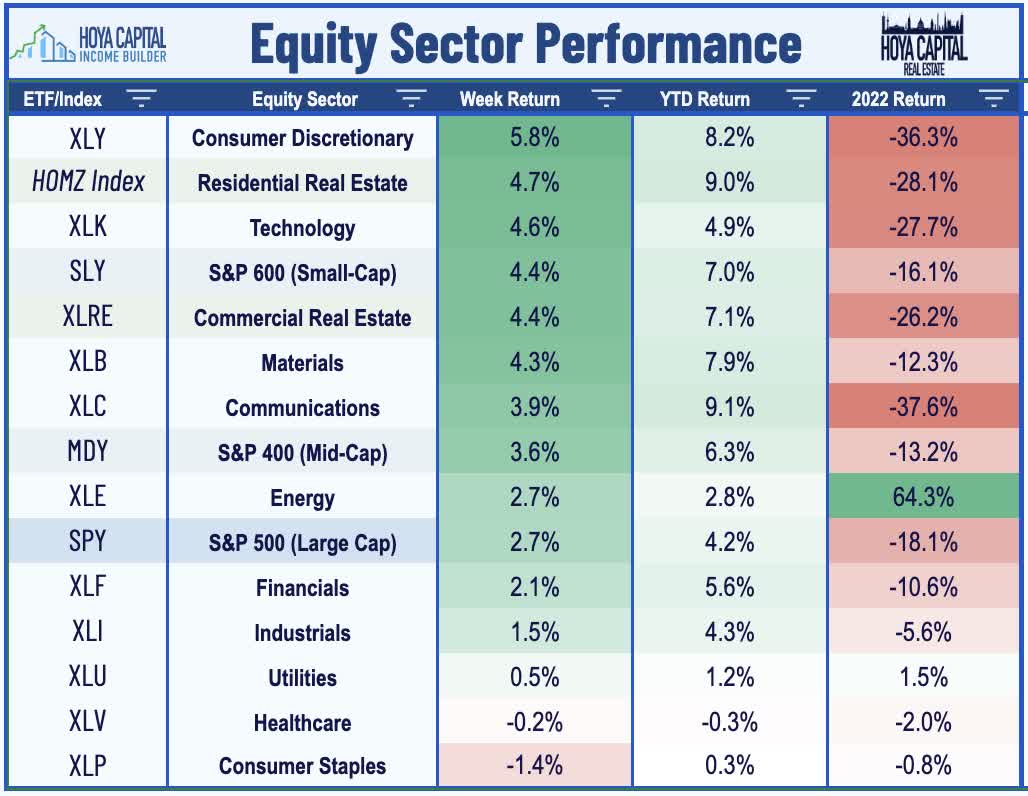
Real Estate Economic Data
Below, we recap the most important macroeconomic data points over this past week affecting the residential and commercial real estate marketplace.
Hoya Capital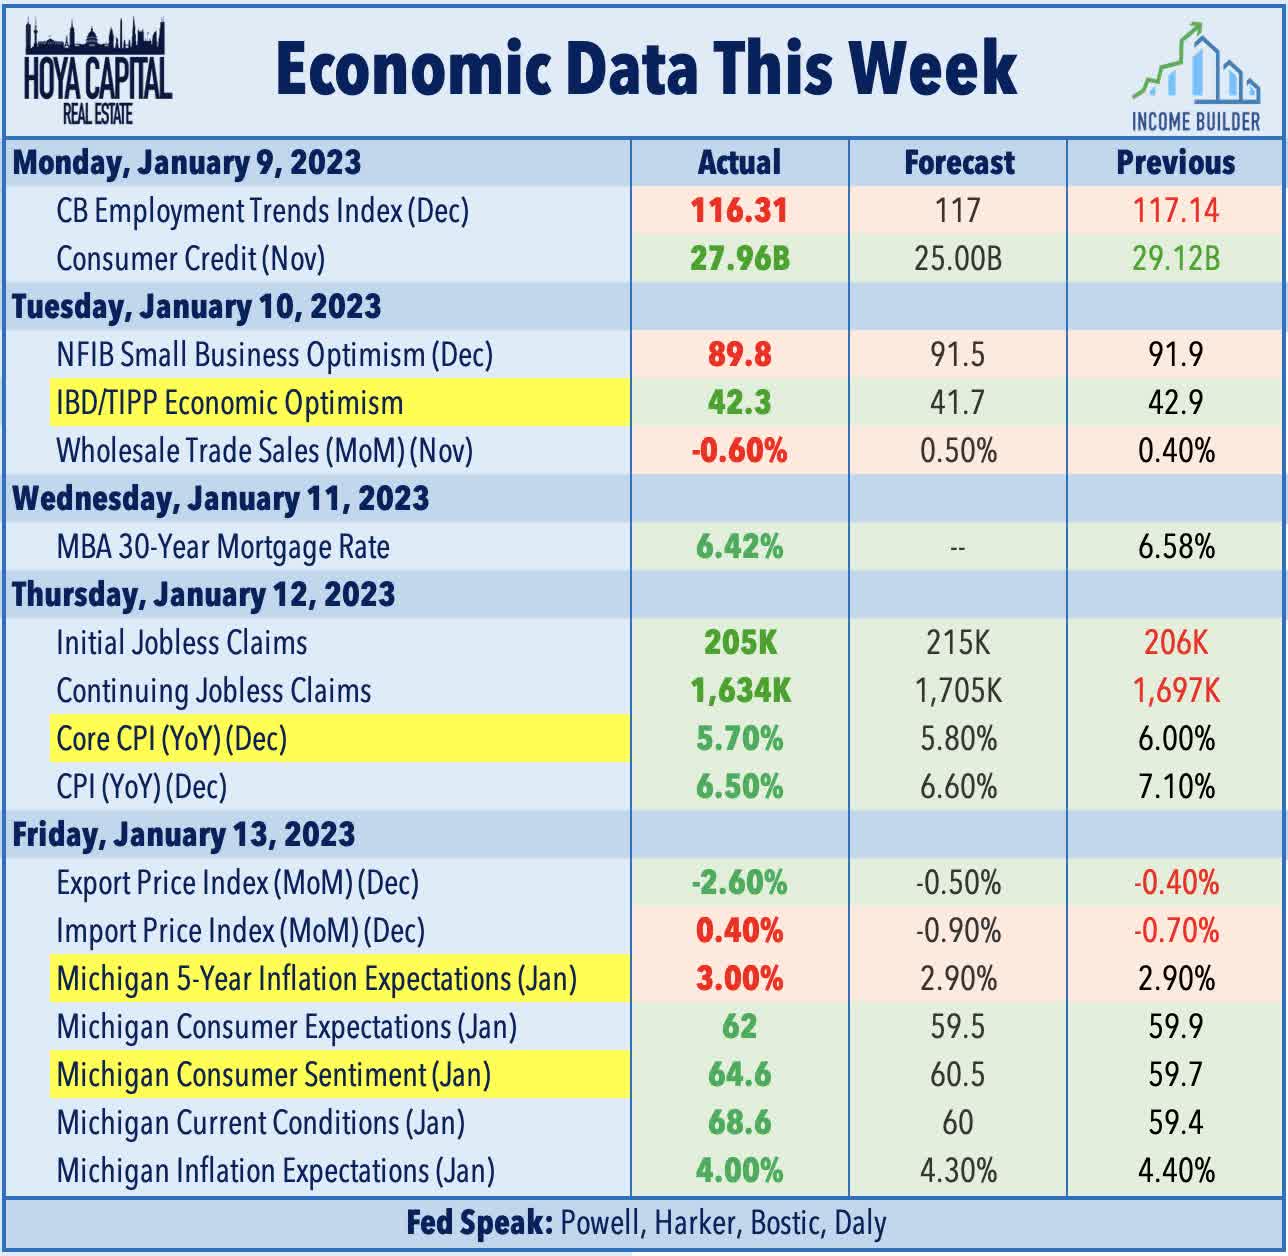
Peak Inflation? Sure looks that way. The Consumer Price Index showed a cooler-than-expected increase in prices in December with the Headline and Core CPI coming in at-or-below consensus expectations, indicating that inflationary pressures may finally be rolling over amid a broader global economic slowdown. The Headline CPI Index posted a 0.1% decline for the month, slowing the annual increase to 6.4% – the lowest since October 2021 – while the annual increase on the Core CPI Index slowed to below 6%. Notably, the CPI-ex-Shelter Index – the metric that we believe officials should most closely watch given the lagged effects of shelter inflation – was negative for the fifth month in the past six. As we’ve cautioned for the last year, the CPI Index was substantially understating the real-time increase in the single-largest component of the index – Shelter – since mid-2021 due to the sampling methodology which only collects “same-unit” data twice per year.
Hoya Capital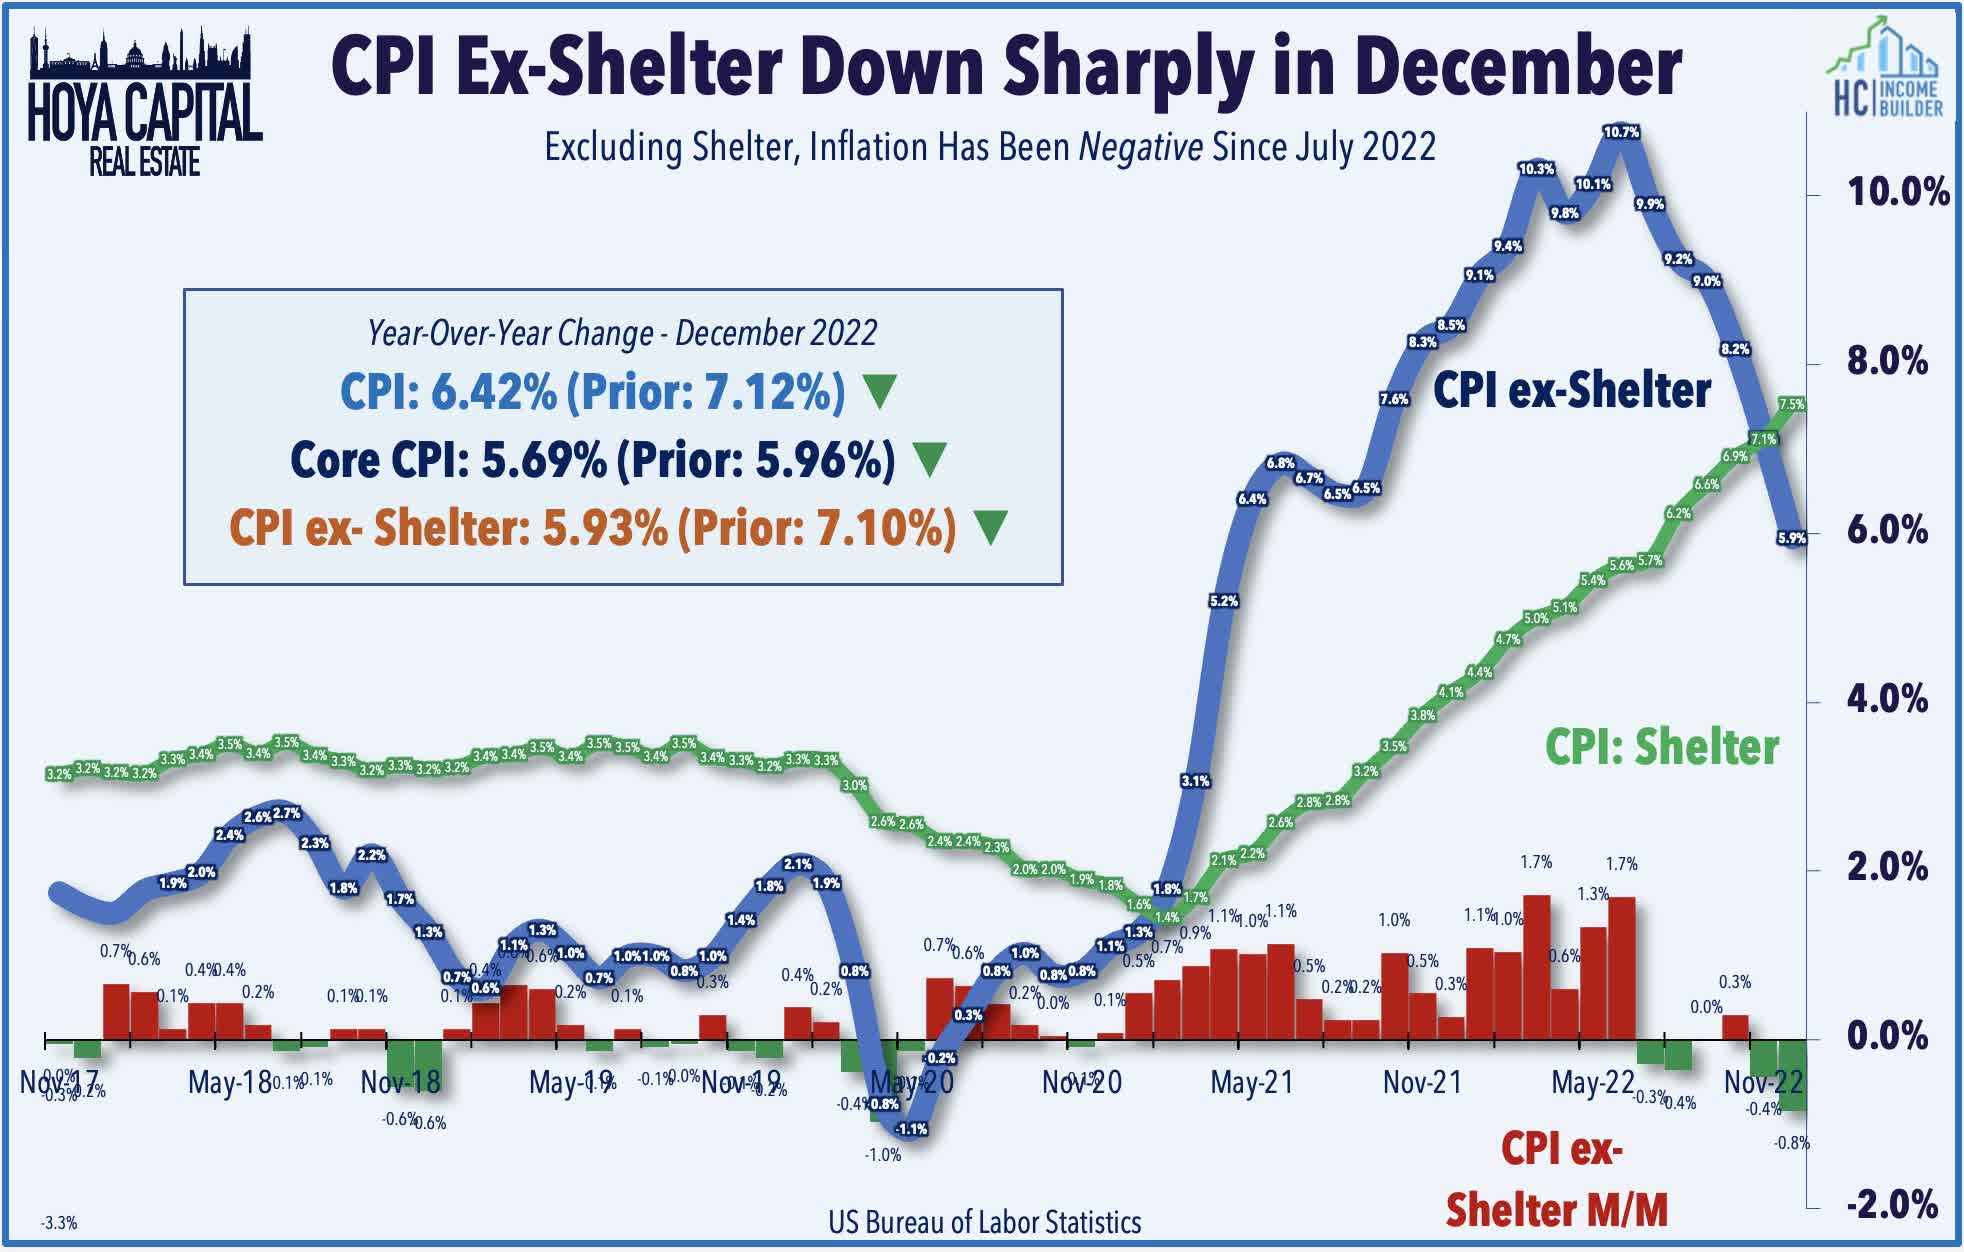
Remarkably, since July, the CPI ex-Shelter Index has declined by 1.6% – an annualized rate of -3.2% – which is among the most deflationary six-month periods on record for that index. In fact, just two periods in the past 75 years of BLS data have seen a lower six-month average inflation rate on the CPI ex-Shelter Index: 2009 and 2015. The cooler-than-expected headline print was even more encouraging given the acceleration in CPI Shelter to 7.5% – the highest annual increase since 1982. The Michigan Surveys of Consumers showed similar encouraging trends with its metric for one-year consumer inflation expectations slowing to the lowest-levels since early 2021 at 4.0% – down from a peak of 5.4% in early 2022. The Fed has monitored these expectations metrics particularly closely in recent months given their concern over a potential “wage-price spiral.” Cooler inflation also fueled a broader rebound in the Consumer Sentiment Index to one-year highs.
Hoya Capital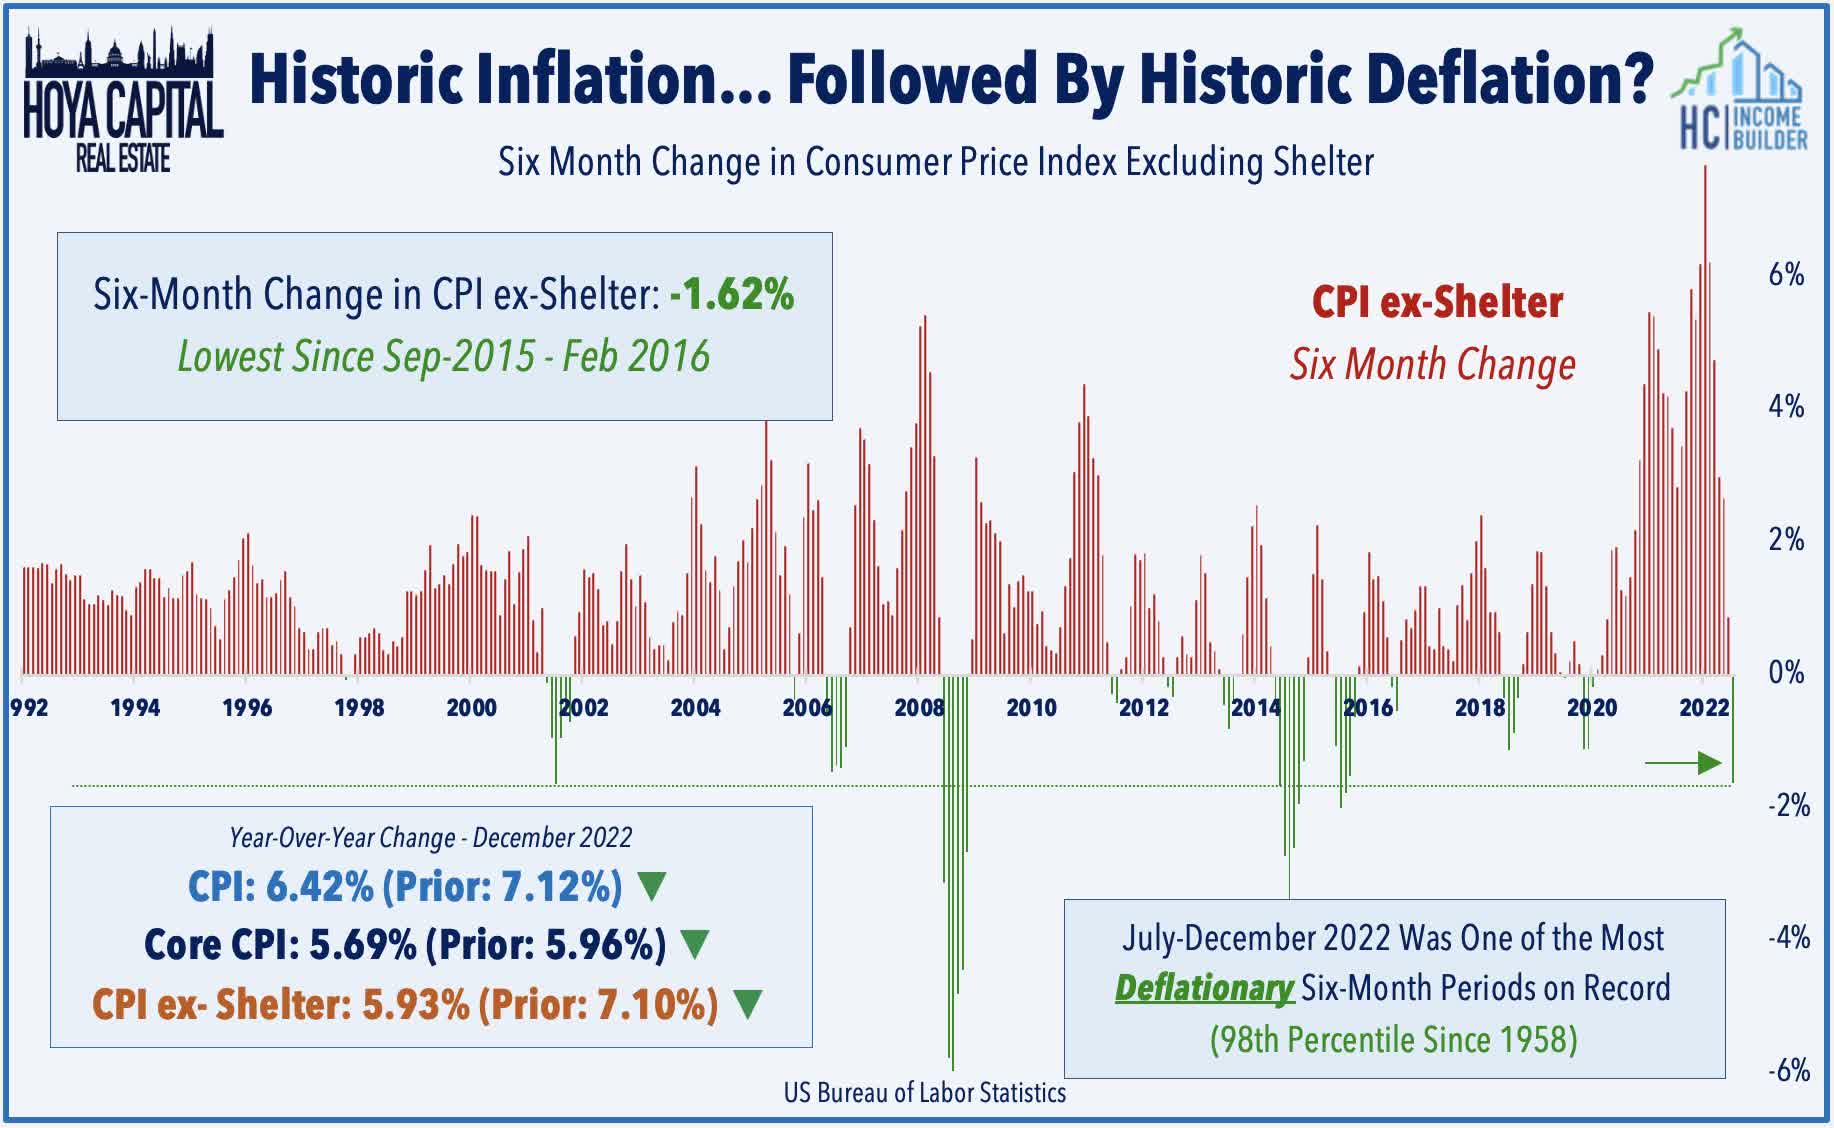
Equity REIT Week In Review
Best & Worst Performance This Week Across the REIT Sector
Hoya Capital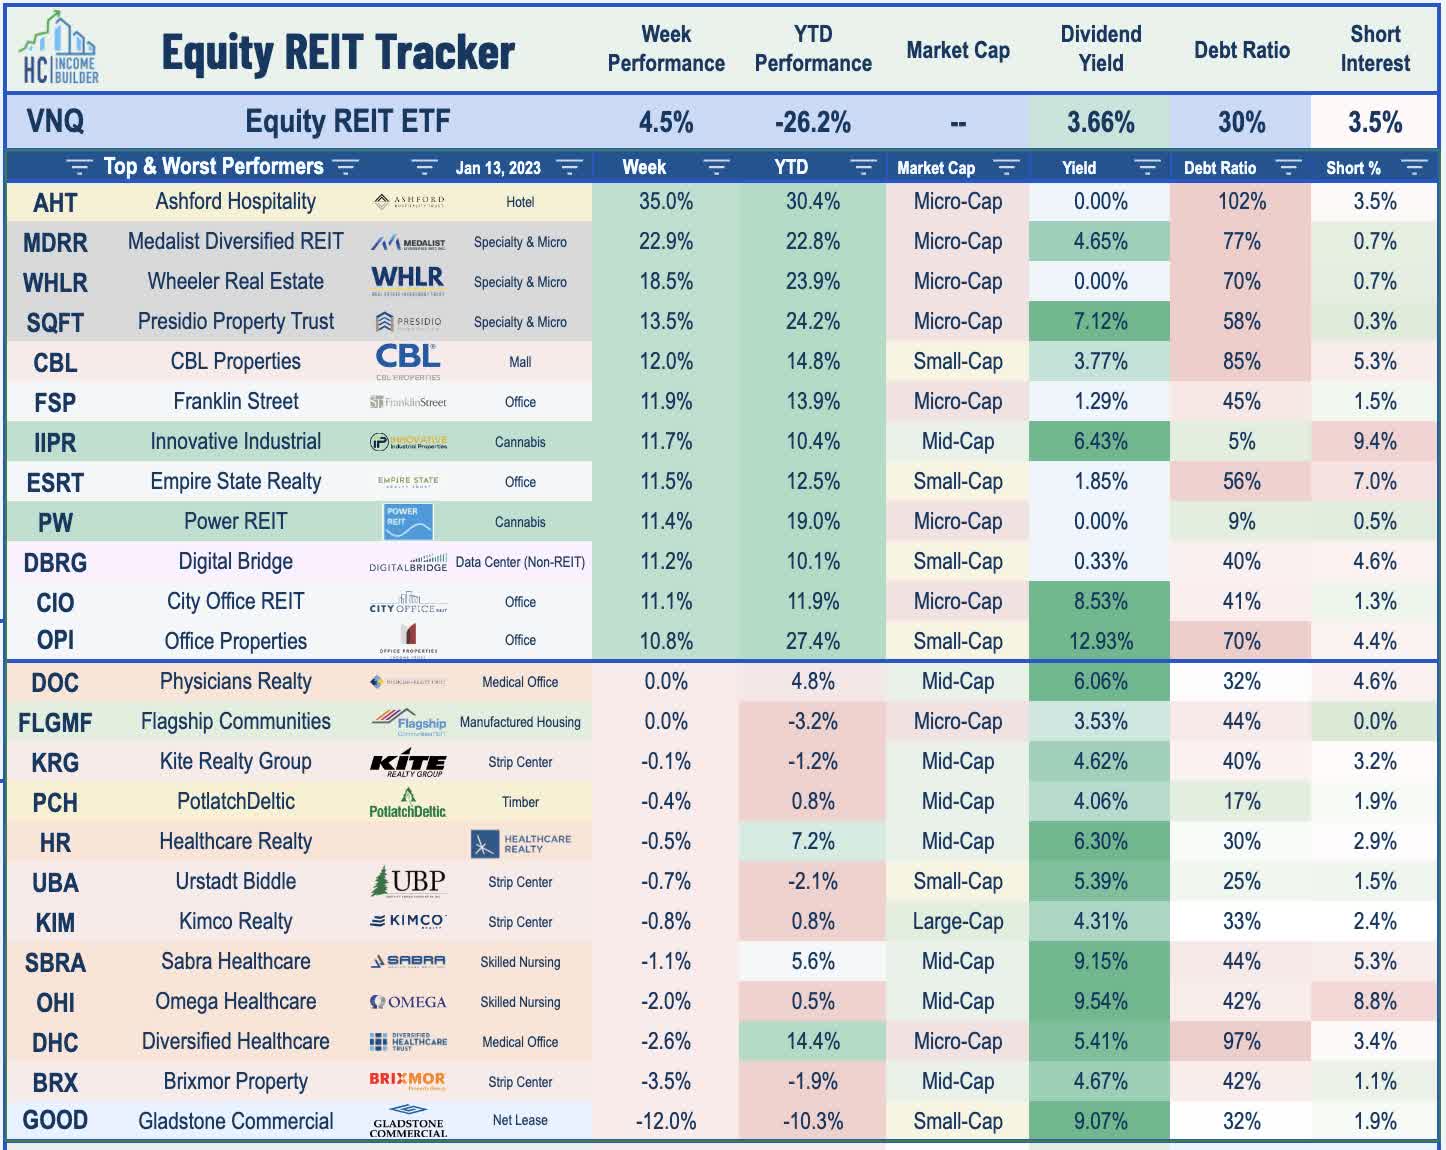
Manufactured Housing: UMH Properties (UMH) – which we own in the REIT Focused Income Portfolio – rallied nearly 5% this week after it raised its quarterly dividend by 2.5% to $0.205/share. This week we published Manufactured Housing: Recession Resistant REITs. We noted that MH REITs snapped an incredible streak of nine straight years of outperformance over the REIT Index in 2022, impacted by headwinds from higher interest rates and hurricane-related disruptions. While rent growth has moderated from record-high levels across other residential property types, MH revenue growth is poised to accelerate in 2023, driven by their under-appreciated inflation-linkage and Cost-of-Living-Adjustment effects. Nearly half of MH residents receive monthly Social Security benefits, which are poised to rise 8.7% beginning this month – the highest COLA increase in four decades – which will give MH REITs and senior housing REITs room to push rent growth.
Hoya Capital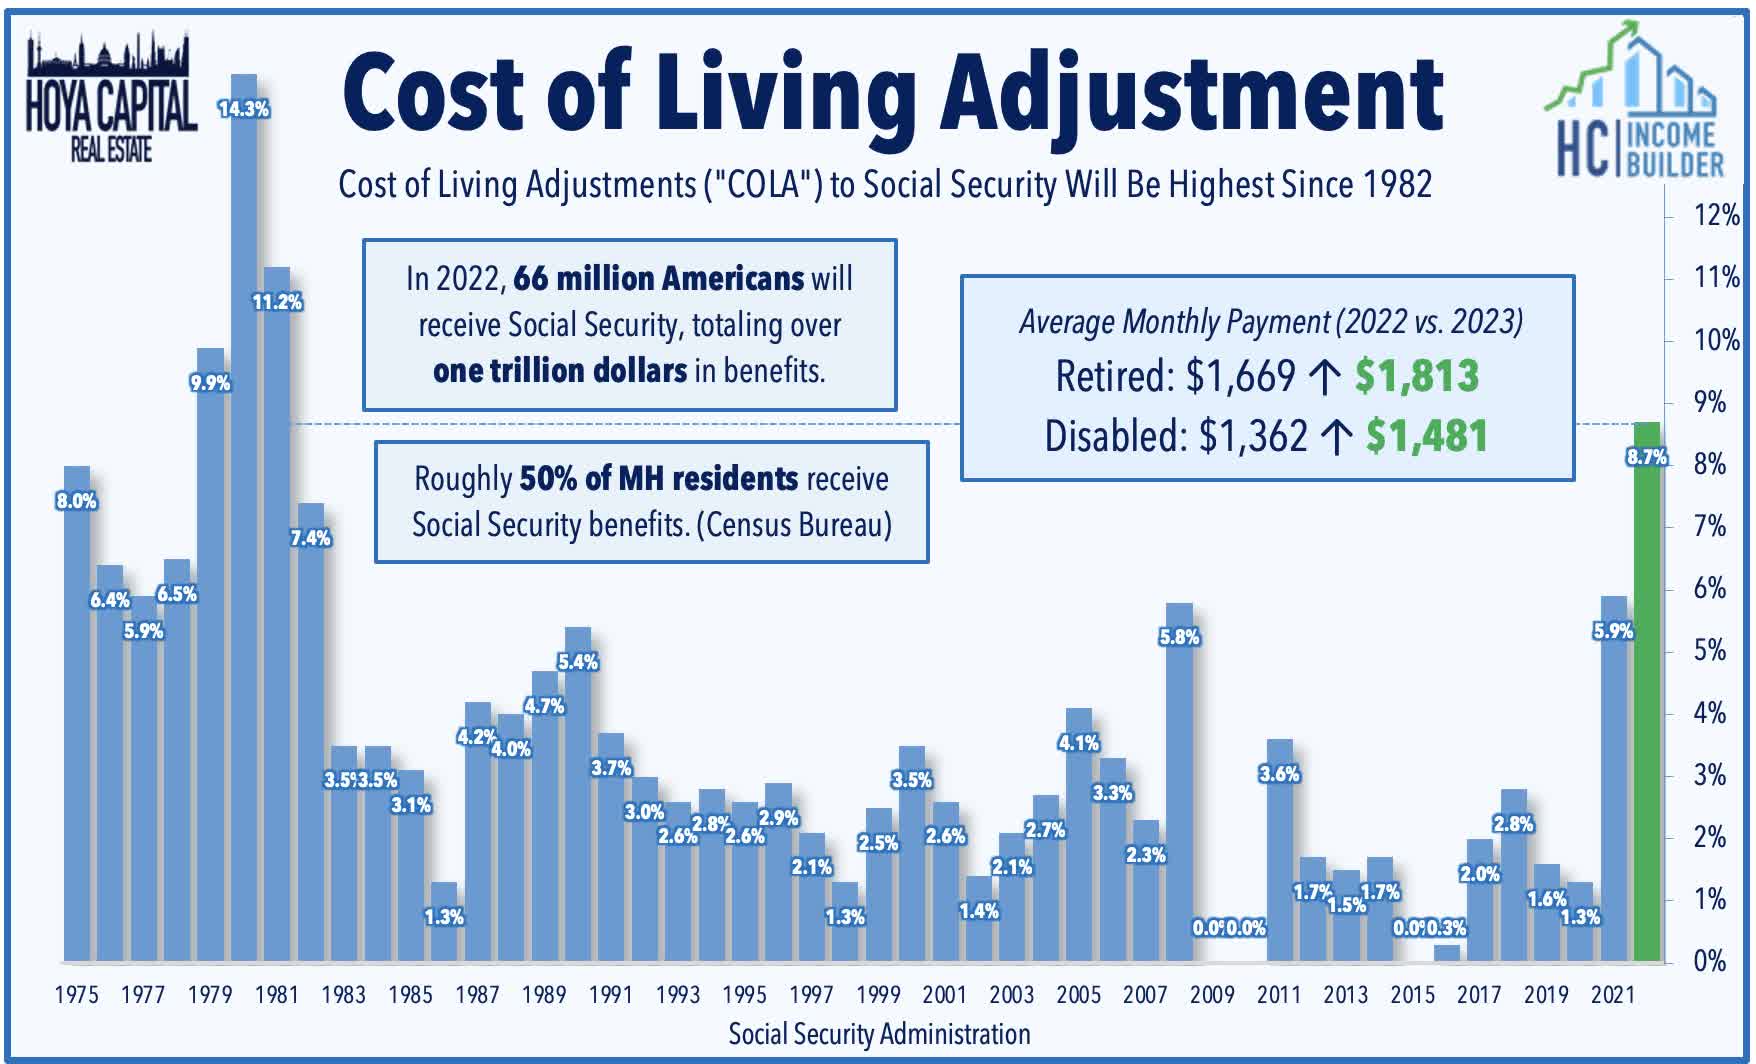
Hotel: Hotel REITs were among the leaders this week despite the FAA-related travel disruptions. DiamondRock (DRH) rallied 8% after reporting preliminary fourth-quarter operating metrics, noting that its Revenue Per Available Room (“RevPAR”) was 6.1% above the comparable pre-pandemic period in 2019. For the full-year, DHR recorded RevPAR growth of 5.0% above 2019-levels. Consistent with the trend seen across the hotel sector, DRH recorded very strong performance in its leisure-oriented Resort portfolio – which generated comparable RevPAR growth of 18% above pre-pandemic levels in Q4 – but its business-oriented Urban portfolio remained 2% below pre-pandemic RevPAR levels. Sotherly Hotels (SOHO) lagged after reporting that its RevPAR was 1.9% below comparable 2019-levels as a 13.3% increase in Average Daily Rates (“ADR”) was offset by a 13.4% decline in occupancy. Recent TSA data shows that passenger throughput finished the holiday season relatively strong and strengthened and into early 2023. Through the first two weeks of January, throughput levels are about 3% above pre-pandemic levels.
Hoya Capital
Strip Centers: Urban Edge (UE) surged nearly 6% after reporting very strong leasing trends in the fourth quarter, noting that it achieved blended rent spreads of 31% on a cash basis across 53 leases totaling 788,000 SF while its occupancy rate increased to 95.4% at year-end – a 110 basis point increase from the same period last year. This week, we published Strip Center REITs: Bargain Hunting which discussed how the combination of near-zero new development and positive net absorption since early 2021 has driven occupancy rates to record-highs and allowed Strip Center REITs to enjoy some long-awaited pricing power. Retailer Bed Bath & Beyond (BBBY) – which represents about 1% of shopping center REIT revenues – remained in focus this week after it announced cost-cutting and potential fundraising plans as it seeks to avoid bankruptcy. Most big box retailers and grocery brands remain in “growth mode” and have reportedly expressed interest in BBBY locations.
Hoya Capital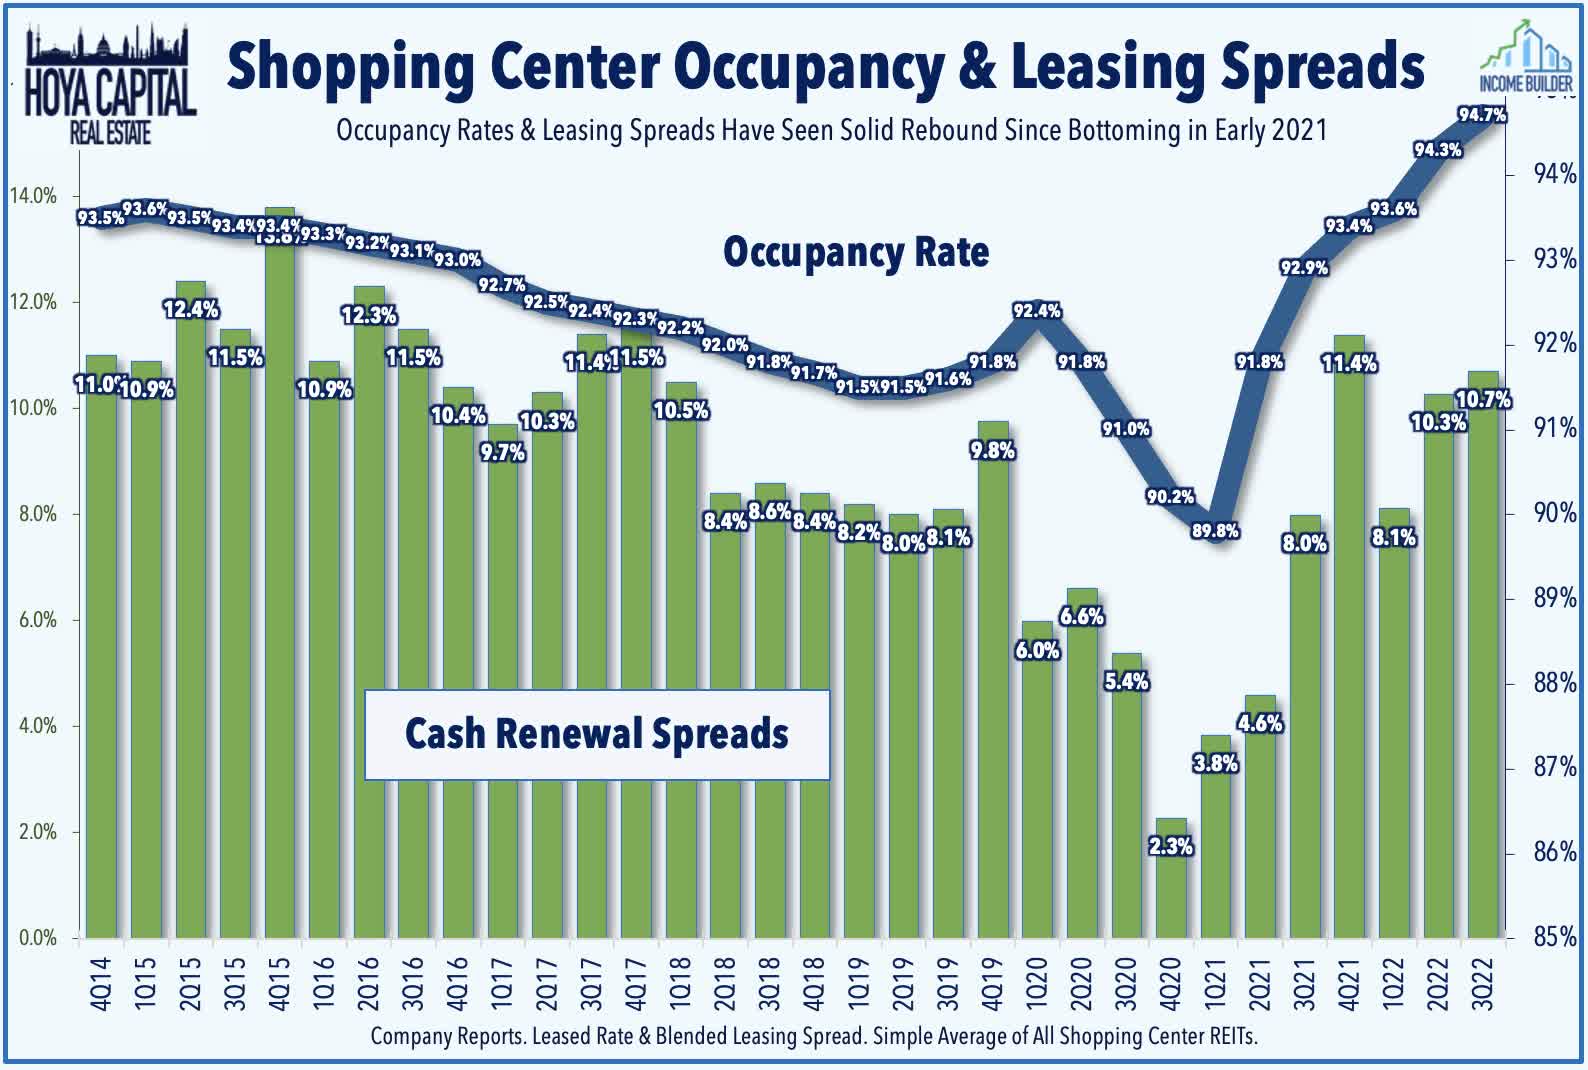
Casino: Another week, another major casino M&A deal. VICI Properties (VICI) – which we own in the REIT Dividend Growth Portfolio – gained 4% on the week after it announced a $201M deal to acquire four casinos in Canada from PURE Canadian Gaming at an 8.0% acquisition cap rate. The portfolio includes the PURE Casino Edmonton, Yellowhead, Calgary, and Lethbridge. The new master lease has an initial total annual rent of $16.1M and has an initial term of 25 years with four five-year tenant renewal options. For VICI, the transaction is expected to be immediately accretive to FFO upon closing. To replenish its coffers after a wave of acquisitions over the past two months, VICI launched an $870M secondary offering of common stock this week, pricing 26.35M shares of its common stock at $33/share.
Hoya Capital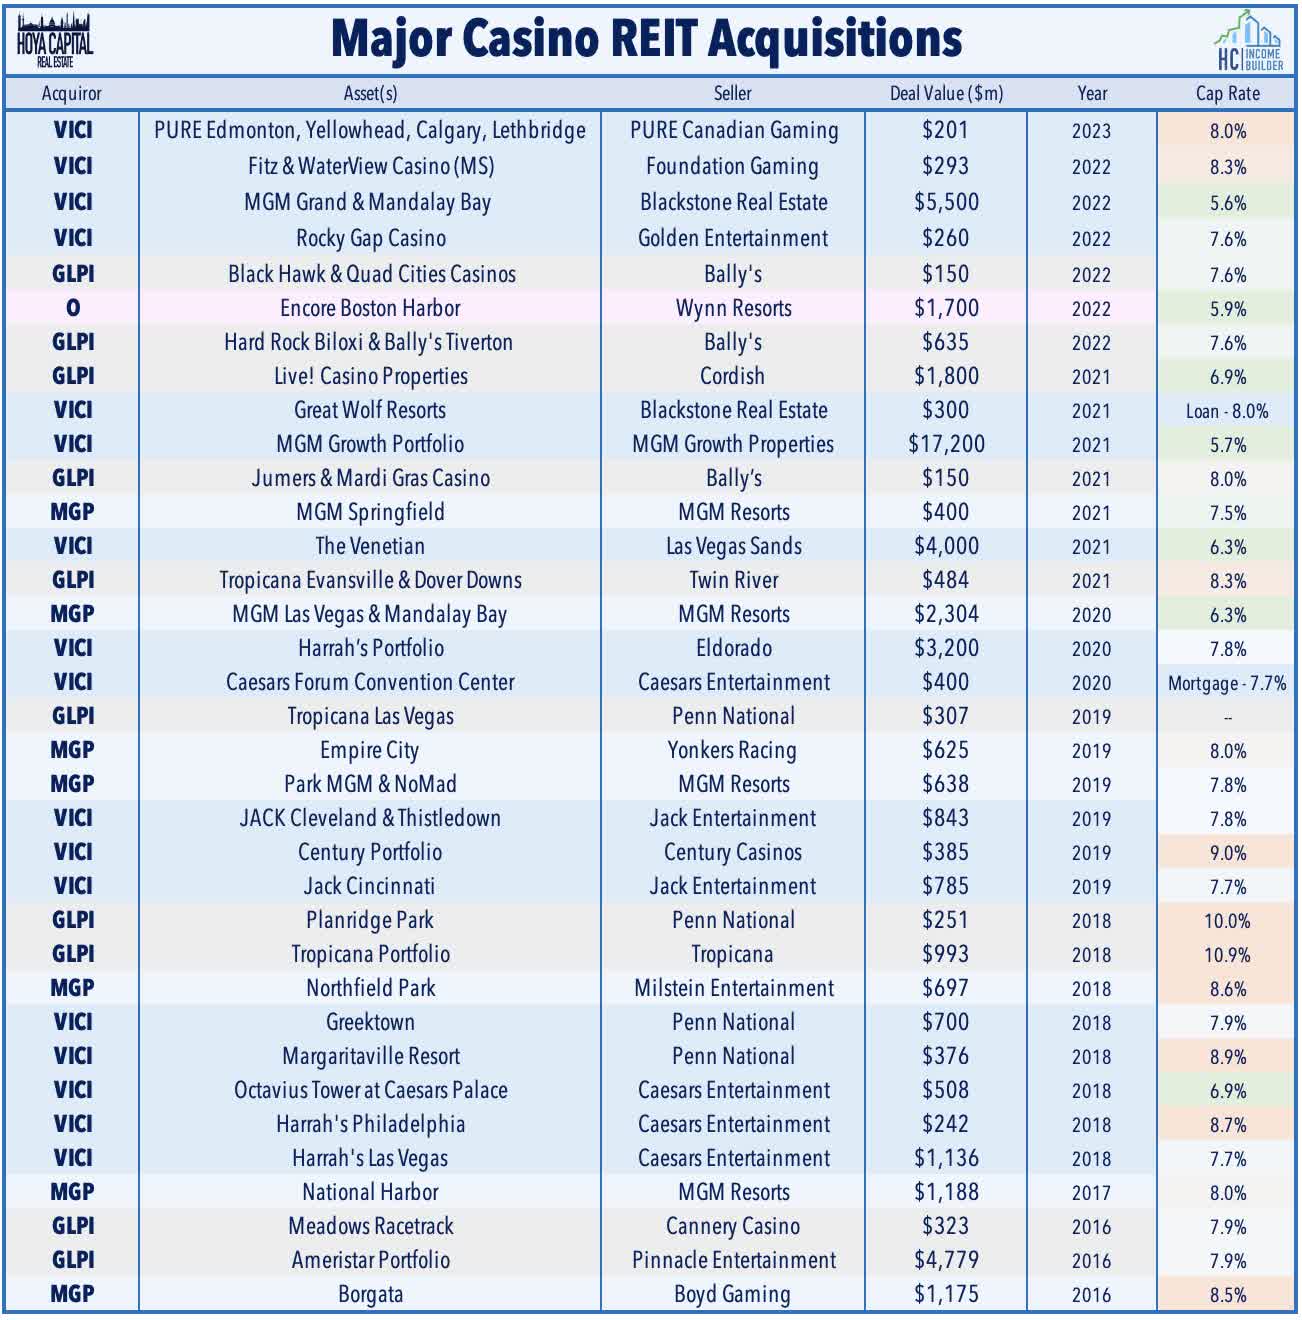
Office: Corporate Office (OFC) – which owns a portfolio of government properties leased to defense and information technology (“IT”) agencies in addition to a traditional DC-heavy office portfolio – rallied nearly 7% on the week after it announced that it acquired a 90% interest from Blackstone (BX) in five data center shell properties valued at $278M. The acquisition was executed through two separate transactions that closed in mid-December and early January. As a result, Corporate Office – also known as COPT – received ~$250M of proceeds, which it will use to fund the equity required for its development pipeline. With the closings, COPT doesn’t anticipate that it will need to raise any additional equity capital in 2023.
Hoya Capital
Relevant to the Blackstone discussion, Green Street Advisors published its Commercial Property Price Index for December which showed that private market commercial real estate values declined 13% in 2022 – erasing the gains during the pandemic now sit about 1% below pre-pandemic levels at the end of 2019. The figures are notable given the focus on the NAV estimates provided by Blackstone’s non-traded real estate platform – BREIT – which estimated that its Net Asset Value increased about 30% during that same period from December 2019 through November 2022. BREIT has come under SEC scrutiny after halting investor redemptions in late 2022, preventing investors from redeeming shares at this reported Net Asset Value.
Hoya Capital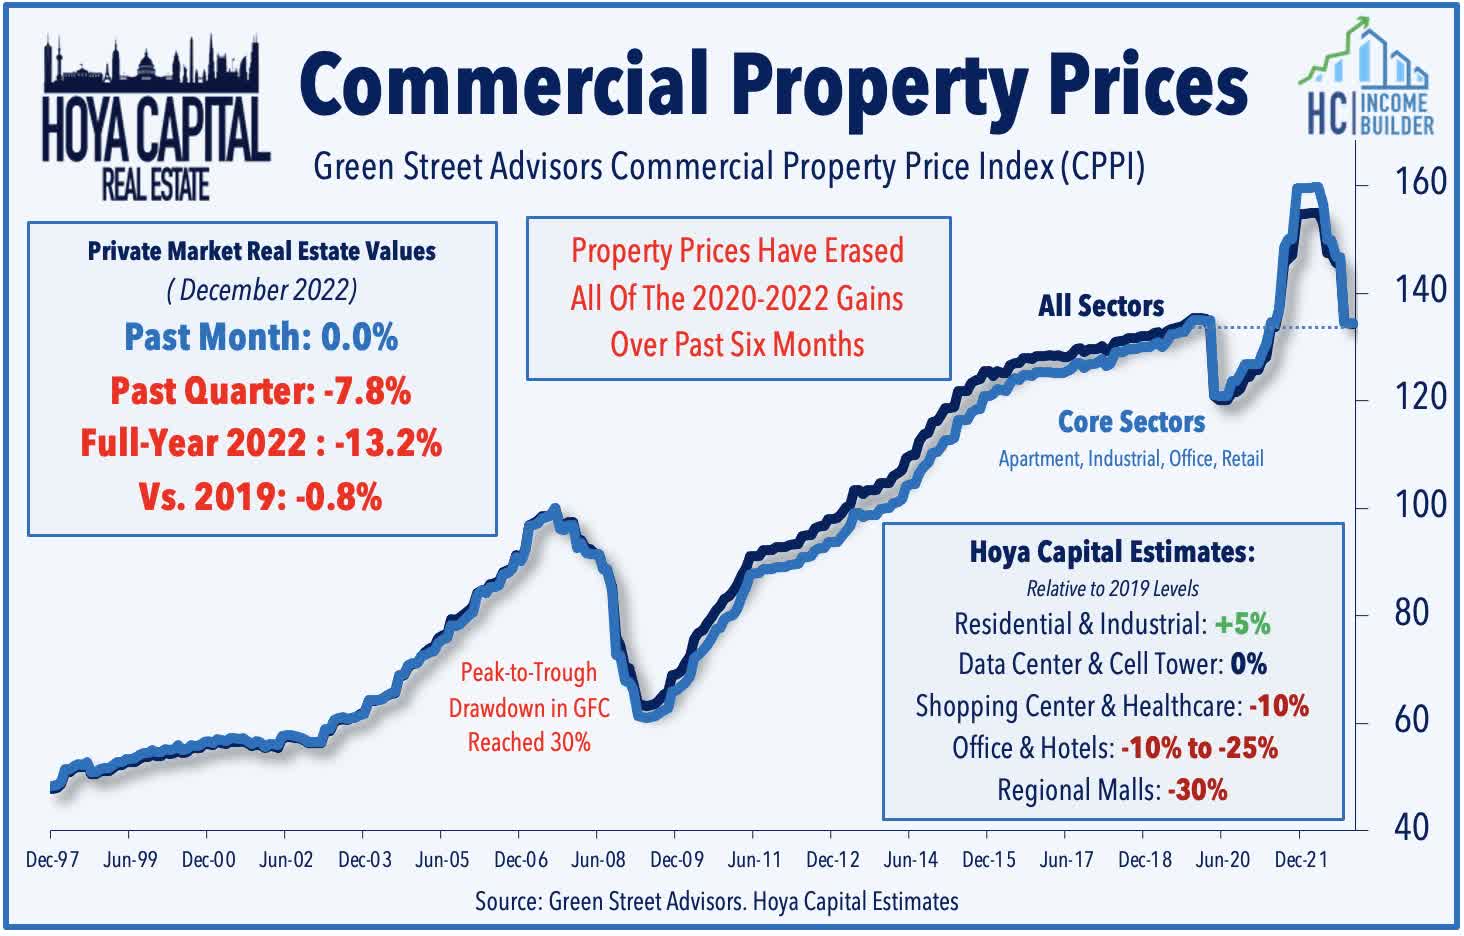
Industrial: STAG Industrial (STAG) – which we also own in REIT Focused Income Portfolio – rallied 4% this week after it hiked its monthly dividend by 1% to $0.1225/share. We saw a handful of business updates from industrial REITs throughout the week which indicated that demand remained resilient into year-end. Terreno (TRNO) rallied 7% this week after reporting that it achieved average rent spreads of 45.2% on new and renewed leases in Q4 and increased its occupancy by 20 basis points to 98.6%. Redford Industrial (REXR) advanced 5% flat after reporting that its rent spreads in Q4 were higher by 76.8% on a GAAP basis and 52.5% on a cash basis. INDUS Realty (INDT) lagged after reporting that its occupancy ticked down slightly to 98.8% in Q4 while commenting that it’s “actively evaluating the best path forward to maximize shareholder value” following its takeover proposal received in November from GIC Real Estate and Centerbridge.
Hoya Capital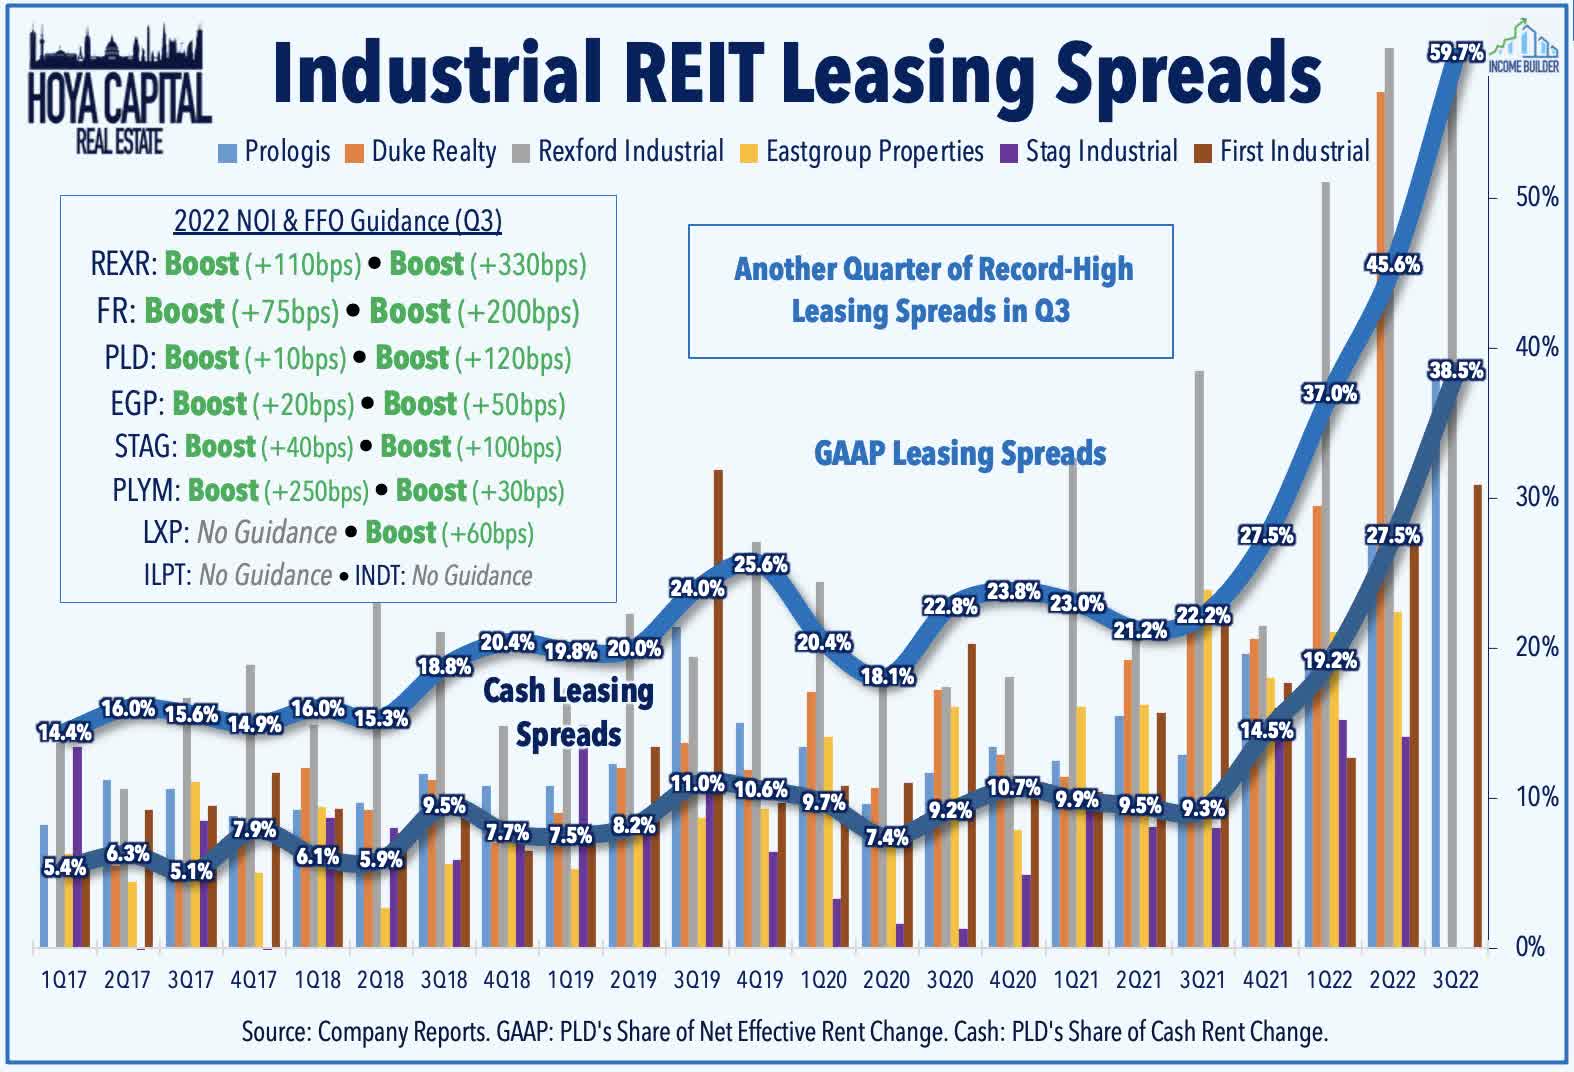
Net Lease: W. P. Carey (WPC) – which we own in the REIT Focused Income Portfolio – advanced 3% after it reported investment volume of $1.42 billion in full-year 2022 – at the low-end of its guidance range provided last quarter. Industrial and warehouse assets comprised approximately two-thirds of its 2022 investment volume. Gas station owner Getty Realty (GTY) advanced 2% after providing a business update that included its initial 2023 outlook which calls for a full-year FFO of $2.20/share, representing growth of about 4% in 2023 following FFO growth of nearly 8% in 2022. Broadstone (BNL) advanced 2% and provided a business update noting that it invested $310.3 million in 18 properties in the fourth quarter at an initial cap rate of 6.7%. Postal Realty (PSTL) provided an update on its portfolio noting that for full-year 2022, the company acquired 320 properties for approximately $123 million at a weighted average cap rate of approximately 6.8%.
Hoya Capital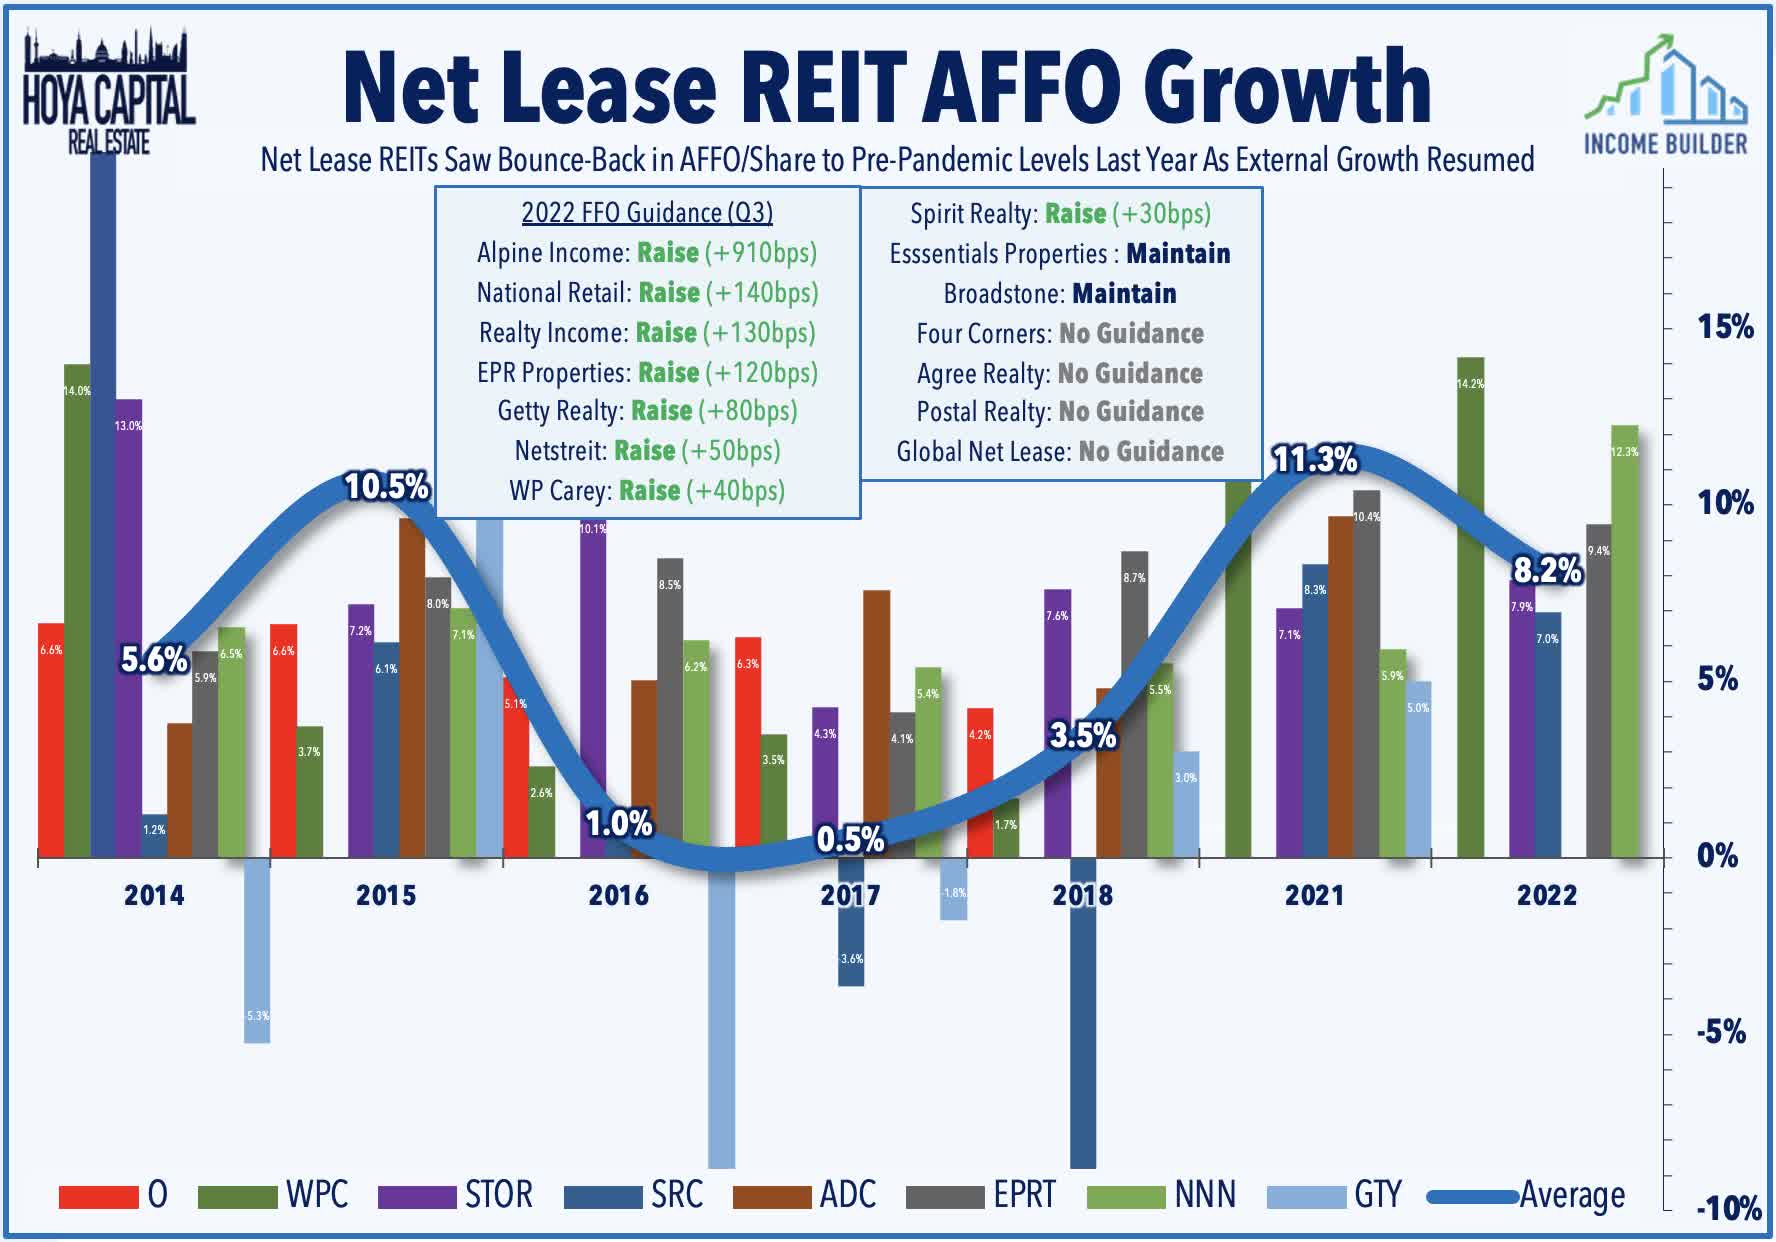
Sticking in the net lease sector, Gladstone Commercial (GOOD) slid 12% on the week after it announced that it will reduce its monthly dividend from $0.1254 to $0.10 per share – the first REIT dividend cut this year – “in an effort to increase retain capital in anticipation of further economic headwinds.” GOOD had been one of just a dozen REITs to deliver dividend increases in each of the pandemic years, hiking its annual payout by about 1% in 2020, 2021, and 2022. GOOD announced that its external advisor will waive its incentive fee for the first half of this year. Following a wave of over 125 REIT dividend increases in both 2021 and 2022, the REIT sector has been off to another strong start to 2023 with five dividend hikes through the first two weeks.
Hoya Capital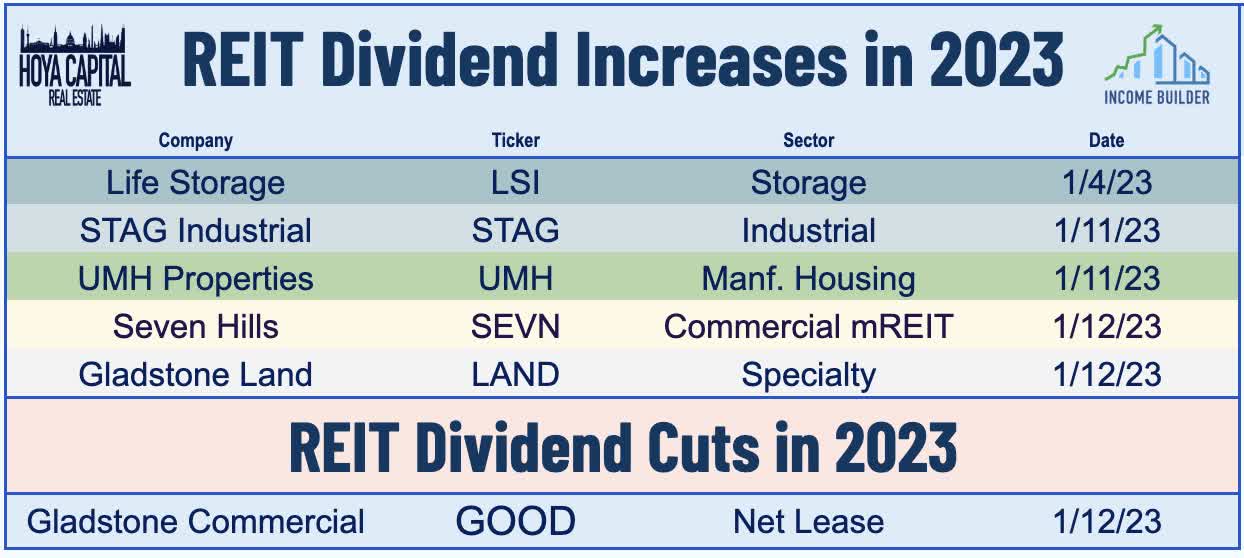
Healthcare: Also the downside this week, skilled nursing REIT Omega Healthcare (OHI) lagged this week after it announced in an investor presentation that it “expects both EBITDA and FAD to decline from 4Q22 to 1Q23” due to ongoing rent collection issues from several skilled nursing operator tenants. OHI reported that it collected 91% of its rent in October – up slightly from the third quarter in which it reported that operators representing 12% of its tenant base did not pay all of their contractual rent. OHI noted that “both our dividend payout ratio and our near-term leverage being higher than our historical range during this period of time.” Last week, the National Investment Center reported that skilled nursing occupancy rates recovered to 79.4% in Q4 – up 70 basis points from the prior quarter – but still 8.2 percentage points below the pre-pandemic level of 87.6%.
Hoya Capital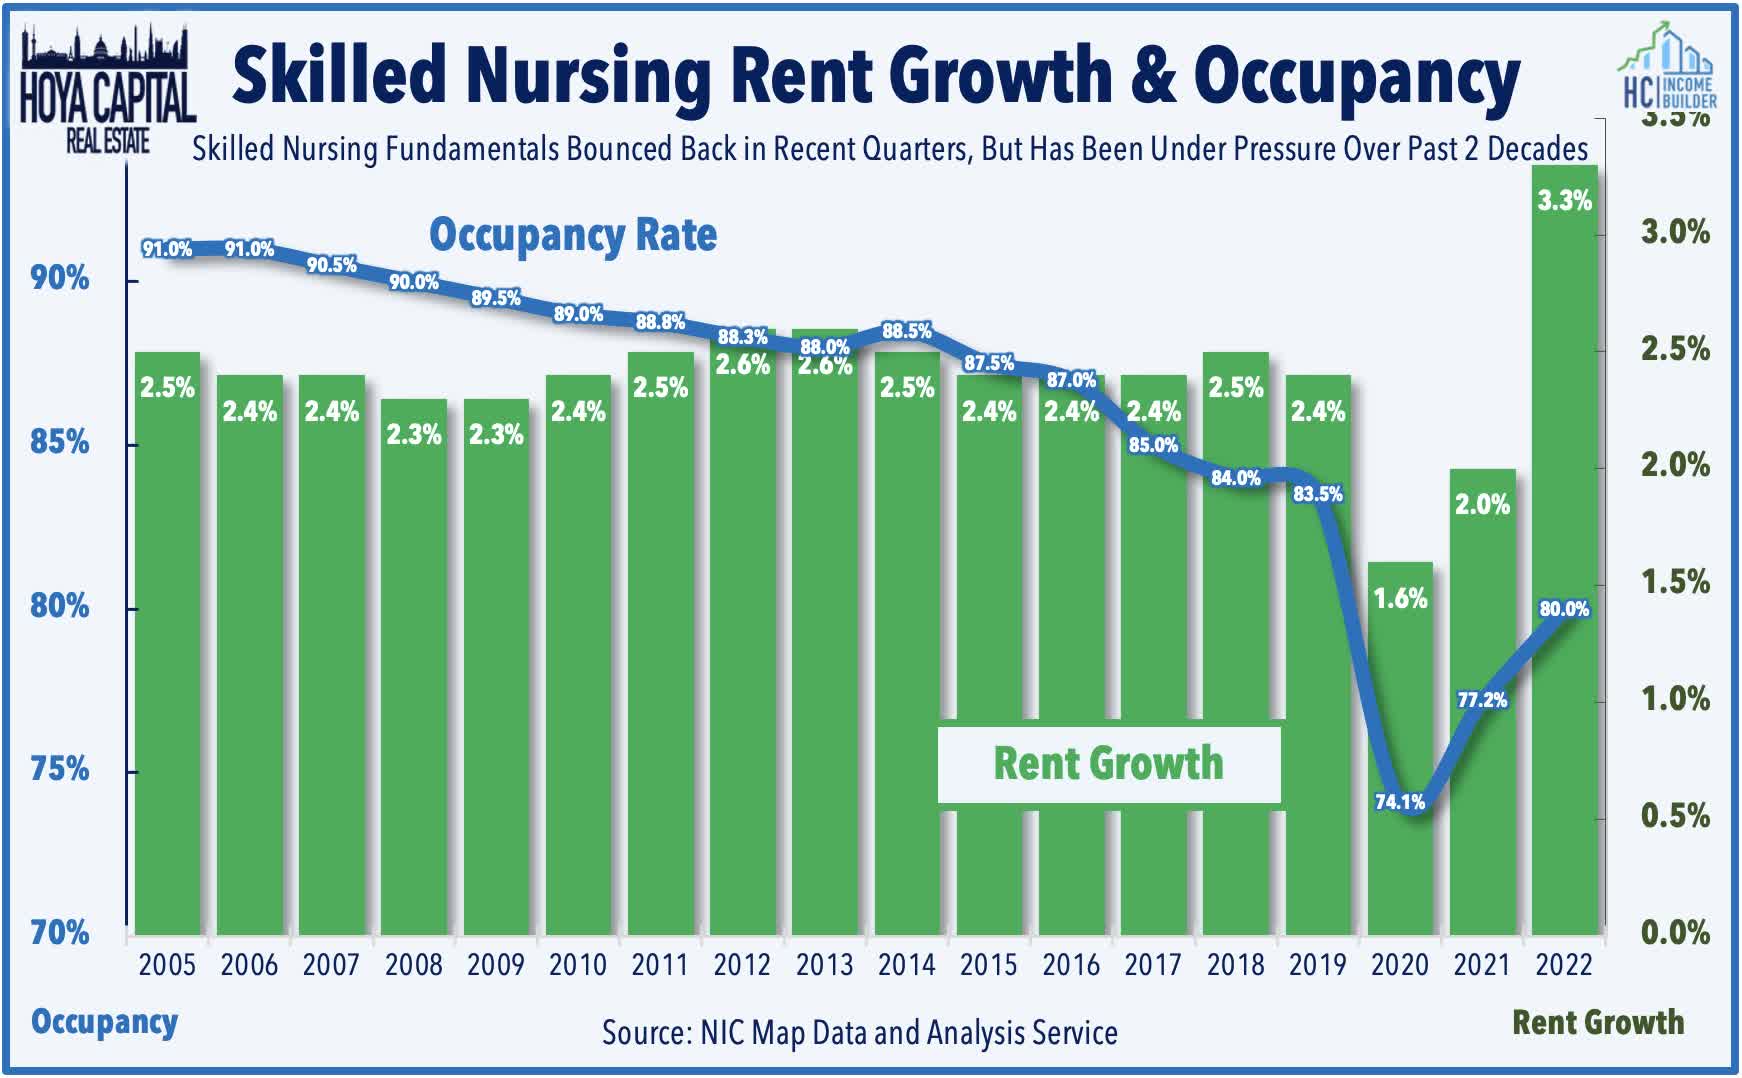
Mortgage REIT Week In Review
Mortgage REITs continued their very strong start to the year amid a broader bid for fixed-income securities with the iShares Mortgage Real Estate Capped ETF (REM) advancing 5.9% on the week, pushing its year-to-date gains to 11.5%. Seven Hills Realty (SEVN) surged more than 20% after boosting its quarterly dividend by 40% to $0.35/share, representing a forward dividend yield of 15.3%. Orchid Island (ORC) rallied nearly 9% on the week after reporting that its book value per share (“BVPS”) increased 4.5% during the fourth quarter to $11.93/share while holding its dividend steady. Ellington Residential (EARN) and Ellington Financial (EFC) each gained 5% after holding their dividends steady. Last month, we published Mortgage REITs: High Yields Are Fine, For Now, which noted that despite paying average dividend yields in the mid-teens, the majority of mREITs have been able to cover their dividends, but we flagged a handful of mREITs with payout ratios above 100% of EPS.
Hoya Capital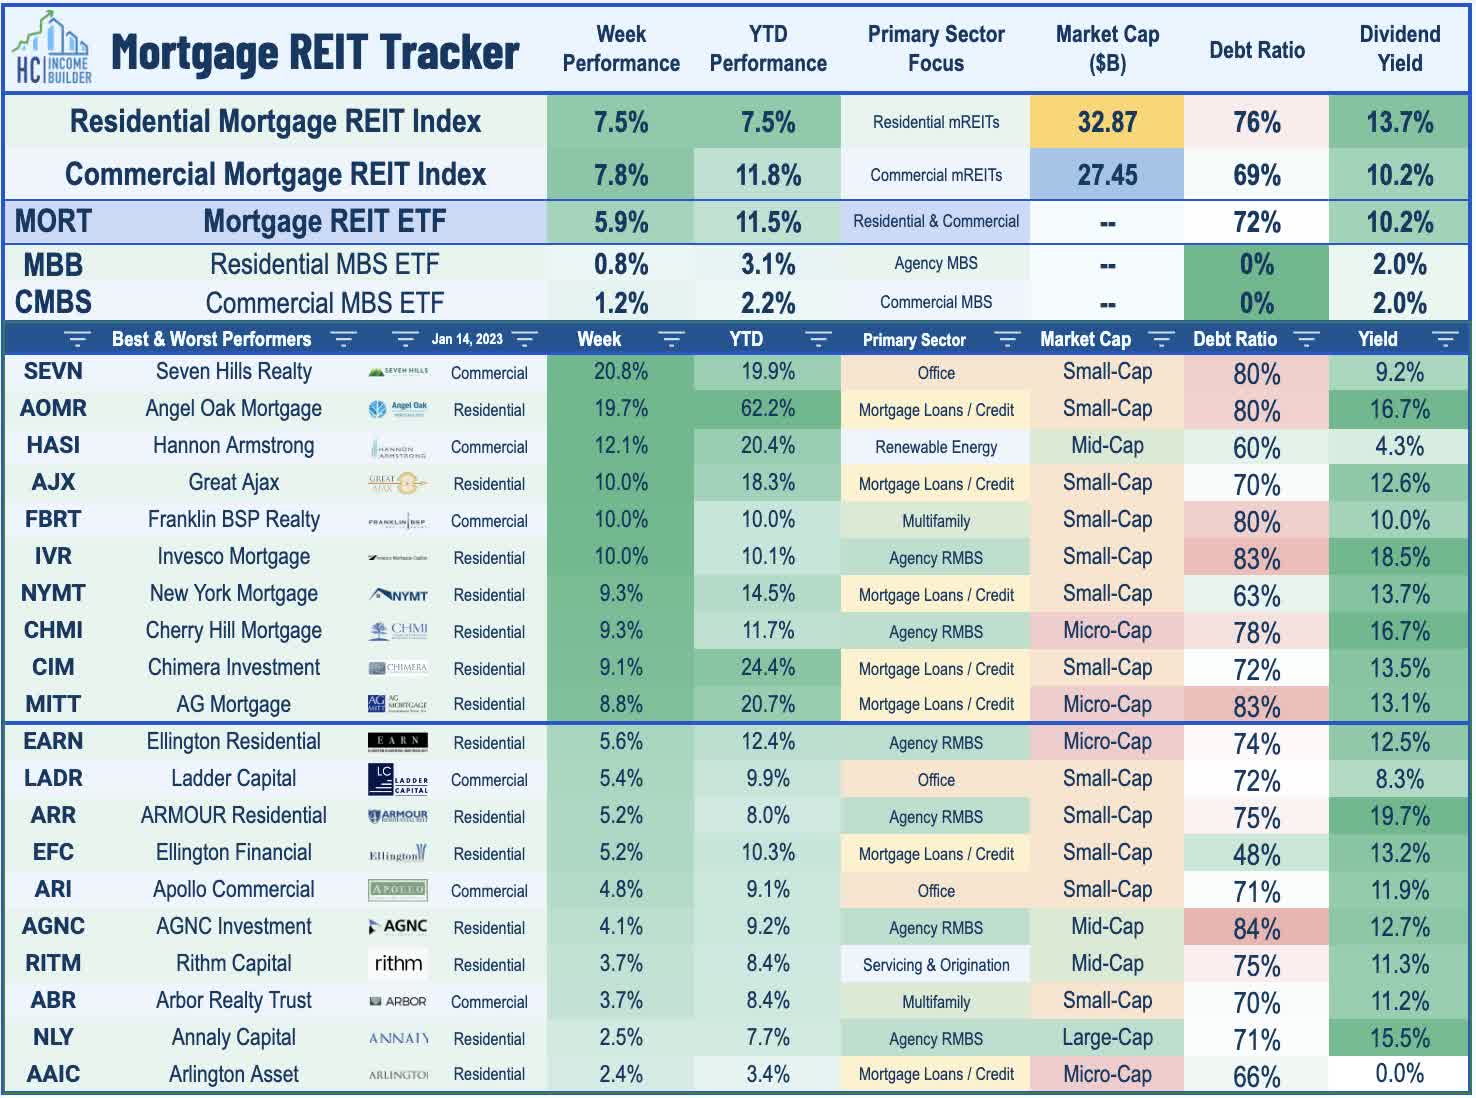
REIT Capital Raising & REIT Preferreds
Buoyed by the dip in benchmark interest rates, the REIT Preferred Index (PFFR) advanced 1.5% this week – pushing its two-week gains to over 8% – while the broader iShares Preferred and Income Securities ETF (PFF) advanced more than 1.9% on the week. Following a dearth of new REIT preferred issuance in 2022, Redwood Trust (RWT) launched a new $65M preferred issue this week, pricing 2.6M shares of 10.00% Series A Fixed-Rate Reset Cumulative Redeemable Preferred Stock which will trade on the NYSE under symbol “RWT PRA.” A handful of REITs have taken advantage of the recent pull-back in benchmark rates to tap into long-term debt markets including Crown Castle (CCI), which raised $1 billion of 5.00% senior notes due 2028. Realty Income (O) raised $1.1B in notes across two tranches priced from 4.85% to 5.05% while Healthpeak (PEAK) and Sun Communities (SUI) each priced $400M offerings at 5.25% and 5.70%, respectively.
Hoya Capital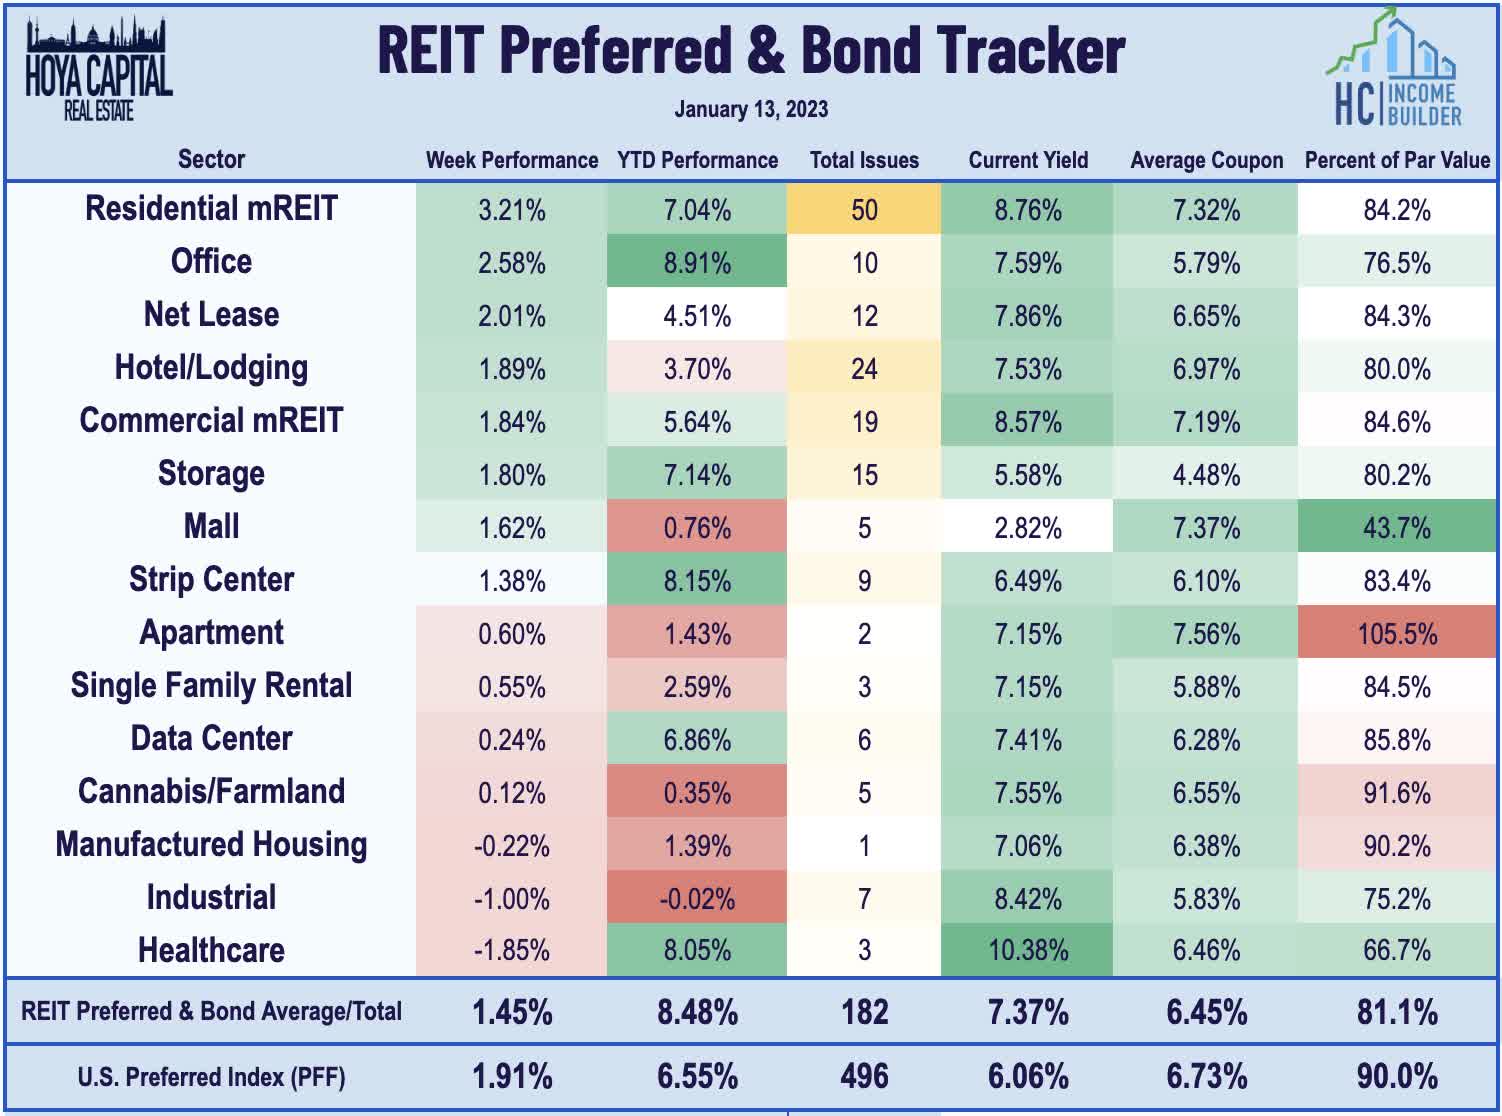
2022 Performance Recap & 2023 Check-Up
Good riddance, 2022. There were few places to hide across financial markets in a historically brutal year for investors that wiped out nearly a fifth of global financial wealth. The typically-steady US bond market delivered its worst year in history with a loss of 13.01% on the Bloomberg US Aggregate Bond Index, which is over 4x larger than the previous worst year back in 1994 (-2.9%). Closing at 3.88%, the 10-Year Treasury Yield surged 237 basis points from the start of the year. Among the ten major asset classes, Commodities (DJP) were the only segment to see positive inflation-adjusted returns for the year. After leading the charge last year, REITs finished in the basement of the performance tables among the ten major asset classes on a total return basis with declines of roughly 25%.
Hoya Capital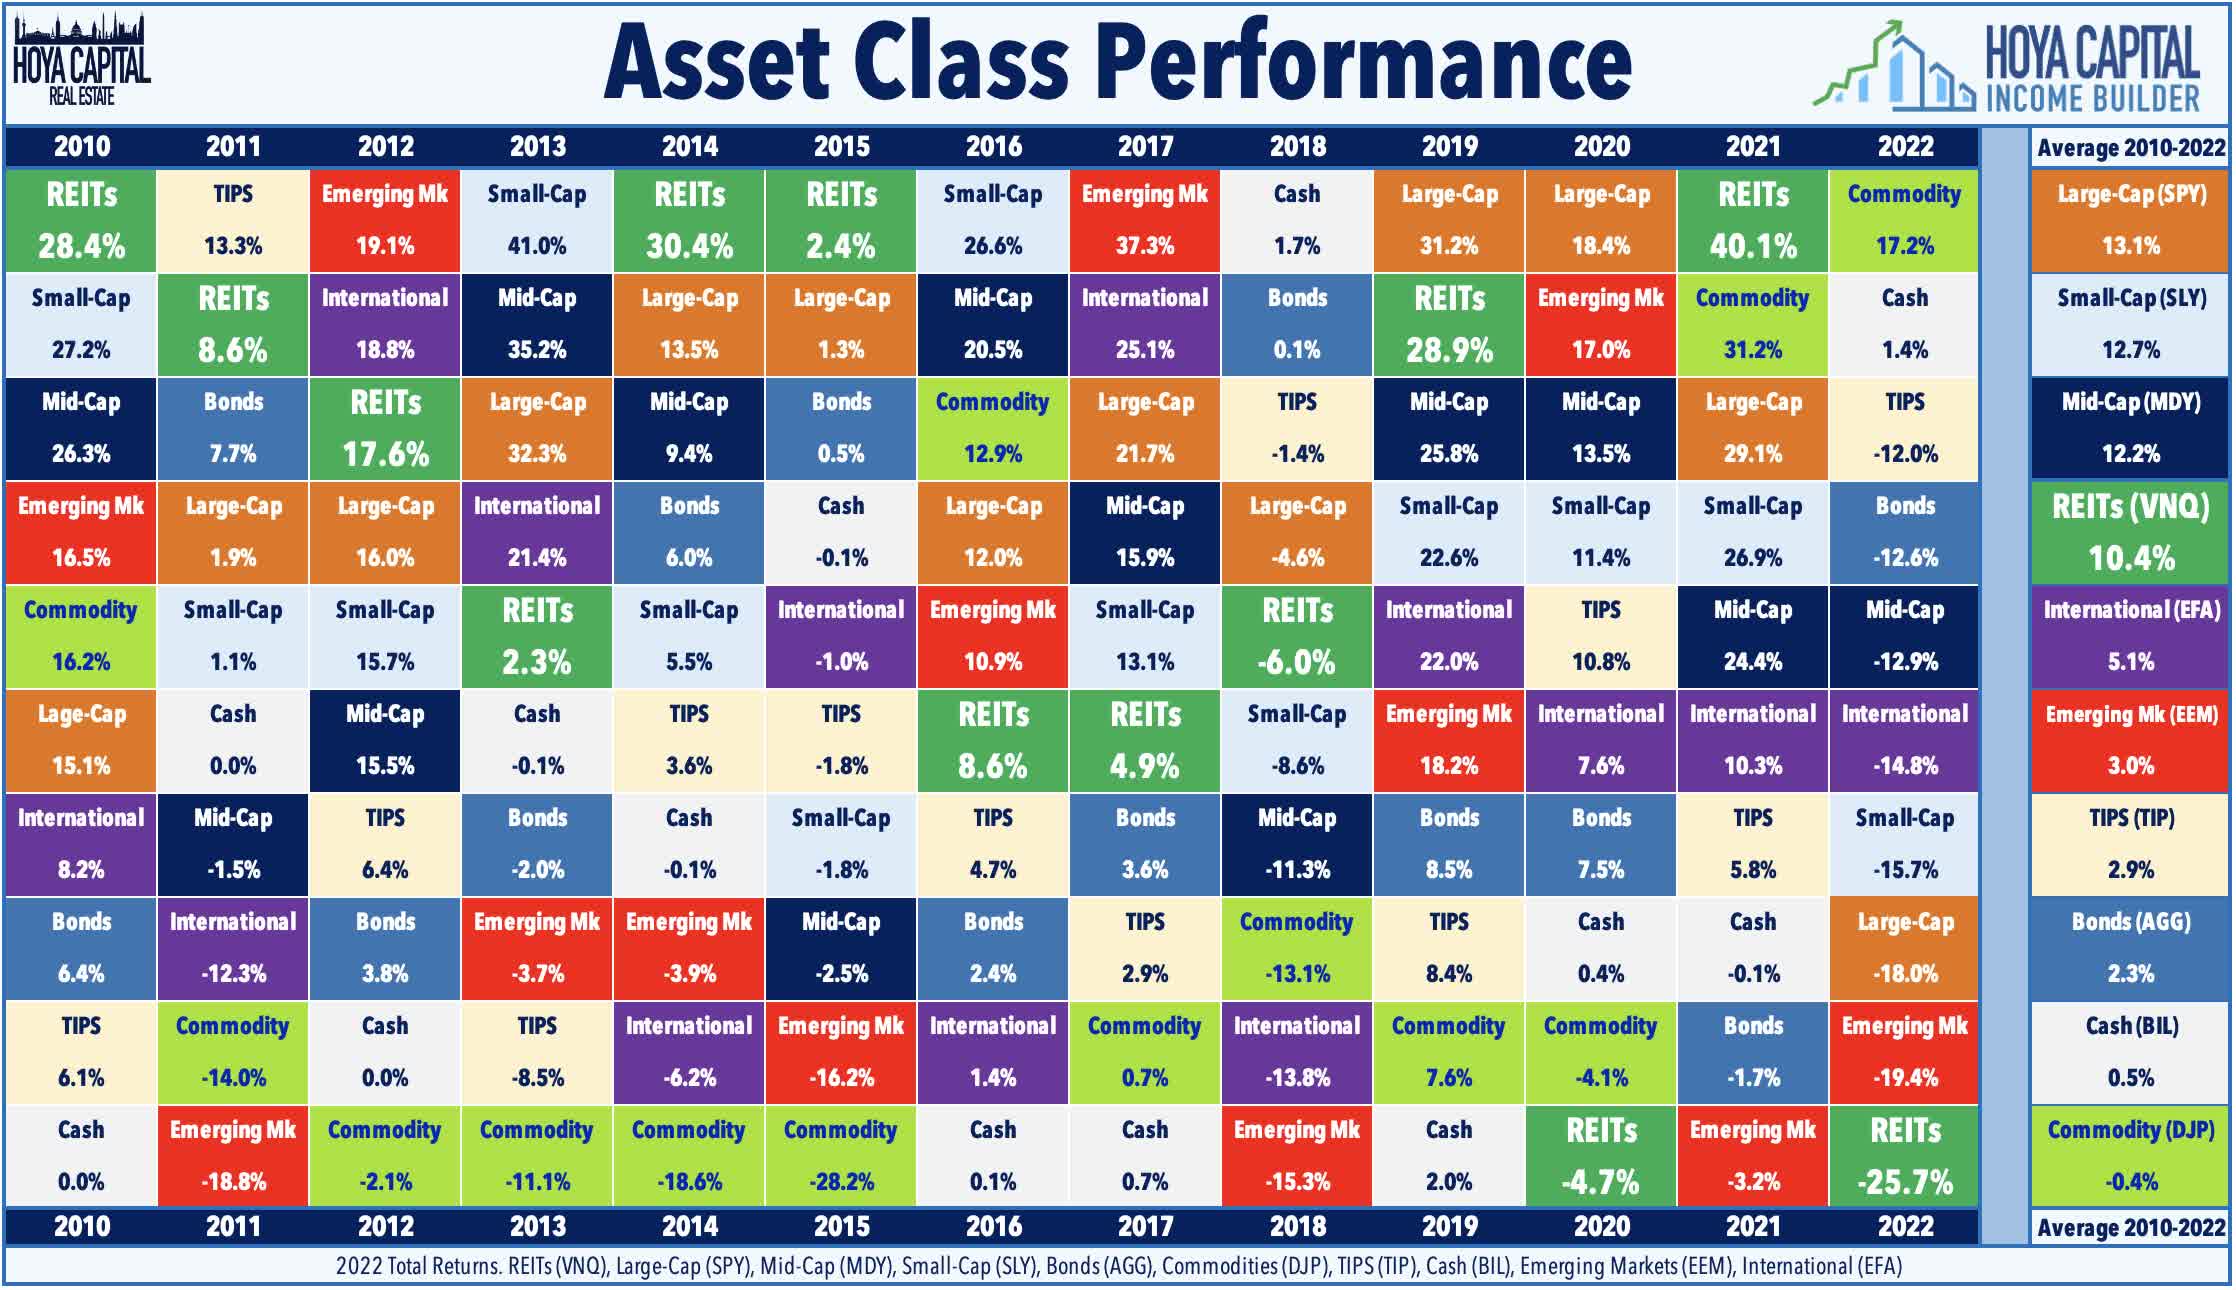
Through the first two weeks of 2023, the Equity REIT Index is higher by 6.9% on a price return basis for the year while the Mortgage REIT Index is higher by 11.5%. This compares with the 4.2% gain on the S&P 500 and the 6.3% advance on the S&P Mid-Cap 400. Within the real estate sector, all eighteen property sectors are in positive territory on the year led by Cell Tower, Billboard, and Cannabis REITs. At 3.48%, the 10-Year Treasury Yield has dipped 37 basis points since the start of the year – well below its 2022 highs of 4.30%. The US bond market has rebounded following its worst year in history as the US Aggregate Bond Index has gained 2.7% thus far in 2023.
Hoya Capital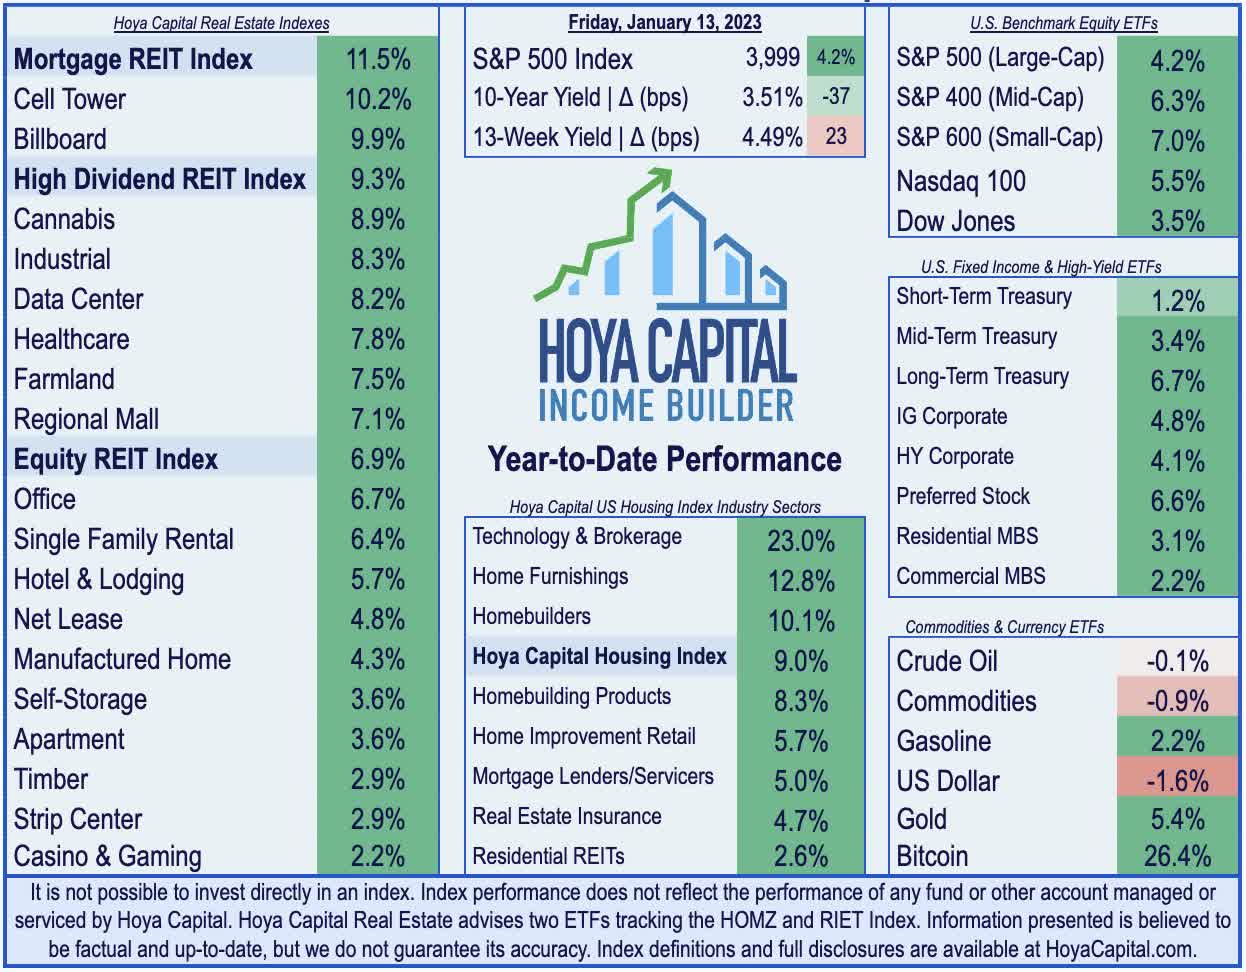
Economic Calendar In The Week Ahead
The state of the U.S. housing market is in the spotlight in another jam-packed week of economic data. Markets will be closed on Monday in observance of Martin Luther King Day. On Wednesday, we’ll see NAHB Homebuilder Sentiment data for January which is expected to remain at the lowest levels since 2014. On Thursday, we’ll see Housing Starts and Building Permits data which is expected to show a further pull-back in home construction activity to levels below that of late 2019. On Friday, Existing Home Sales data is expected to dip below a 4 million-unit annualized rate for the first time since August 2010 – which is currently the only month in the past quarter century with a sales rate below 4 million. Earlier in the week on Wednesday, we’ll see Retail Sales data for the critical December holiday period which is expected to show a slowdown from the prior month. We’ll also see inflation data via the Producer Price Index on Wednesday with the Core PPI expected to decline below 6.0% for the first time in eighteen months.
Hoya Capital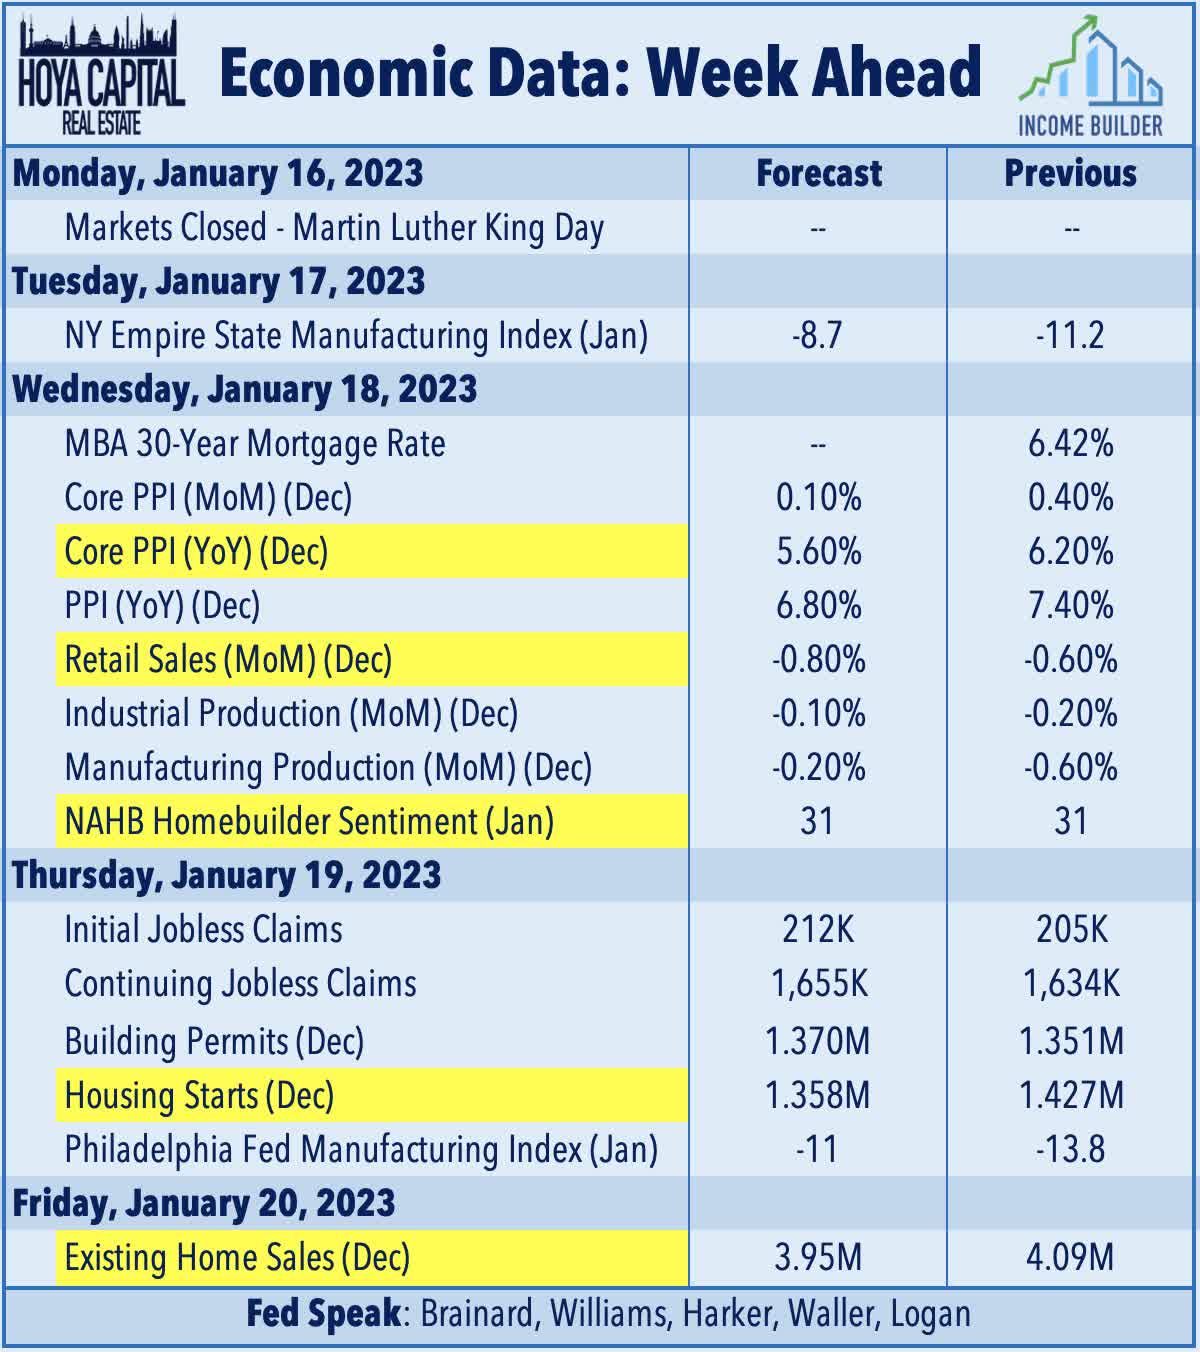
For an in-depth analysis of all real estate sectors, be sure to check out all of our quarterly reports: Apartments, Homebuilders, Manufactured Housing, Student Housing, Single-Family Rentals, Cell Towers, Casinos, Industrial, Data Center, Malls, Healthcare, Net Lease, Shopping Centers, Hotels, Billboards, Office, Farmland, Storage, Timber, Mortgage, and Cannabis.
Disclosure: Hoya Capital Real Estate advises two Exchange-Traded Funds listed on the NYSE. In addition to any long positions listed below, Hoya Capital is long all components in the Hoya Capital Housing 100 Index and in the Hoya Capital High Dividend Yield Index. Index definitions and a complete list of holdings are available on our website.
Hoya Capital
Editor’s Note: This article covers one or more microcap stocks. Please be aware of the risks associated with these stocks.
Be the first to comment