Svetlana Belozerova/iStock via Getty Images
The markets are up. The markets are down.
Analysts are predicting a bottom to the bear market. Analysts are predicting we have a lot further to go.
There’s a reason to be optimistic. There’s a reason to be pessimistic.
Really, Charles Dickens might have been thinking forward – far, far forward – when he wrote the introductory lines to A Tale of Two Cities.
“It was the best of times, it was the worst of times.
It was the age of wisdom, it was the age of foolishness.
It was the epoch of belief, it was the epoch of incredulity.
It was the season of light, it was the season of darkness.
It was the spring of hope, it was the winter of despair.”
It all depends on one’s perspective, I suppose.
I think that, for the most, though, people’s perspective – even among many experts – is one of sheer perplexment. That’s why, along with the more definitive headlines you can find making their rounds, there’s a whole lot of question marks circulating.
- Is the bear market over yet?
- Can crypto fall further?
- What will today bring?
Those are all titles I just made up on the spot, but they’re based on actual analytical commentary I’ve been seeing. Because, as I’ve said across multiple platforms by now…
Confusion seems to be the name of the game.
We Don’t Want to Take Chances Right Now
Due to current confusion, I hope we can agree this isn’t the time to play games with our money.
Really, we should always be extremely hesitant to do any such thing. But that should be especially true when we have to cope with the following facts and figures. These were captured in a June 29 Fox Business article titled “S&P 500 Heads to Worst First Half Since 1970s.”
Its subhead is “Consumer inflation rose 8.6% in May, a fresh 40-year high,” which it immediately reiterates in the article itself:
“Stocks are about to turn in the worst first half in [50] years when the second quarter wraps on Thursday as inflation sits at a 40-year high.
“The S&P 500, the broadest measure of stocks, is down nearly 18% this year: the worst since 1970, as tracked by Dow Jones Market Data Group. That makes 2022 the fifth-worst half-performance on record.
“Stocks are falling as the possibility of a recession rises.
“‘I think there is a very real risk of a recession. It is perhaps inevitable we do have an economic downturn before 2024,’ said John Lonski, president of economic forecasting firm Thru the Cycle.”
Or take Yahoo Finance’s Morning Brief, “Consumer Fears May Make a Recession ‘Self-Fulfilling’.” It noted how:
“On Tuesday, the Conference Board reported its reading on consumer confidence fell to 98.7 in June. A measure of future expectations, meanwhile, declined to the lowest level in nearly a decade.
“‘Consumers’ grimmer outlook was driven by increasing concerns about inflation, in particular rising gas and food prices,’ said Lynn Franco, senior director of economic indicators at The Conference Board.”
According to her, there’s a “growing risk of recession” by the end of the year.
When You Just Don’t Know, Credit-Worthiness Counts
Now, admittedly, some people are saying we’ll avoid a recession still. And not just Treasury Secretary Janet Yellen.
MoneyWise recently quoted fund manager legend Rick Rule as scoffing at the Federal Reserve:
“‘I think they’ll chicken out,’ he told Stansberry Research earlier this month.
“‘If we had a period of real interest rates, it would certainly cure inflation. But it wouldn’t cure inflation until it did amazing damage to various balance sheets.”
If the Fed does pull its punches, we might get out of this economically unscathed. (Other than inflation and stock losses, that is.)
Even Tesla (TSLA) CEO Elon Musk – who is taking active and obvious steps to position his company for a downturn – will only commit to saying a recession is “more likely than not,” last I heard.
So who knows.
As I’ve said before, I do believe we’ll have one… but only of the “garden variety.” I don’t expect us to experience another 2008 or 2020 crash-and-burn kind of collapse.
Still, even if that is the case, I want to exert caution. For that matter, knowing I could be wrong, and it could be worse, I want to exert caution. And even knowing I could be wrong, and it could be better, I want to exert caution.
This is one of those times where I’m going to repeat what I’ve said many a time before: that I don’t have a crystal ball. And neither do you.
Nobody does.
That’s why I’m looking for real estate investment trusts (REITs) with the best credit ratings trading for the best margin of safety…
And why I think you should be, too.
They’re the ones that tend to hold up no matter what. Which is exactly what we always want to be prepared for.
Now let’s get the party started…
Best Credit, Best Value REIT #1 – Realty Income
When it comes to high-quality REITs with strong credit ratings, there are few if any better than Realty Income Corporation (O).
O’s been the gold standard for many years and a blueprint for new REITs, particularly in the net-lease space. It’s also a fan favorite amongst not only REIT investors, but dividend investors alike.
It’s not just the company’s monthly dividend, either, that draws them. That’s a great perk, but its stability is even better.
Really, this REIT is about as steady as they go. Regardless of the economic backdrop or the Fed’s current monetary policy, Realty Income performs.
Looking back at the 2008/2009 recession – which started in December 2007 officially – Realty Income did fall with the greater market. But it had crossed back into positive territory by July 2009.
The broader S&P 500 index, meanwhile, was still down 30%.
(Yahoo Finance)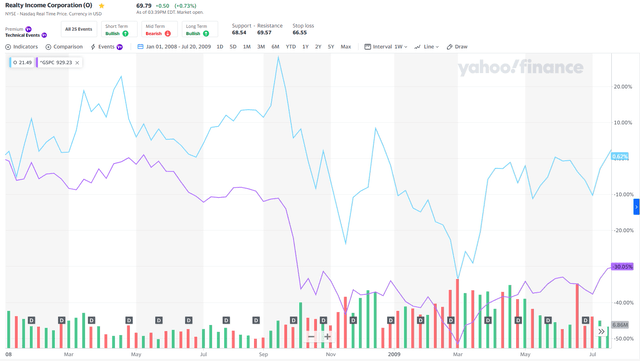
That wasn’t luck. Realty Income’s management team has built a strong portfolio of properties that are leased out to investment-grade tenants.
In fact, a full 43% of the company’s rent comes from such lessees.
(Realty Income Q1 Investor Presentation)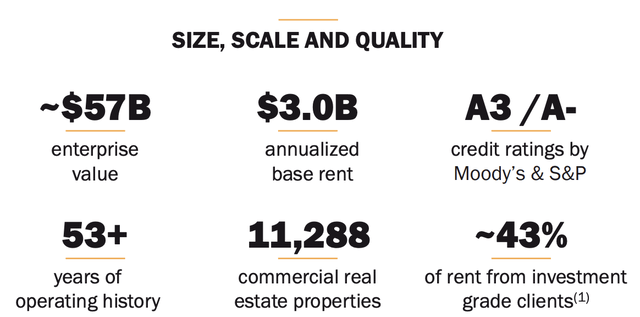
As you can see from the slide above, the company has been in operation for over 50 years now. And it’s accumulated $3 billion in annualized base rent from its portfolio of nearly 11,300 properties.
Its portfolio is well diversified, with roughly 94% of total rent coming from tenants that are resilient to economic slowdowns and/or e-commerce threats.
(Realty Income Q1 Investor Presentation)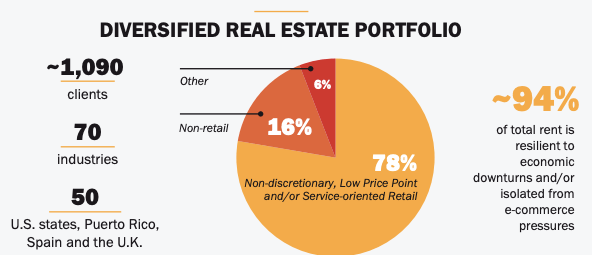
Realty Income Continued
Realty Income is what I consider to be an all-around impressive REIT. Again, it can perform well regardless of what the Fed is doing and regardless of the economic backdrop.
But it goes so much further than that.
One of the biggest things that separates Realty Income from the net-lease pack is its A- credit rating. It’s one of just seven U.S. REITs with two A3/A- credit ratings or better.
The company has maintained its fortress balance sheet into 2022 with a net debt to annualized adjusted earnings before interest, taxes, depreciation, amortization, and restructuring or rent costs (EBITDAR) of 5.4x. That’s allowed it to utilize a low cost of capital, which has helped it assemble the high-quality portfolio it has.
(Realty Income Q1 Investor Presentation)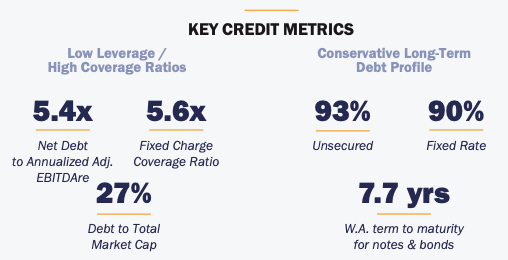
Looking at the FAST Graphs chart below, you can see analysts expect O to generate adjusted funds from operations (AFFO) of $4.02 next year. This calculates to a forward P/AFFO of 17.2x.
Over the past five years, it’s traded at an average AFFO of 19.8x, as per the blue line below.
(FAST Graphs)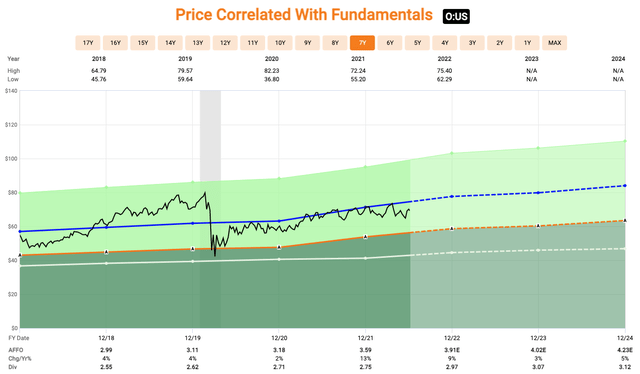
The company appears to be trading at a reasonable valuation with plenty of upside. Plus, you get a strong management team, a diversified portfolio leased to investment-grade tenants, and – again – one of the strongest balance sheets in the industry.
Best Credit, Best Value REIT #2 – Simon Property Group
Next up is Simon Property Group, Inc. (SPG), a company led by David Simon, whose father and uncle founded the company over 50 years ago.
SPG is another leader in its respective space. Though while Realty Income has a lot of competition within its net-lease subsector…
Simon is the unquestioned leader within the mall REIT space.
Of course, owning malls hasn’t played out well in the public markets in 2022. On the year, SPG is down a staggering 40%.
(YCharts)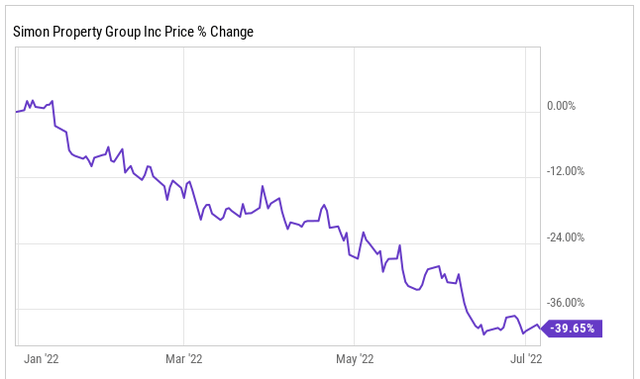
Many of the concerns around the stock are focused on the pending recession. After all, if the economy falls, consumers tend to spend less. And if they spend less, it will impact Simon’s tenants, even causing vacancies.
Is a drop like that warranted here? Let’s see…
For Q1, the company reported revenue up 4.5%, operating income up 2.5%, and funds from operations (FFO) up 12.1% year-over-year.
So, no. I’m not seeing why the 40% drop would be warranted from those numbers.
Of course, the stock market is a forward-looking investment tool. So the “what have you done for me lately” rhetoric may not work here.
Are companies looking to lower their exposure to malls based on what we know about the economy going forward?
Once again in Q1, management said “the number of tenant terminations… were the lowest recorded in the last five years.” In fact, occupancy levels ticked higher to 97%. And Simon had a high number of new leases that were recently signed.
Management even raised its 2022 FFO guidance from $11.50-$11.70 to $11.60-$11.75 – and its dividend by an astounding 21.4% over the prior year.
A management team showing improving results, increasing guidance, AND a huge dividend raise isn’t one that seems too concerned about the economic downturn.
Simon Property Group Continued
As Simon currently trades, you could earn a 7% dividend yield right off the bat.
That’s not a trap, either. The current dividend is more than covered by FFO.
Here’s a chart that was included in Simon’s Q1 supplemental. It shows the strength of the dividend based on its low payout ratio.
(SPG Q1 Presentation)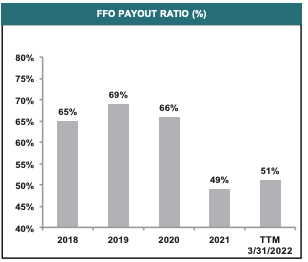
Also, like Realty Income, Simon Property Group is one of seven U.S. REITs with two A-/A3 or greater credit ratings.
(SPG Q1 Presentation)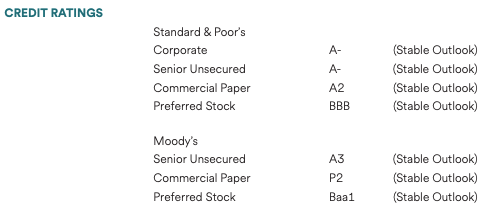
The company was able to lean on that fortress balance sheet to guide it through the pandemic. It amended and extended its $3.5 billion revolving credit facility during that time. And it lowered its average interest rate through refinancing as well.
As you can see below, Simon’s weighted average interest rate has been falling since 2018.
(SPG Q1 Presentation)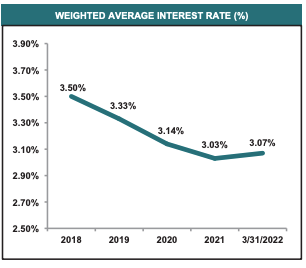
No matter how I look at it, I can’t conclude anything other than it really is one of the best REITs to own. And while the company would likely get impacted if a true recession comes to fruition, it’s a survivor.
I have no doubt it will come out ahead on the other side.
(FAST Graphs)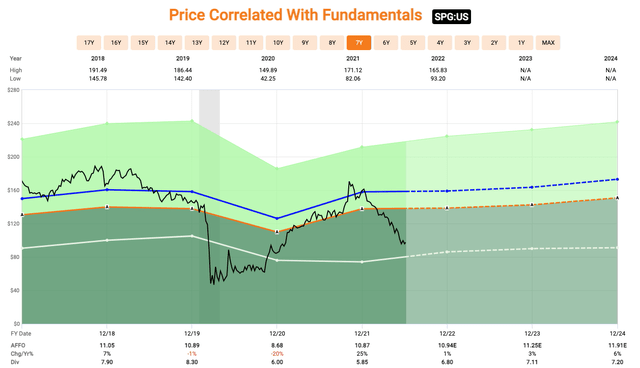
Over the past five years, shares of SPG have traded at an AFFO multiple of 14.5x. Yet today, you can buy shares for less than 9x.
That is a sale I do not want to miss.
Best Credit, Best Value REIT #3 – Prologis
Our final creditworthy REIT today is Prologis, Inc. (PLD). And, yet again, we’re looking at a leader here.
PLD is the premiere industrial REIT on the market today as well as one of the largest REITs on the market. Industrial and warehouse space has been a booming sector for landlords as retailers transition to e-commerce.
PLD has reaped those benefits, as evidenced by the tear its shares were on after their pandemic lows in 2020. From that $60s-level low, it skyrocketed to over $170 a few months back in April 2022.
Now, retailers do have to walk a fine line between having some excess inventory and too much. That’s why shares have since fallen nearly 30% over the past 2.5 months, as I’ll explain below.
(YCharts)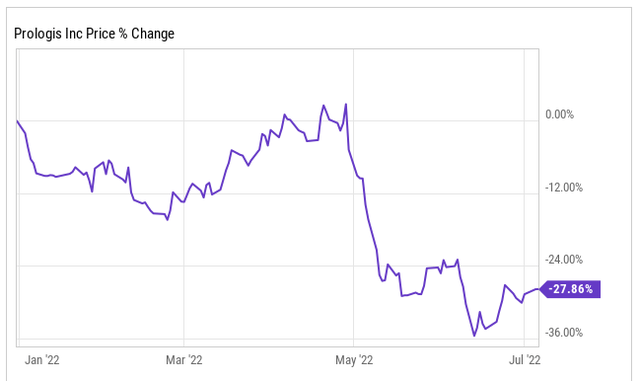
You see, Amazon (AMZN) is PLD’s largest tenant. And earlier this year, it announced that it had too much industrial space right now. As such, it added, it would be sub-leasing roughly 30 million square feet of space.
This sent shares of PLD spiraling. Which is at least somewhat understandable.
But looking at the greater context of that commentary, Amazon management was making a statement at a point in time. Plus, it clearly wanted to shed some of its older, more traditional warehouse assets in order to bring online newer and more strategically placed warehouses.
In fact, just last month, we learned that the e-commerce giant is having PLD build a brand-new facility in Northern California.
So how much is there really to fear?
Prologis Continued
Prologis also recently agreed to buy industrial competitor Duke Realty (DRE) for $26 billion. So its position as global leader in this space isn’t going anywhere any time soon.
Currently, the company’s portfolio consists of 4,675 buildings with 1 billion square feet of leasable space. Those are leased out to roughly 5,800 customers worldwide.
Most of that’s located in North America, with 81% of net operating income (NOI) coming from it. But Prologis also has a strong footprint in Europe, with 11% of NOI coming from there at last check.
(PLD Q1 Investor Presentation)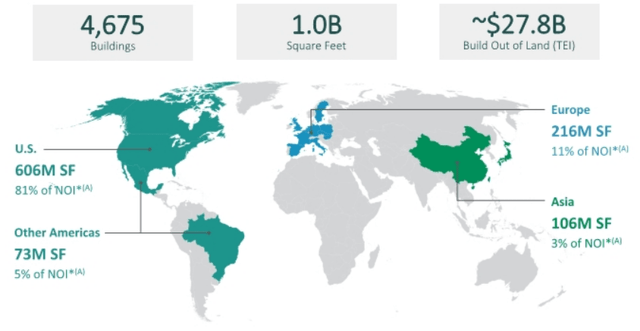
Prologis’ A- rating gives it a major marketplace advantage in expanding its portfolio at a low cost of capital. Its fortress balance sheet features a debt/EBITDA ratio of 4.7x. And, as of its Q1 earnings release, PLD had $6.8 billion in cash on hand.
Shares trade at a forward P/AFFO multiple of 24.3x 2023 projected earnings. Over the past five years, that figure has averaged 28.7x, suggesting shares are undervalued.
Oh, and let’s not forget that the company maintains a well-diversified portfolio. No single tenant accounts for more than 4.8% of base rent.
In fact, its top 10 make up less than 14% — yet another reason why I like this company.
(FAST Graphs)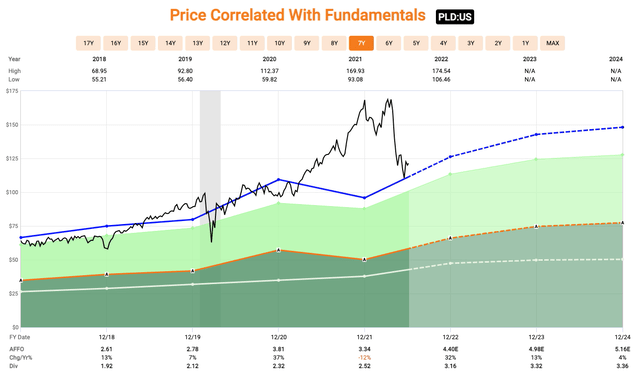
In Conclusion…
In my book The Intelligent REIT Investor Guide, I have an entire chapter dedicated to REIT balance sheets. I explain that blue-chip REITs:
“… deliver consistent, rising growth in FFO, dividends, and asset value over reasonably long periods of time.
“Because they’re financially strong and widely respected, they also tend to have access to additional equity and debt capital that can fuel above-average growth.”
That’s one reason we spend considerable time analyzing balance sheets and income statements at iREIT on Alpha. But we always want to expand our analysis from there:
“The true test of quality comes when the going gets rough. That’s when excellent property management, superior asset location, admirable leasing skills, and strong access to capital make an obvious difference.
“When their markets soften – meaning there’s more sellers than buyers – strong companies retain their tenants at much better rates, thus minimizing cash flow erosion.
“They’re also in better positions to take advantage of opportunities to pick up sound, well-located properties at bargain prices – that can then be put back on track to produce excellent returns for shareholders.”
I always insist on quality no matter the asset. With over 30 years of experience behind me, I’m confident in stating that the cream really always does rise to the top.
When you know that – and to buy in cheap – you don’t need luck. You’ve got the facts on your side.


Be the first to comment