

William_Potter
This is a sequel to Ignore Market Forecasts and Adopt an All-Weather Portfolio and The Contrarian’s All-Weather Retirement Portfolio. Here I provide my top picks in each asset class and the rationale behind them.
This portfolio won’t be very exciting for those seeking outsized returns. It’s not designed for younger and more aggressive investors. It has a distinctive contrarian and value bent. And given its passive, index-based construction, you won’t find any hot stocks here. Rather, it is geared towards investors who have achieved financial security and who seek capital preservation with modest real returns.
Portfolio Holdings
I described the dynamics of all-weather asset allocation in my last article, so here I’ll focus on the specific holdings shown in the table below.
Author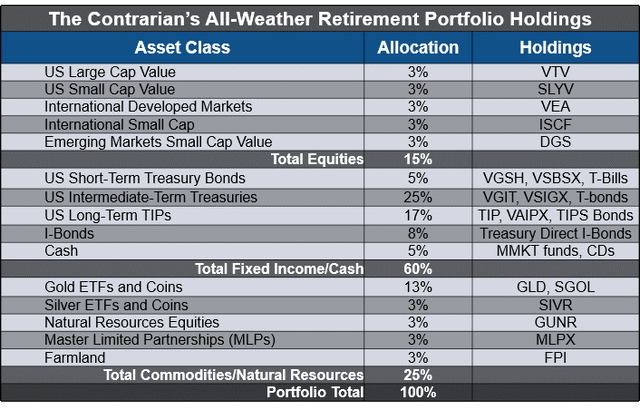
Contrarian All-Weather Retirement Portfolio Bond Holdings
Let’s begin with the largest component – bonds – with a 55% allocation.
High Quality (Treasury) Bonds Offer Superior Risk-Return
The first decision for the bond allocation is quality. I subscribe to the views of investor/author, Dr. William Bernstein: don’t take risk with bonds – take it with equities. That’s because higher yielding, lower-credit quality bonds have an inferior risk-return tradeoff. Investors take on disproportionately higher risk versus the higher yield they earn.
Larry Swedroe provided compelling evidence in his excellent book, Alternative Investments. He quoted the late David Swensen, chief investment officer for the Yale Endowment, “Well-informed investors avoid the no-win consequences of high-yield fixed income investing.”
For example, in the 2008 bear market, on a total return basis the Vanguard High-Yield Corporate Bond fund (VWEHX) declined 27.6%. You could have owned utility stocks (VPU) and lost a similar 28% that year. But VPU returned 10.3% over the past ten years while VWEHX gained only 3.9% per year.
In contrast, let’s look at high quality bond performance during one of the worst bear markets ever. In 2008, when the S&P 500 declined 37%, the iShares Long-Term Treasury ETF (TLT) gained 33.9% and the iShares Intermediate-Term Treasury index (IEI) gained 12.8%. Short-term Treasuries (VFIRX) also provided portfolio protection, gaining 6.68%. So you see the benefit of the Treasuries – portfolio insurance – especially during a deep recession with a credit crunch.
A caveat: unfortunately, this doesn’t always work, as we’ve seen during this year’s inflationary economic slowdown. That’s why one invests in an all-weather portfolio that has assets that thrive in different environments.
Another factor to consider is that this insurance is somewhat costly. Today’s short and intermediate-term yields of about 4% along with 8% inflation results in a 4% annual loss of purchasing power. However, if we experience a decline in the inflation rate and/or a deflationary depression, these holdings will provide much-needed portfolio protection. And if we experience annual U.S. stock market returns of only 3-5% for the next ten years as I expect, then a nearly risk-free 4% becomes highly attractive.
The Sweet Spot for Bond Duration is 3-5 years
The next bond decision is duration. Again, I follow Bernstein. The table below shows historic bond returns data from his classic book, “The Intelligent Asset Allocator.” While the data are older, the conclusion is still valid.
The Intelligent Asset Allocator, Bernstein, Author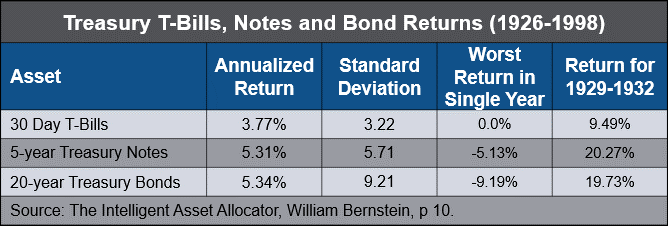
The 20-year bond added more risk as gauged by standard deviation and suffered larger declines in the worst year versus intermediate-term bonds. Yet the long-term average returns were essentially the same. This year provides a stark example. Long-term Treasuries (TLT) are down 31% versus an 11% drop for intermediate-term Treasuries (IEI) and a more palatable 5% for short-term Treasuries (VFIRX).
Adding weight to the case for shorter-term rather than long-term bonds is the current level of rates – even after recent sharp increases. After a 40+ year bull market, long-term bonds still carry considerable downside risk. For example, a two percentage point rise in long rates would result in a price decline on the TLT of 36%, given its 18-year duration. Could we see long rates drop again due to a severe economic slowdown and Fed reversal? Of course. It’s even possible we could see negative nominal rates in a deflationary depression. But I believe the downside risk outweighs the potential benefits.
Author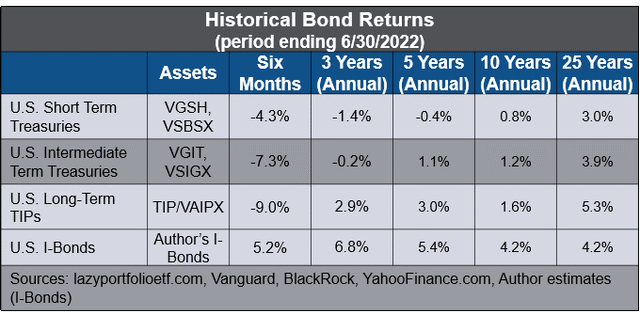
In summary, my view is that the ideal risk-return positioning for Treasuries is in the 3-5 year range. While expected returns continue to be muted, shorter duration Treasuries will do well in the event of deflationary depression, disinflationary, or low growth/rolling recession scenarios. This positioning also minimizes interest rate risk, while providing significant portfolio diversification.
As such, the Contrarian’s portfolio carries a 25% allocation to Intermediate-Term Treasuries, using VSIGX, VGIT and a bond ladder. It also carries 5% in short-term Treasuries (VGSH, VSBSX) and 5% in cash for additional defense, and liquidity for rebalancing and withdrawals. The portfolio uses a combination of low-cost mutual funds, ETFs, and a bond ladder.
Inflation Protected Bonds Haven’t Looked This Good Since 2009
The other major bond holding is inflation protected bonds. I have two flavors: TIPS and I-Bonds, with a combined total of 25%.
TIPS have been an imperfect, yet reasonable inflation hedge. The downside is that they are based on the flawed CPI which understates true inflation. Shadow Stats shows a more realistic 16% inflation rate using the 1980 methodology, compared to the latest CPI reading of 8.2% from the BLS. Long-duration TIPS also carry significant interest rate risk. This has been in play this year as evidenced by the TIP ETF, down 13%.
Nonetheless, TIPS offer some inflation protection with nice portfolio diversification (a low 0.13 correlation with equities over the past ten years). Over much of the past decade the real TIPS yield was negative, but recent rate increases have dramatically changed the landscape.
As of this writing, individual long-term TIPS maturing in 2042 have a 1.65% real yield. Investors haven’t had a chance to lock in a real yield that high since 2009. With the 20-year Treasury rate at 4%, the breakeven inflation rate is 2.35%. Since 1960, inflation averaged 3.8%. Given current inflation and the uncertain outlook, TIPS look like a reasonable long-term holding. I have a 17% allocation to them via a mix of ETFs, mutual funds, and a bond ladder. I believe the ladder is most effective. But for those who want a fund or can’t build a ladder in certain accounts, I like the lowest cost options: TIP, VIPSX, and for larger balances, VAIPX.
The Contrarian portfolio also carries an 8% allocation to I bonds. I was fortunate to acquire them during 1998-2000, with real yields ranging from 1-3%. They have been very good performers. They have tax deferral benefits and a current total yield close to 11%. For those buying now until the end of the month, the fixed (REAL) yield is zero. But the composite rate is a healthy 9.62% per year, but only until the end of this month. There is a purchase limit of $10,000 per account.
Contrarian All-Weather Retirement Portfolio Equity Allocations
Now let’s turn to equities. I consider world region, market cap and valuation as important factors when deciding on the equity allocation. I own natural resources equities, but consider them to be part of the commodity bucket of the portfolio. You can find my views on various equity sectors elsewhere on SA, including my mean reversion articles, so I’ll focus on key insights and updates here.
Higher Portfolio Allocation to Foreign Equities
The diversified equity portion of the portfolio is tilted towards foreign and emerging markets (EM), with 6% in U.S. stocks and 9% in foreign. The portfolio has an additional 9% in commodity producers. That adds another 6.6% in U.S. equities and 2.4% in foreign equities. This produces a total equity allocation of 12.6% U.S. and 11.4% foreign. That’s an equity split of 52%-48% U.S. to foreign.
That’s close to the world weighting of approximately 56% U.S. and 44% rest of the world, according to Finbold. Yet, investors across the globe harbor a home bias. Most U.S. based financial advisors recommend 70-80% U.S. equities and 20-30% foreign. Indeed, my earlier data show U.S. investors allocated 79% of their equities to the U.S.
This has worked well since the 2009 market bottom in an era of historic financial stimulus and speculation. Will it work going forward? I doubt it. Current U.S. valuations, muted growth prospects, outsized debt, and a dollar at a 20-year high lead me to a more balanced allocation.
A Weaker Dollar Favors Foreign and EM Equities
In Why Smart Money Will Ignore the Election and Pay Attention to This I discussed my long-term views on the dollar. Granted, this is a strategic, multi-year view. This year the dollar has gone parabolic versus other currencies. But what lies ahead?
The GMO Q2 quarterly letter, “35 Year Highs for the Dollar,” states,
According to the Bank of International Settlements’ Real Effective Exchange Rate model, the dollar looks more expensive than in all but two events in the last 51 years – the levels in 1971 that signified the end of the Bretton Woods Agreement and the mid-1980’s dollar bubble that led to the Plaza Accord.”
The chart below depicts the relative valuations of various currencies and stock prices.
GMO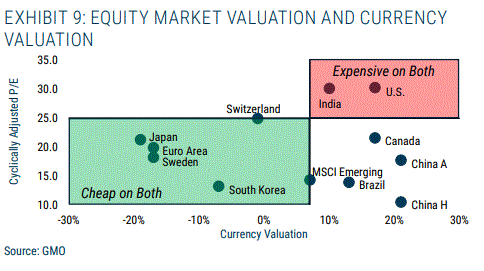
GMO concludes,
The USD and other “dollar” currencies are just on the verge of a level of overvaluation that augurs lousy returns for equity investors over the next three years. The Euro area and Japan, by contrast, have currencies that are sufficiently cheap that it should be a real help to their markets.”
The dollar and equity behavior after the dotcom bubble may also provide a clue to future direction. In the wake of the dollar run-up from 77 in 1995 to 120 in 2002, U.S. large cap equities languished. During 2000-2009, they returned 2% per year while foreign large caps returned 7%. EM did even better, gaining 10% per year. This isn’t a forecast, rather showing what could happen and why investors should be careful with too much weighting on U.S. equities.
Author, Trading Economics, IFA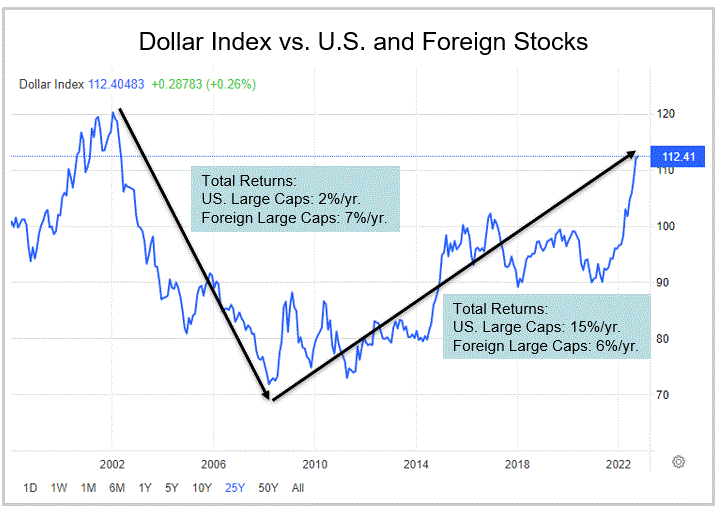
Foreign Developed and Emerging Market Valuations More Appealing Than the U.S.
According to Research Affiliates, the average emerging markets CAPE is 13, compared to the U.S. at 26. The developed markets (EAFE) CAPE is 19. The MSCI EM index at 10.5 times next year’s earnings, is cheaper than the 14X it averaged since 2010. And it is trading at its cheapest valuation since the global financial crisis. Beaten-up China has a CAPE ratio of 11. Europe is at 17.
The chart below shows U.S. equities trounced foreign over the past 12 years. However, when we look at longer time periods it shows multi-year cycles of alternating leadership.
BlackRock, Why Bother With International Stocks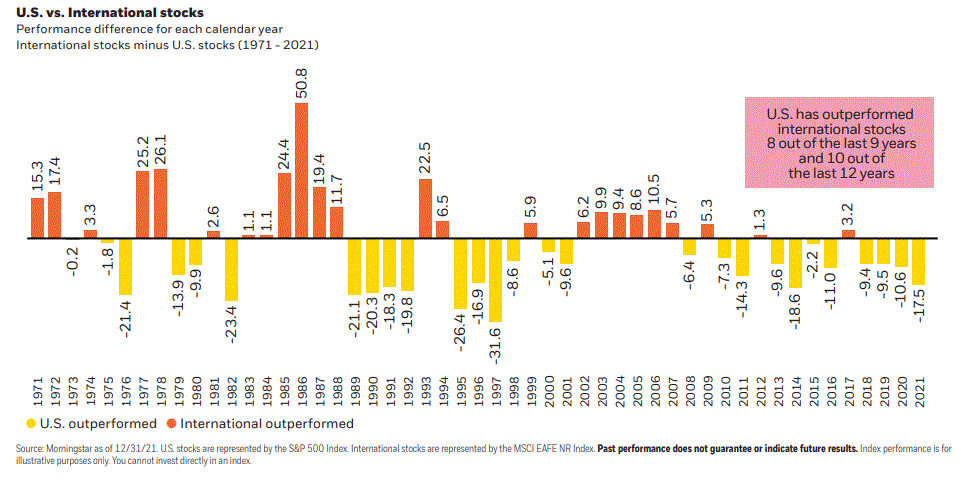
During periods of lower U.S. market returns over the past 50 years, foreign equities outperformed.
BlackRock, Why Bother With International Stocks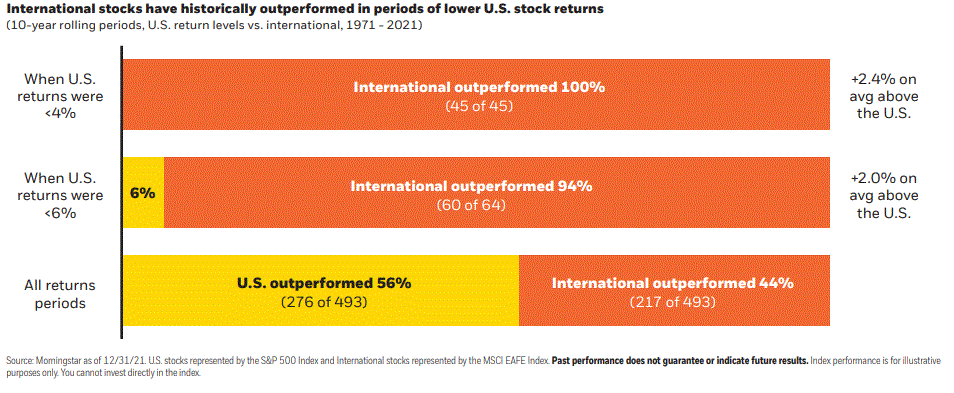
Contrarian Portfolio Foreign Equity Holdings
The portfolio utilizes the Vanguard FTSE Developed Markets Fund ETF (VEA), a foreign large blend fund, as its core foreign holding. It has a P/E of 11.4 and trailing 12-month yield of 4%. The iShares Edge MSCI Multifactor International Small-Cap (ISCF) provides small cap foreign exposure, as I covered before on SA. It has a P/E of 7.2 and 2.9% yield. WisdomTree Emerging Markets SmallCap Dividend (DGS) is my preferred vehicle for emerging markets exposure. The fund is focused on small cap value, trades at 7.8X earnings and has a generous yield of 5%.
Contrarian Portfolio Is Overweight Value and Small Caps
The equity portion of the portfolio is overweight value and small caps, due to the premium factor. Swedroe’s “Good News for Large-Cap Value Investors” cited returns over the period 1927-2021 from U.S. large cap value and small cap value of 12.0% per year and 14.5% per year respectively. That compares favorably to 10.2% per year for the U.S. total stock market (CRSP 1-10 index).
Although U.S. small cap and value sectors have underperformed the large cap and growth segments over the past ten years, the tide could be turning. This year large value (VTV, -13%) and small value (VBR, -16%) have shown relative strength versus large cap (VV, -25%) and mega-cap growth (MGK, -34%).
The Contrarian portfolio holds small value (SLYV) and large value (VTV) as its core U.S. positions. SLYV has a P/E of 10.2 and yields 1.9%. VTV has a P/E of 15.3 and yields 2.76%.
To be sure, these contrarian tilts have hurt the performance of the all-weather portfolio compared to U.S. large-cap heavy portfolios (e.g. the Dalio portfolio) over the past ten years. However the Contrarian All-Weather Portfolio is forward looking and recognizes the reality of mean reversion.
Author, Lazy Portfolio ETF, Morningstar, Vanguard, IFA, Wisdom Tree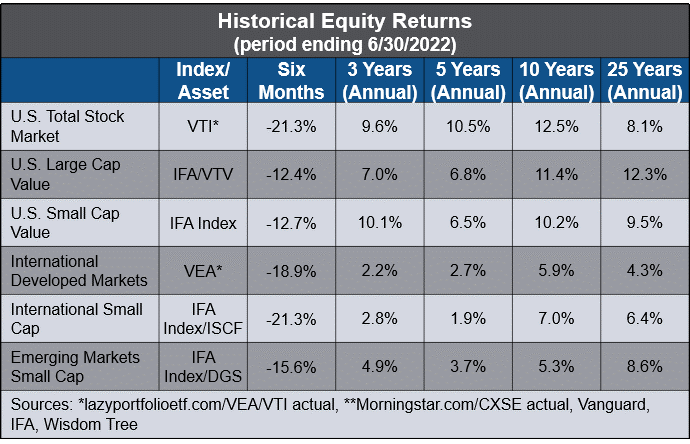
Contrarian All-Weather Portfolio Commodity Allocations
The portfolio has 13% in precious metals (10% gold and 3% silver) and 12% in natural resources equities.
Author, lazyportfolioetf.com, dqydj.com, farmland.illinois.edu, alerian.com, ssga.com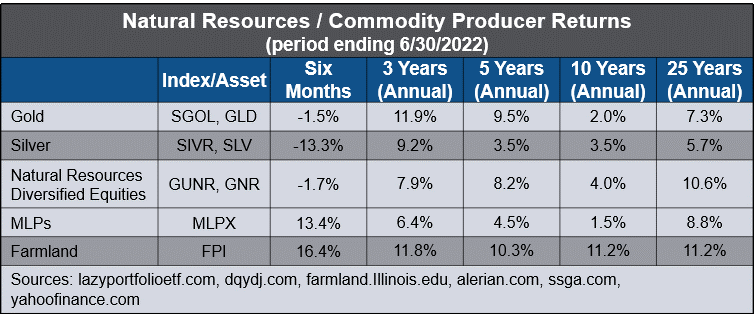
Gold and Silver: Portfolio Diversification, A Store of Value and Upside Potential
In my last piece, I discussed the portfolio diversification benefits so won’t repeat that here. I’ve also discussed my views on gold on before, including The Case for $5,000 Gold. Silver is cheap relative to gold and has fundamental support via its use in green energy and other industrial applications. Besides holding some physical metals in safe storage, I prefer the low-cost SGOL and SIVR ETFs, which are backed by the physical metal in safe storage.
Natural Resources Equities: Big Upside, Inflation Protection and Diversification
In 2020, before inflation began to surge, Natural Resources Equities: Preparing for Reflation and A Dollar Decline made the case for natural resources. There I also explained why I prefer the equities to commodity futures ETFs. In a sequel, I wrote about my preferred ETF, GUNR. It is up 44% since that time and I believe is still in the early innings of a multi-year run. It has a yield of 3.7%.
The Contrarian portfolio carries MLPX for Master Limited Partnership energy infrastructure exposure. It has provided nice portfolio diversification during this year’s bear market, with total return of 13.9%. MLPs were wiped out before and during the pandemic. But they now have strong fundamentals, attractive valuations, and yields. MLPX yields 6.4%. With the upward pressure on oil prices, the underinvestment in U.S. legacy energy over the past decade, and the participation of MLPs in green energy, we should see a ramp up in energy infrastructure investment for some time.
The final commodity holding is Farmland Partners (FPI). I have been following the stock for some time and believe it is one of the best (among few) ways to carry a diversified position in farmland. I was impressed by the analysis Buy Farmland Partners For Its Assets, Not Its Cash Flow, by The Value Puzzle.
In total, I believe these commodity holdings provide a well-diversified mix of assets that will perform well during both rising and moderate inflationary times with economic growth. And they’ve demonstrated the ability to dampen equity declines in a portfolio during stressful market conditions such as we’ve experienced this year.
Conclusion
The Contrarian All-Weather Retirement Portfolio has generated solid returns with low risk over the past 25 years. My portfolio modeling estimates a long-term annual return of 5.8%. History shows the worst annual drawdown was 4.8% in 2008. Some holdings may not be attractive to investors who look through the rearview mirror, like to trend follow or buy the latest hot growth stocks. But the portfolio may be attractive to investors who believe in time-tested principles of diversification, investing in value for the long-term, and not following the crowd.
I welcome your comments.
Be the first to comment