

JHVEPhoto
As most of you know, ConocoPhillips (NYSE:COP) is one of the world’s largest E&P companies. While COP frequently gets tagged as a “shale producer”, it’s important for investors to understand that COP has a global portfolio that gives it excellent exposure to price-advantaged Brent-based barrels. At pixel time, the current premium of Brent as compared to West Texas Intermediate (“WTI”) is ~$5.81/bbl. That is a huge advantage for Conoco versus its U.S. pure-play shale-producing peers. And, as I reported in my recent Seeking Alpha article on ConocoPhillips, it is a pioneer in LNG with deep technical expertise in the field. That is another advantage for COP, because it will enable the company to leverage and grow its global LNG business.
Investment Thesis
COP currently has activities in 13 countries across the globe:
ConocoPhillips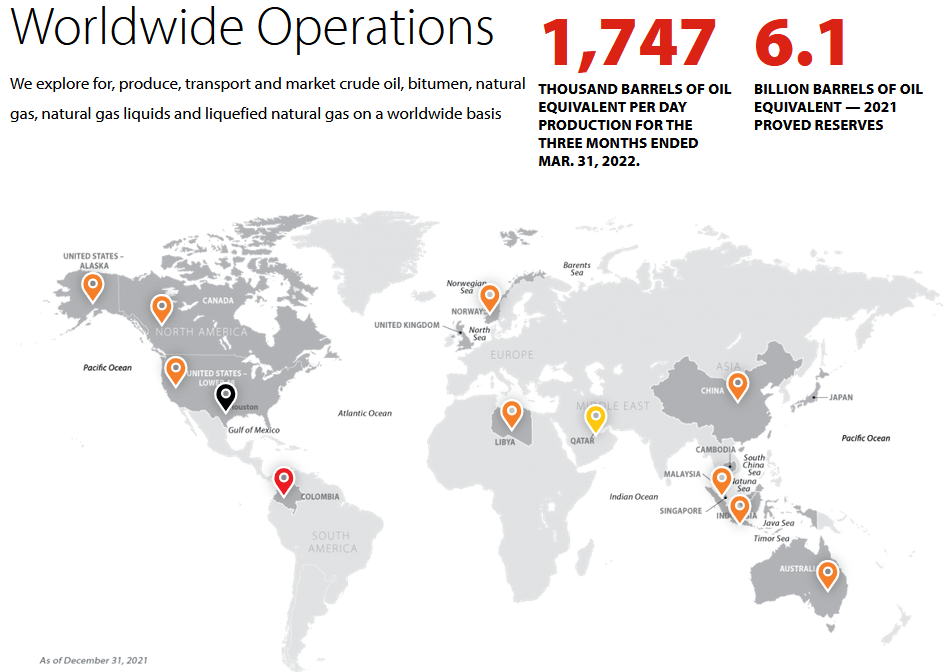
According to the 2021 Annual Report (SEC Form 10-K), COP’s year-end total proven reserves were 6.1 billion boe (~50% oil). Of that total amount, note that 2.275 billion boe of proven reserves come from the Lower 48, the majority of which is in the form of short-cycle unconventional shale. The point here is that US shale represents ~37% of Conoco’s total proved reserves – and that means it has lots of Alaskan and global reserves that are either Brent-priced, or – in the case of LNG – have long-term supply contracts linked to the price of Brent. Considering the price premium of Brent as compared to WTI (currently ~$6/bbl), or Western Canadian Select (“WCS”) for that matter (currently ~$17/bbl), this is a huge advantage for COP and should lead to a superior free-cash-flow profile as compared to its pure-play shale peers.
Let’s take a look at COP’s Q2 EPS report, released this morning (Thursday, August 4th), to see how the company is performing in this big O&G price up-cycle.
Earnings
As expected given strong O&G prices and COP’s exposure to global LNG prices (see ‘ConocoPhillips Shifts Focus To LNG, Stock On Sale’), the company reported a stellar Q2 EPS report this morning. Highlights included:
- Earnings of $5.1 billion ($3.96/share) were up 143% as compared to the $2.1 billion ($1.55/share) earned in Q2 of last year.
- Q2 production was 1,692,000 boe/d while successfully completing planned maintenance turnarounds.
- Debt was reduced by $1.8 billion during the quarter, reducing the debt-to-capital ratio to 25% (down three percentage points from Q1).
- Non-core asset sales reaped $400 million in proceeds.
- In addition to the $0.46/share base dividend, the company announced a variable dividend payment of $1.40/share.
- The company also announced a $5 billion increase in the amount of planned 2022 return of capital to $15 billion.
- COP ended the quarter with $8.5 billion in cash, or an estimated $6.55/share based on 1.296 billion shares outstanding.
Once again, ConocoPhillips greatly over-emphasized share repurchases ($2.3 billion) over dividends ($1.0 billion).
Realized Prices
The following chart summarizes the reported realized prices for oil, natural gas, and NGLs production during Q2 for Conoco and some of its US shale-producing peers: Diamondback Energy (FANG), Occidental Petroleum (OXY), and Pioneer Natural Resources (PXD):
| Realized Prices In Q2 | ||||
| Oil bbl | Nat Gas | NGLs | Total | |
| COP | $111.50 | $10.15 | $43.26 | $88.57 |
|
FANG (unhedged) |
$108.80 | $6.15 | $40.69 | $79.49 |
| OXY | $107.72 | $5.03 | $42.04 | N/A |
|
PXD (unhedged) |
$110.56 | $6.72 | $44.21 | N/A |
Source: ConocoPhillips (here & here), Diamondback, OXY, Pioneer Natural Resources
NOTE: COP is 100% unhedged; realized prices for the other companies listed exclude the impact of derivatives.
As can be seen from the chart, COP receives higher prices for its oil production given its exposure to Brent, and significantly higher overall pricing for its natural gas production given its exposure to global LNG pricing. Clearly, COP’s global portfolio is much advantaged as compared to its US shale peers.
Free-Cash-Flow Generation
Now let’s take a look at how much free-cash-flow these companies generate as a percentage of revenue. Granted, the FCF/revenue ratio is a rough measure which is better taken over the course of an entire year, but COP closed two big deals last year (Concho and Shell), so I will compare free-cash-flow generated as a percentage of revenue during Q2:
| Free-Cash-Flow Generation | |||
| Revenue | FCF | % FCF/Revenue | |
| COP | $21.99 billion | $5.9 billion | 27% |
|
FANG |
$2.77 billion |
$1.3 billion | 47% |
| OXY | $10.74 billion | $4.2 billion | 39% |
|
PXD |
$5.86 billion | $2.7 billion | 46% |
Source: ConocoPhillips, Diamondback, OXY, Pioneer Natural Resources
I said this was a “rough measure” because each company listed above is susceptible to quarterly variations, special items, timing considerations, and various accounting and operational abnormalities. Companies also have differing definitions of what “free-cash-flow” actually is. However, what the chart shows is that – despite having an arguably superior global production portfolio – companies like Diamondback and Pioneer are operating much more efficiently when it comes to free-cash-flow generation as a percentage of revenue as compared to ConocoPhillips.
That said, COP is likely still working on ringing out additional synergies from its two big Permian acquisitions last year, especially considering the $9.5 billion Shell deal didn’t close until December. And the company is making progress: its FCF/Revenue ratio in Q1 was only 20% ($19.29B/$3.9B). However, COP obviously has a long way to go to become as efficient in generating FCF as some of its leading pure-play shale peers.
If one assumes that COP will continue to make progress in becoming a more efficient organization going forward, that is a big opportunity for investors. Considering the global size and productive capacity of the company, another 5% increase in free-cash-flow as a percentage of revenue could easily add $4-5 billion of free-cash-flow a year, or in the neighborhood of an extra estimated $3.50/share.
Risks
Investing in O&G producers investors exposes investors to commodity prices and the cyclicality of the global O&G markets. Investors should consider that the primary reason that the global oil market was tight prior to Putin’s invasion of Ukraine was that US shale oil producers, sitting on 10’s of billions of barrels of proven reserves (at $40/bbl WTI, let alone $100/bbl…), simply decided not to drill more shale wells that could have very economically and relatively quickly brought oil to market via pipelines that already exist. That could change going forward as the current relatively high price of WTI (and natural gas…), which is more than double the break-even price for most shale producers, might encourage more of them to, well, produce and cash-in.
There is execution risk in the narrative above with respect to COP becoming a more efficient company. Perhaps the company can’t (or won’t …) do so on its own. Note that Conoco CEO Ryan Lance is also the Chairman of the Board. That’s a big governance “no-no” and doesn’t bode well for board oversight. Upside potential for COP would be for an activist company like Engine #1 to run for, and win, seats on ConocoPhillips BOD. Many energy investors have been misled and believe that #1’s goal was simply environmental. This is not true, Engine #1’s primary goal was to increase Exxon’s total returns considering the company had delivered a negative total return over an entire decade and had been kicked out of the DJIA as a result. For investors that want to understand why Engine #1 got such strong support from institutional investors at Vanguard, Black Rock, and State Street (and ordinary investors like me …) and won not one, not two, but three seats on Exxon’s board, I suggest they read this ‘NYU Stern School Case Study’ and ‘Exxon: One Year Later’.
In the mid-term, and as I have been reporting for a couple of years now, ConocoPhillips has been greatly overemphasizing the amount of capital allocated to stock buybacks over dividends directly to shareholders. Of the $6 billion returned to shareholders last year, only $2.4 billion (34%) was in the form of dividends while 66% went to share buybacks ($3.6 billion). As mentioned earlier, that continued this quarter ($2.3 billion versus $1 billion for dividends). Shareholders deserve more of a “fair-shake”. The $1.40/share variable dividend declaration this quarter was certainly an improvement (double last quarter’s $0.70/share variable dividend), COP is significantly lagging the variable dividend payments peers like EOG Resources (EOG) and Pioneer Natural Resources are paying out to shareholders. Indeed, as I recently reported on Seeking Alpha, Pioneer Resources Could Pay $30/share In FY22 Dividends. That being the case, COP shareholders should be concerned that, like so many energy companies over the past 20 years, the company will massively over-spend on buybacks during the current up-cycle (when the stock price is high) while suspending the buybacks during down-cycles (when the stock represents much better value). This issue is ripe for an activist like Engine #1 to push for a better deal for ordinary shareholders.
Longer term, the adoption of EVs will – at some point – result in decreasing demand for gasoline (i.e., oil). Most analysts expect EVs to account for ~50% of global new vehicle sales by 2030. Given the current very high price of gasoline, and the proliferation of lower-cost EV models now hitting the market, that estimate could be on the low side. Given that macro concern, COP shareholders would be better off with dividends directly to them instead of the company forcing them to reinvest in oil by going overboard on share buybacks.
Summary & Conclusions
COP has an advantaged global portfolio as compared to its pure-play US shale peers. As a result, COP generally achieved higher realized prices for its production due to exposure to Brent and global LNG pricing. However, Conoco is not nearly as efficient as some of their peers when it comes to generating free-cash-flow as a percentage of revenue. And that is a huge opportunity for the company and for its investors. If Conoco can ring out more synergies from its recent Permian acquisitions, and generally become a much more efficient company, its free-cash-flow generation profile has significant upside. And that should lead to more rewards for its shareholders.
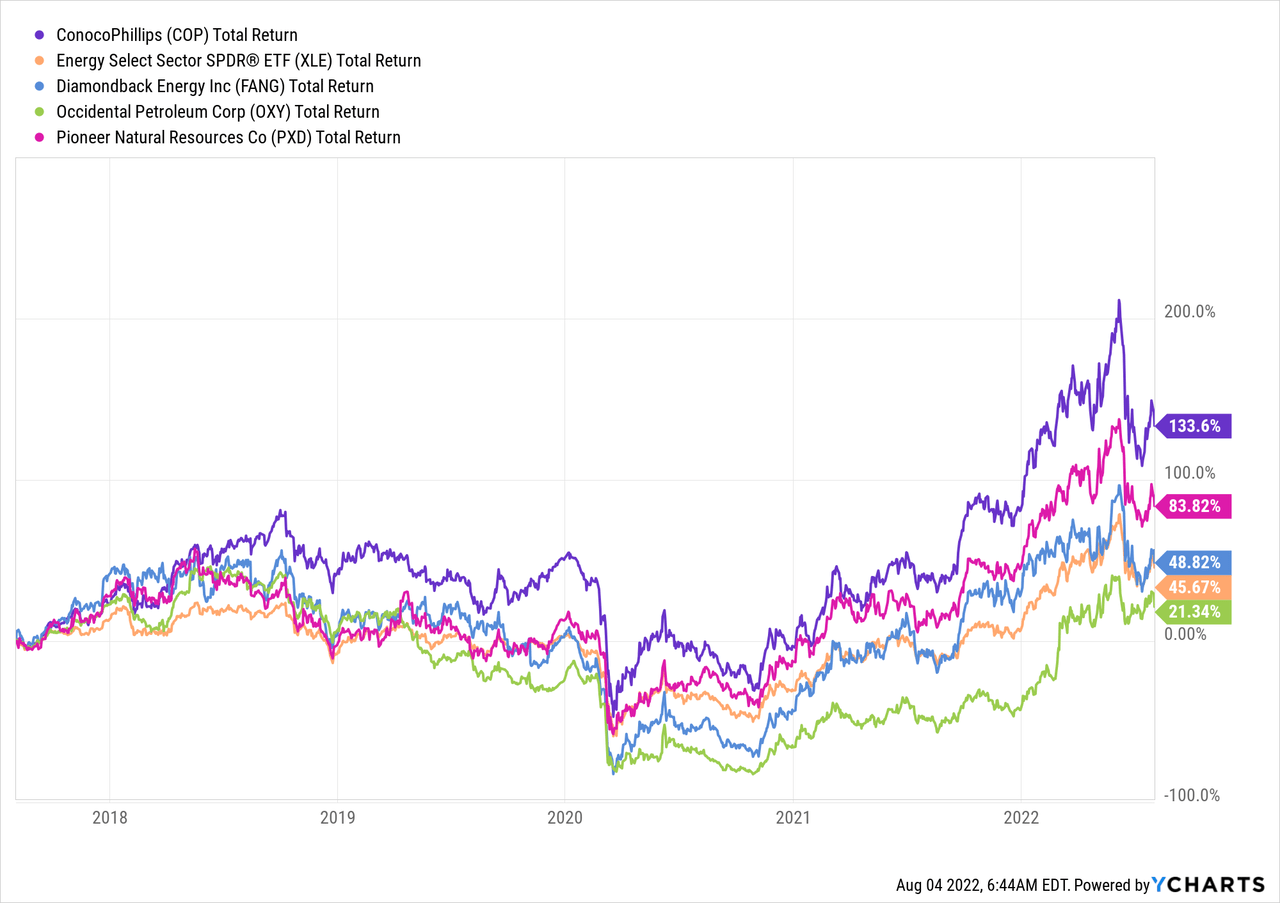
I’ll end with a chart of COP’s 5-year total returns as compared to the Energy Select SPDR ETF (XLE) and some of its US shale peers:
Be the first to comment