

mladenbalinovac
The final days of 2022 are upon us, and the stock market has not experienced a Santa Claus rally. Rising interest rates have put downside pressure on stocks as investors opt for fixed-income assets. Moreover, rising financing costs weigh on corporate earnings. The U.S. Fed has battled the highest inflation in four decades by raising the short-term Fed Funds Rate from a midpoint of 12.5 basis points in March 2022 to 4.375% at the end of 2022. Meanwhile, quantitative tightening at $95 billion monthly has pushed rates higher further out along the yield curve.
Interest rate differentials are a critical factor for the value of one currency vs. others. The trajectory of U.S. interest rates pushed the dollar index, which measures the U.S. dollar against the euro and other world reserve currencies, moved to a two-decade high of 114.745 in September 2022 before correcting. A rising dollar is bearish for U.S. multinational companies’ profits as it makes them less competitive against foreign companies.
Higher rates and a strong U.S. dollar are typically bearish for commodity prices, but 2022 has been no ordinary year. The Invesco DB Commodity Index Fund (NYSEARCA:DBC) holds a portfolio of raw materials with a significant weighting in energy commodities. DBC has outperformed the leading U.S. stock market indices in 2022, which looks likely to continue in 2023.
A gain in 2022: Outperforming the S&P 500
In an ugly year where all the leading stock market indices posted double-digit percentage losses, the DBC ETF product outperformed the market and moved to the upside.
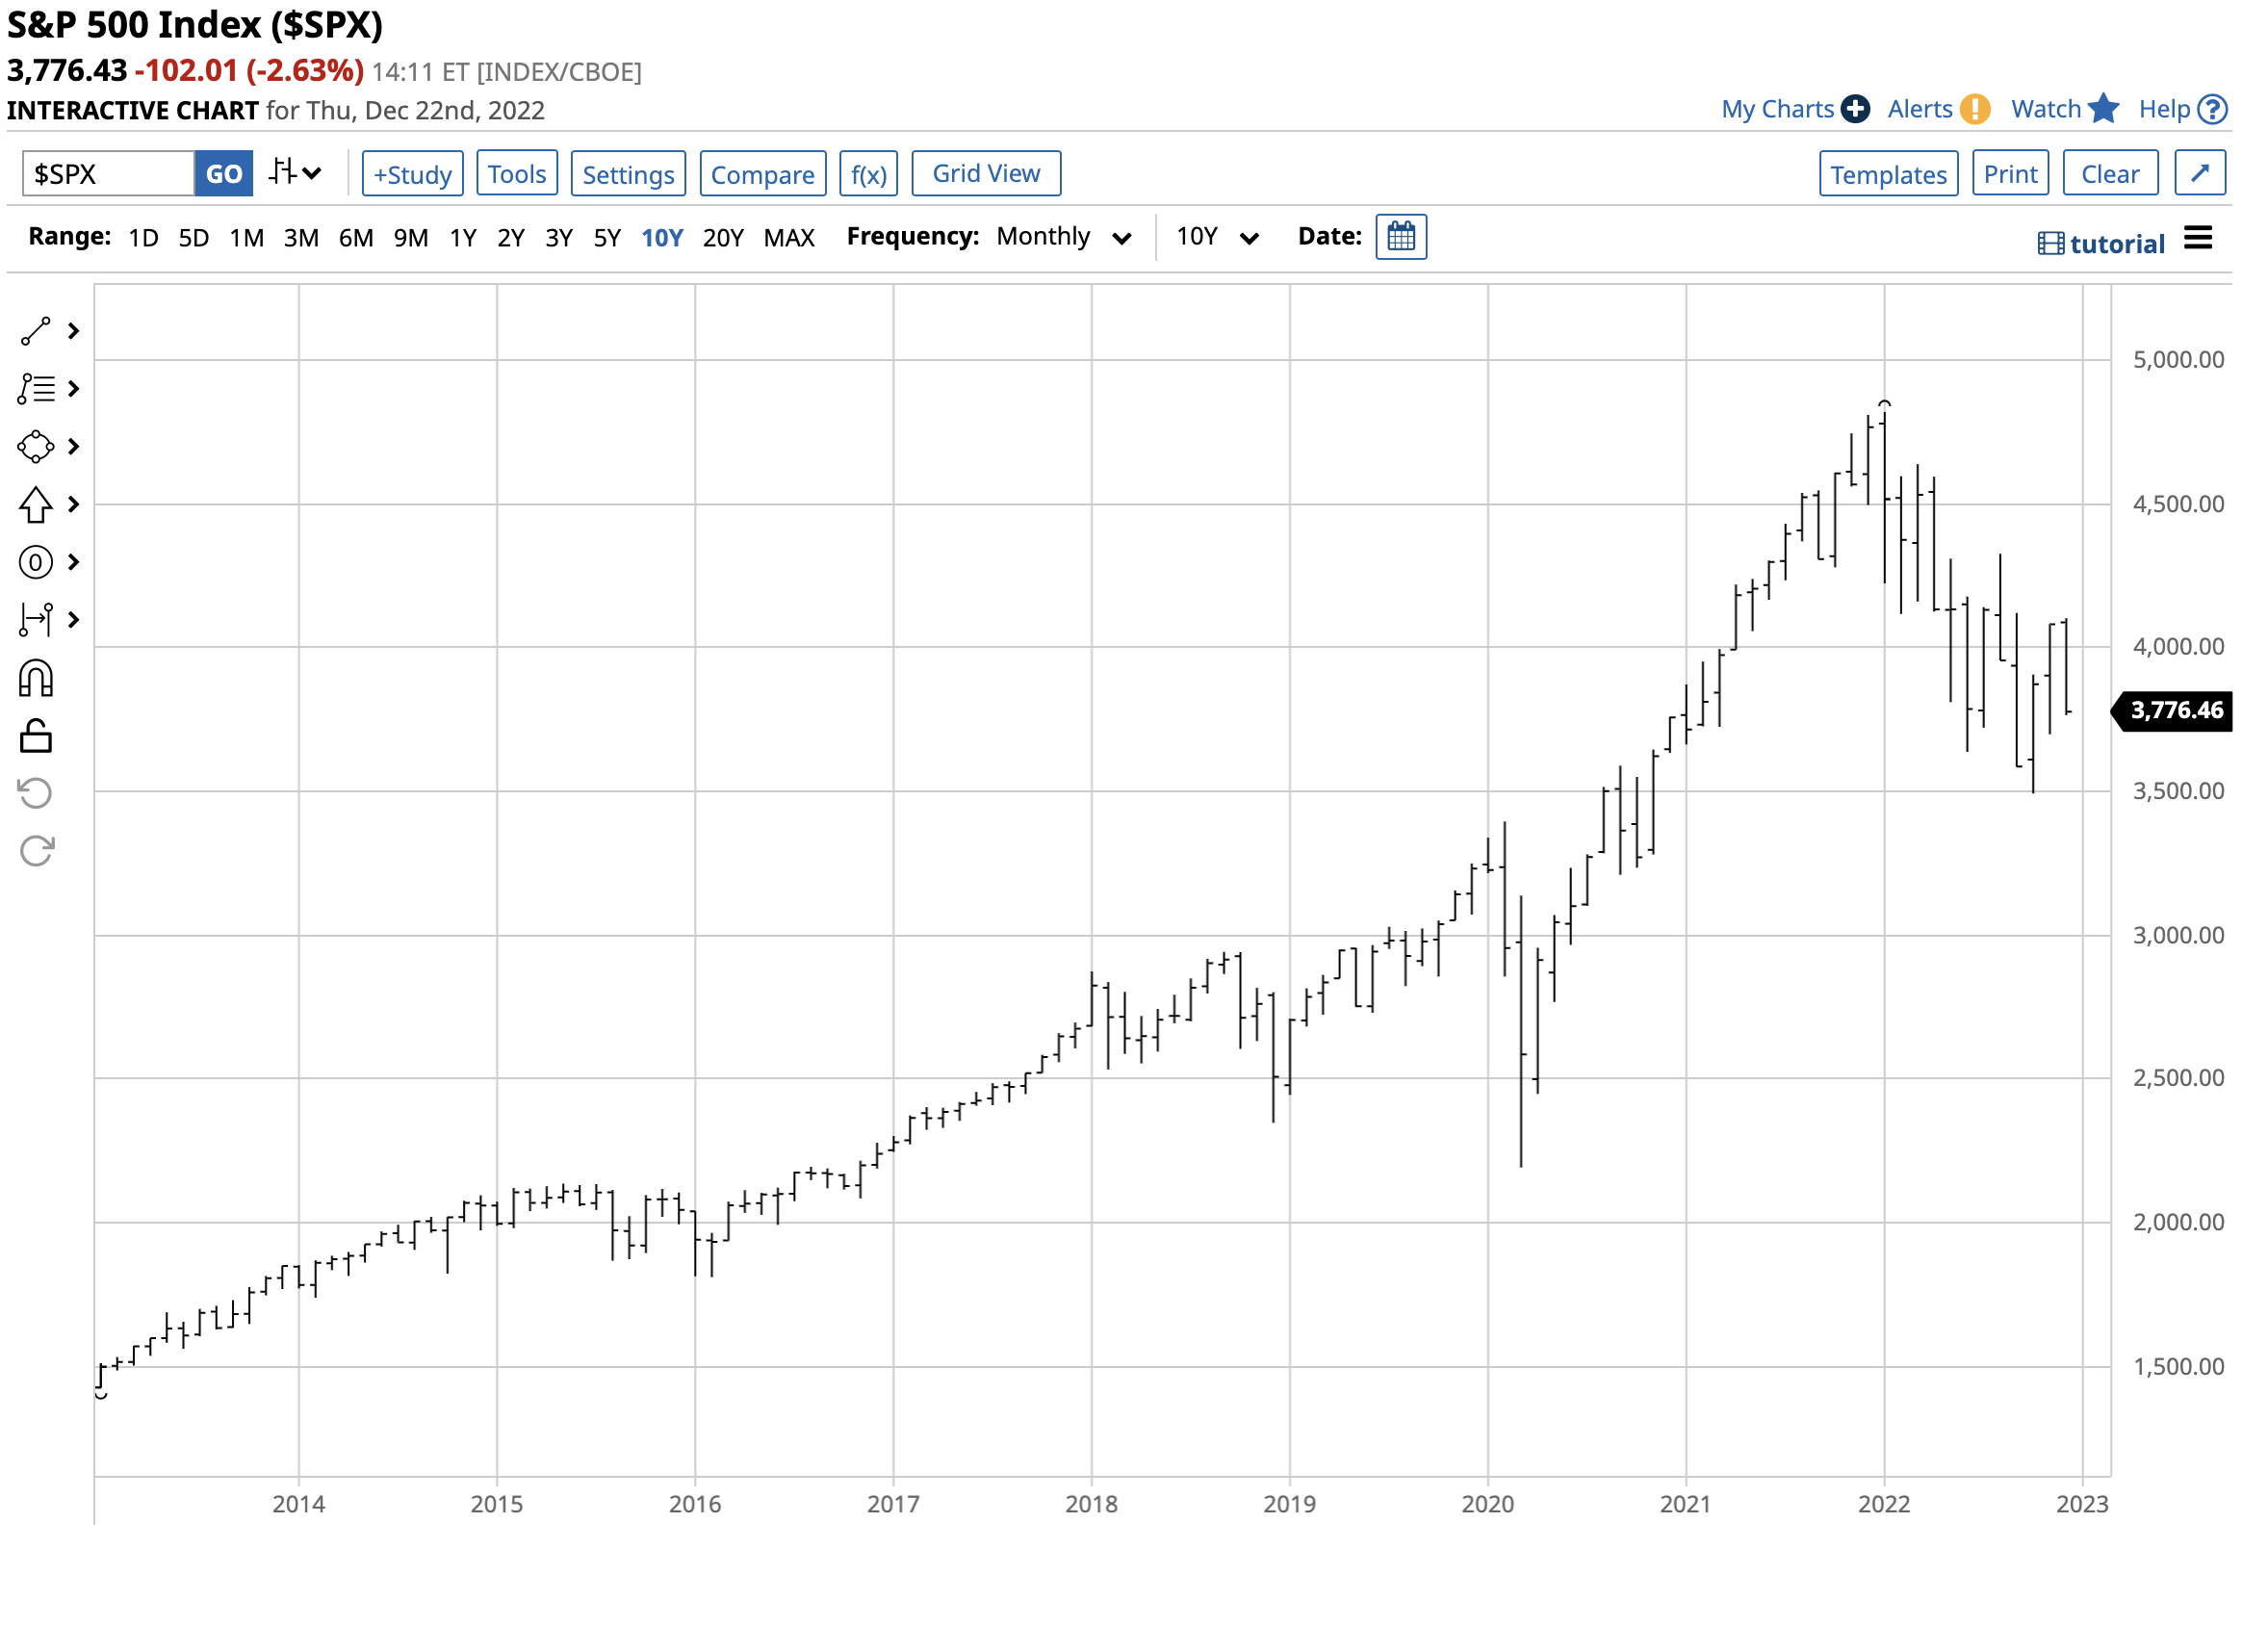
Chart of the S&P 500 Index (Barchart)
At 3,766.43 on December 22, the S&P 500 was 20.98% than the closing level of 4,766.18 on December 31, 2021.
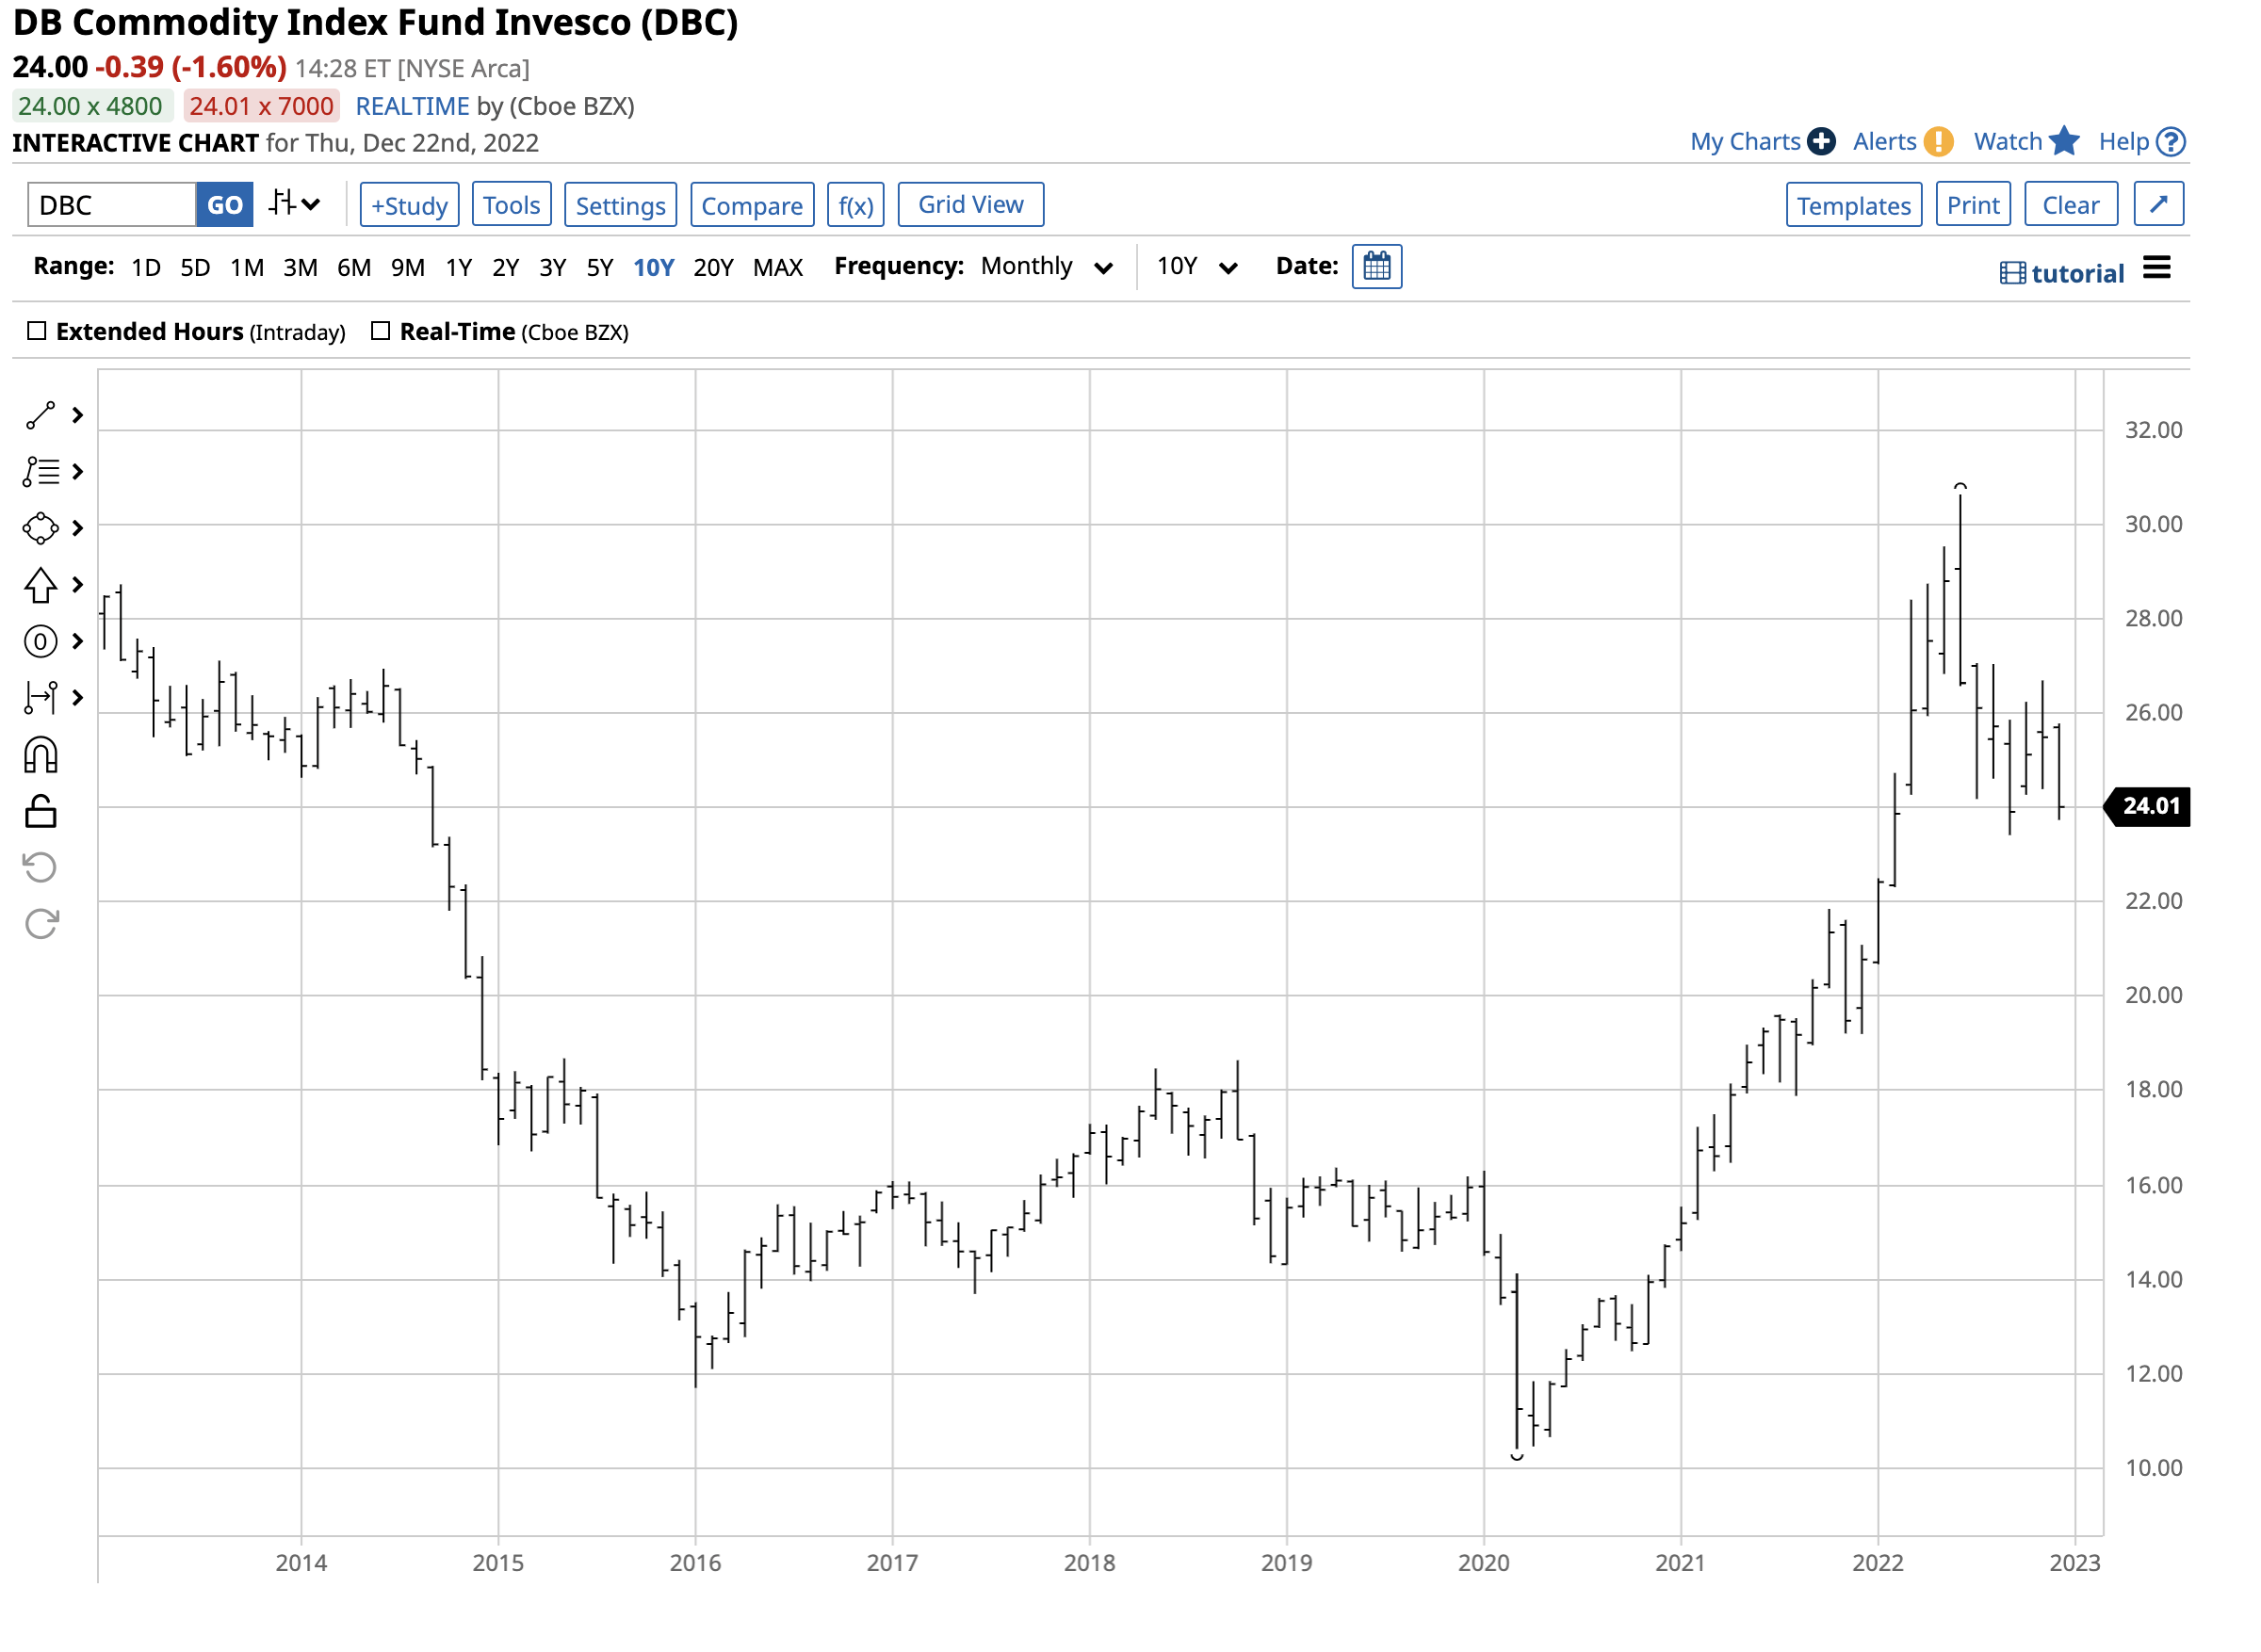
Chart of the DBC ETF Product (Barchart)
DBC was $24.00 per share on December 22, 15.5% higher than the $20.78 closing level at the end of last year.
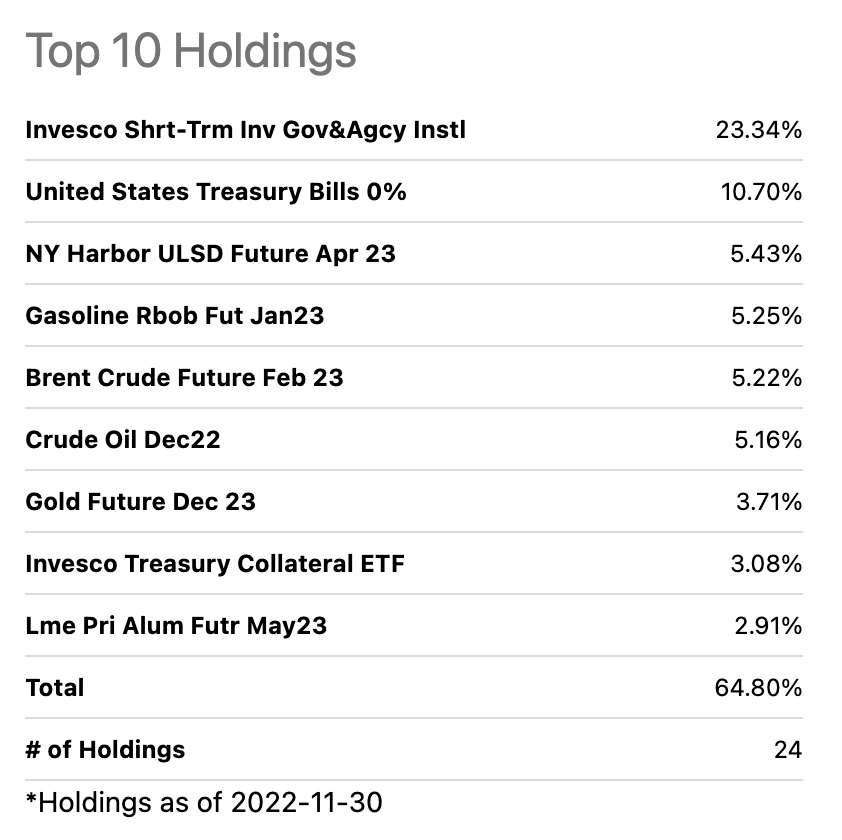
Top Holdings of the DBC ETF Product (Seeking Alpha)
As the chart shows, as of the end of November 2022, DBC held over 21% of its assets in crude oil and oil products. At $24 per share, DBC had $3.08 billion in assets under management. The ETF trades an average of more than 3.1 million shares daily and charges a 0.87% management fee. The annual dividend of 14 cents or 0.58% comes from fixed-income holdings. DBC is a highly liquid commodity ETF with a significant energy weighting.
Meanwhile, DBC has additional exposure to gold and metals, which have outperformed stocks, bonds, and most other assets in 2022.
Pressure on the Fed to curb its enthusiasm for higher interest rates
The trajectory of rate hikes addressing inflation typically slows economic growth. Higher rates have weighed on the stock market as increased financing costs weigh on corporate profits. Moreover, the rising dollar made U.S. multinational companies less competitive against foreign companies, causing earnings to decline.
With U.S. interest rates at the highest level in 15 years in late 2022, the odds of a recession have increased. An economic contraction would cause the Fed to think twice about continuing its path of aggressive interest rate hikes.
At the December FOMC meeting, the central bank’s consensus forecast was for a 5.1% Fed Funds Rate in 2023. Most Fed officials project that the short-term rate will rise above 5% in 2023. Moreover, quantitative tightening continues at a $95 billion monthly rate. A recession could change the Fed’s plans over the coming months. After a year of significant rate hikes, the central bank could curb its hawkish enthusiasm in the coming year. A stabilization of rates would take downside pressure off commodity prices.
Supply-side inflation and U.S. energy policy
The war in Ukraine, sanctions on Russia, and Russian retaliation have put traditional energy commodities in the crosshairs of the ongoing conflict. Russia is a leading oil and gas-producing country and has used the energy commodities as a military funding tool and weapon against “unfriendly” countries supporting Ukraine. Crude oil and oil products spiked higher, with petroleum rising to the highest price since 2008, above the $130 per barrel level earlier this year. Gasoline and heating oil prices reached all-time highs. In the U.S., natural gas prices probed above $10 per MMBtu for the first time in fourteen years as European prices reached record highs.
Energy is a critical input for all goods and services, and the high prices have ignited inflationary pressures. While the Fed’s rate hikes can dampen demand, the central bank has no tools to control supply-side inflation, a political issue.
Meanwhile, the Biden administration has taken a greener path to U.S. energy production and consumption, supporting alternative and renewable fuels and inhibiting fossil fuels. Addressing climate change has handed pricing power to the international oil cartel, OPEC, where Russia has been the most influential non-member over the past years. OPEC’s production policies have been a function of negotiations and decisions in Riyadh, Saudi Arabia, and Moscow. While the international oil market has always been a geopolitical hornet’s nest, the war in Ukraine has increased OPEC’s pricing power. After suffering from increasing U.S. shale production for years, the cartel is now able to keep prices high with the U.S. following its environmental energy policies.
In 2022, the U.S. released an unprecedented 180 million-plus barrels from the Strategic Petroleum Reserve, which has declined to the lowest level since 1984. The sales were at an average price of $96 per barrel. On December 22, the nearby NYMEX crude oil futures settled at $77.49 per barrel. The administration recently announced it is buying barrels at nearly $20 below the sales average.
The U.S. SPR sales pushed oil prices lower, and OPEC cut production over the past months, citing weak demand from China. OPEC will likely do little to help the U.S. Moreover, replacing the SPR supports oil prices at the current level. The bottom line is oil’s supply fundamentals, and U.S. energy policy continues to support the energy commodity’s price as we head into 2023.
The dollar index has turned lower: Cracks remain high
The U.S. dollar is the world’s reserve currency and the pricing mechanism for most commodities, including energy. The index reached an 89.165 low in January 2021, where it turned aggressively higher.
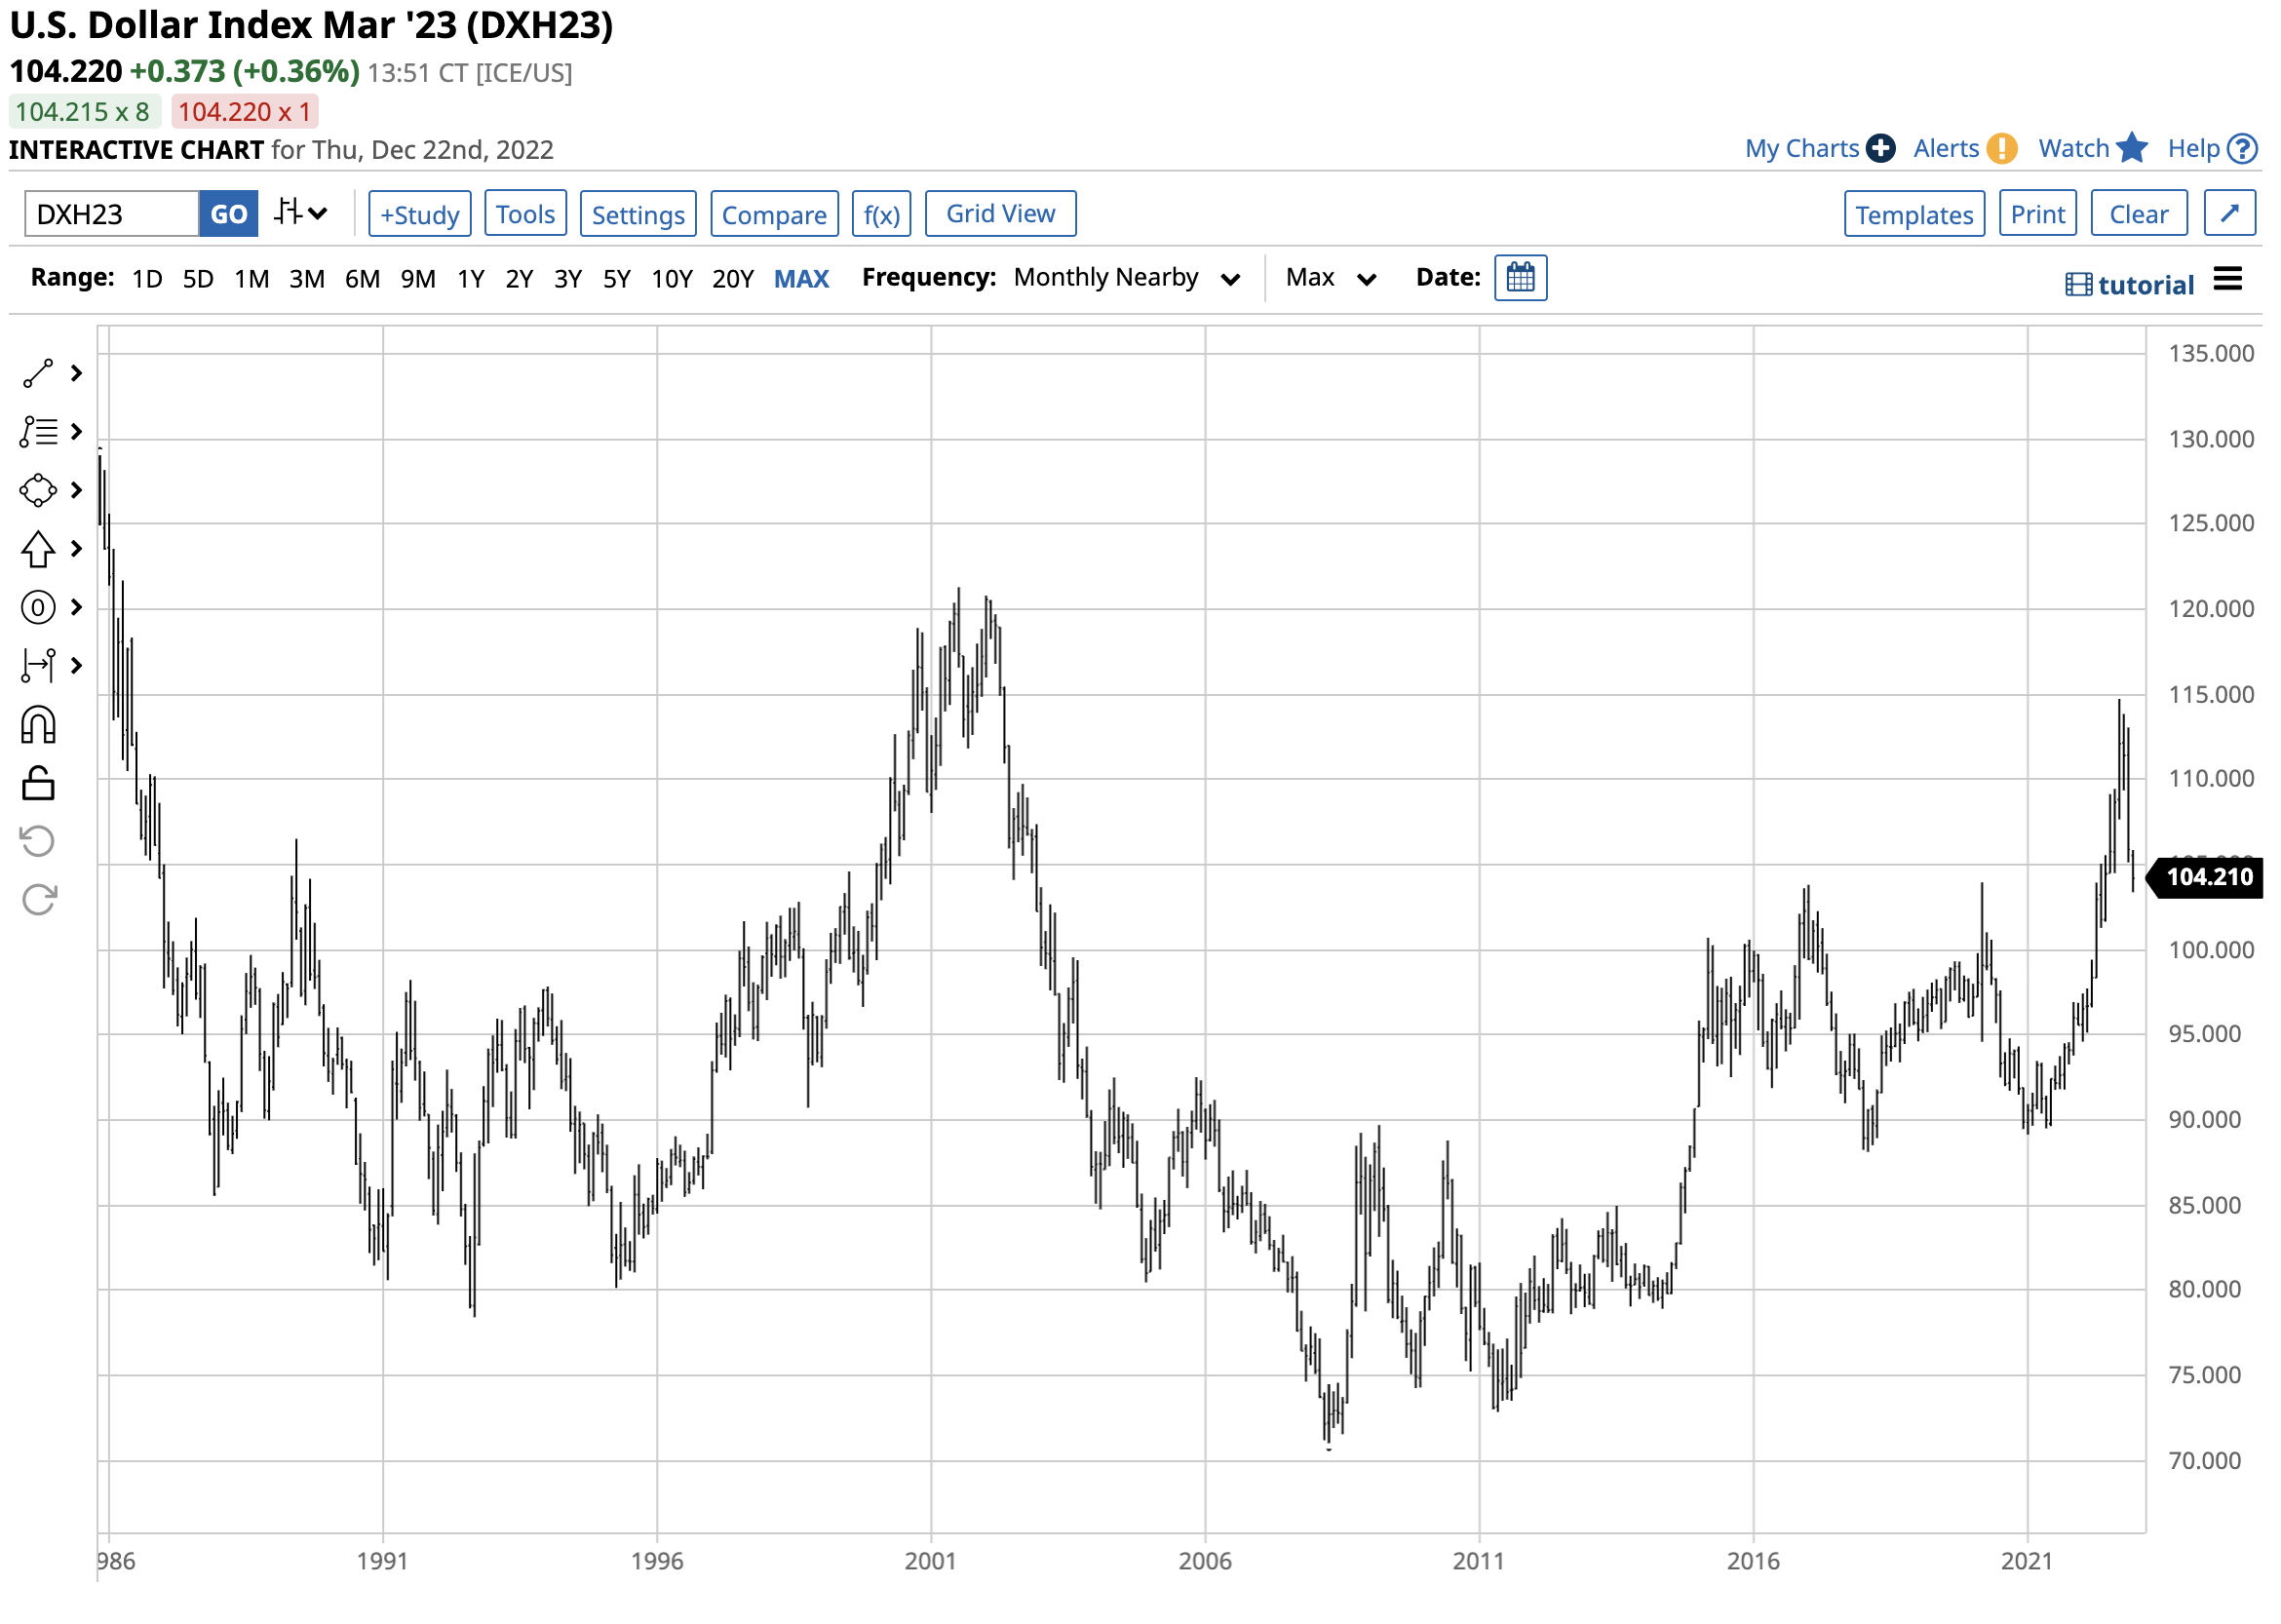
Chart of the U.S. Dollar Index (Barchart)
The chart shows the 28.9% move from the early 2021 low to the September 2022 114.745 two-decade high. After surpassing the March 2020 103.96 peak, the dollar index broke out and followed through on the upside. Rising U.S. interest rates caused the dollar to rally as interest rate differentials are one of the most influential factors for the value of one currency vs. another. The euro currency accounts for 57.6% of the dollar index. The war in Ukraine, on Europe’s doorstep, weighed on the euro and pushed it below parity against the U.S. dollar for the first time since 2002. Rising U.S. rates and geopolitical turmoil in Europe poured bullish fuel on the dollar index’s rally in 2022. Meanwhile, after running out of upside steam at 114.745, the dollar index fell to its former technical resistance level that has become support. At just over 104 on December 22, the index has been trading on either side of the 103.96 level since late November. If the Fed decides to stabilize rates as the odds of a recession increase over the coming weeks and months, we could see the dollar index break lower. Moreover, the geopolitical bifurcation between nuclear powers could cause the dollar’s position on the global stage to decline. A falling dollar tends to support commodity prices, and energy is no exception.
Crack spreads, or the margin for refining a barrel of crude oil into gasoline and distillate products, are real-time indicators of petroleum demand and a barometer for the path of least resistance of crude oil prices as petroleum is the essential ingredient in the refining process.
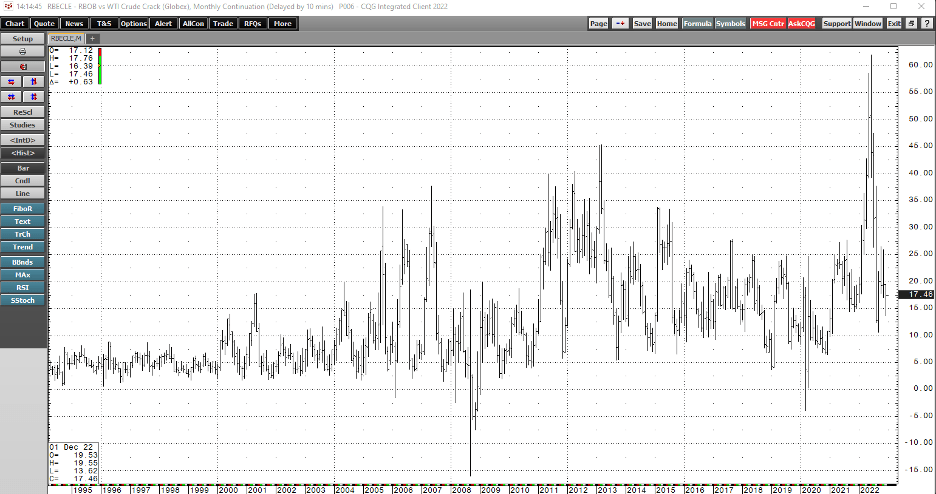
Monthly Chart of the Gasoline Crack Spread (CQG)
The monthly chart of the gasoline crack spreads highlights the move to a record $61.95 per barrel high in June 2022. At the $17.45 level on December 22, the crack is elevated during the offseason for gasoline demand during the winter. In December 2021, the gasoline crack reached a $19.443 high, but in 2020 and 2019, the December peaks were $10.89 and $12.21 per barrel, respectively.
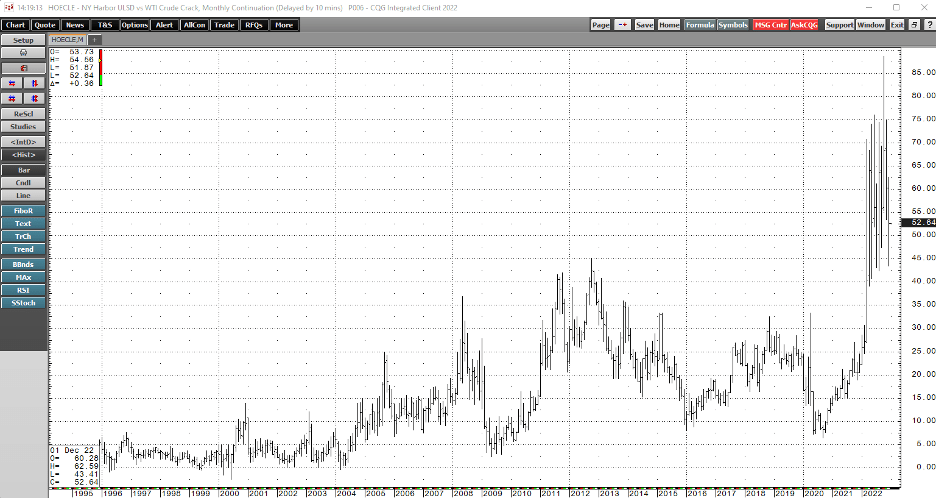
Chart of the Distillate Crack Spread (CQG)
Heating oil is a proxy for distillate prices, including jet and diesel fuels. The distillate crack spread above $52.50 per barrel is at the highest level in years. Distillate cracks rose to a record $88.56 high in October 2022; the previous record high was in 2012 at $45.12 per barrel. In December 2021, the distillate processing spread peaked at $24.56 per barrel, and in 2020 and 2019, the highs per $14.88 and $24.99 per barrel, respectively.
Crack spreads are a real-time indicator of the demand for oil products and a barometer for crude oil prices. The refining margins tell us that the products support higher crude oil prices. Moreover, the market will reflect the peak gasoline season in early 2023, which could push the gasoline crack spread significantly higher.
Traditional energy continues to power the world
The bottom line is traditional energy commodities power the world. Even though the U.S. and Europe are on a greener path to energy production and consumption, the world’s most populous countries, China and India, continue to consume ever-increasing amounts of oil, gas, and coal. Coal prices soared in 2021 as China and India require fossil fuels for power generation. Moreover, most cars in the U.S. and Europe are gasoline powered, and gas and coal requirements have increased this year.
In late 2022, no signs point to an end to the Ukraine conflict, and relations between the U.S./Europe and China/Russia have deteriorated. The Fed could run out of monetary policy bullets if a recession grips the U.S. economy. The bottom line is a compelling case for higher energy and commodity prices in 2023.
DBC is a highly liquid product that could continue to outperform the U.S. stock market in the coming year. While an end to the war would likely cause commodity prices to fall, the odds are unlikely as we head into the New Year.
Be the first to comment