

jeffbergen
As Times Are Tough for Apparel Retail Stocks, Investors Should Consider Trimming their Positions
Although household spending propensity is holding up amid energy costs and high inflation, apparel retail is currently not among the sectors that analysts recommend and investors favor.
Evidence of this decline in the appetite for apparel retail stocks is the sharp loss of more than 15% that the S&P 500 Apparel Retail [Sub Ind] (^SP500-25504010) — the industry’s leading index — has suffered year-to-date amid ongoing bearish sentiment in the market.
seekingalpha/symbol/SP500-25504010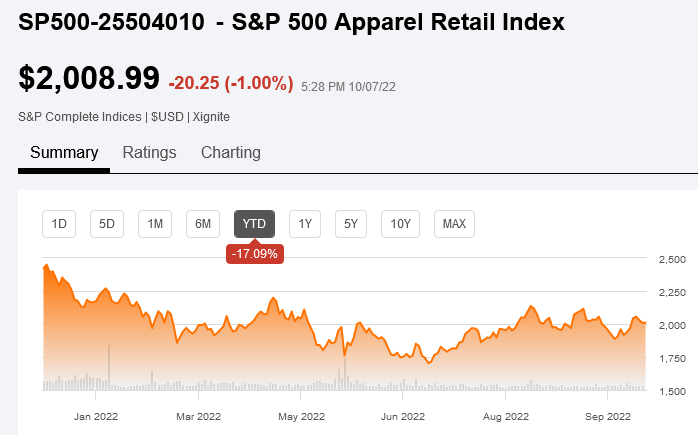
The following trend certainly doesn’t help to see the situation in a better light. US retail sales are slowing down, coming in at 9.1% YoY in August after rising 10.1% in July.
The future isn’t looking bright for analysts either, as they forecast retail sales to slow down another 260 basis points through the end of 2022, another 250 basis points in 2023, and another 220 basis points in 2024.
The estimates reflect consumer concerns as they feel the economic future is more uncertain than ever. They fear that the expected recession could result in fewer jobs and thus fewer opportunities to earn money. Furthermore, inflation and rising electricity and gas bills severely test the purchasing power of consumers’ earned income.
As a measure of this, the University of Michigan consumer sentiment indicator provided a clue as it fell to 58.6 in September 2022 after being revised downward from its preliminary reading. While YoY sentiment among US consumers fell 19.5%. For the coming periods, the index is expected to improve slightly to 59.50 points by the end of 2022, stay around the same level in 2023 and then fall to 55 points in 2024.
The estimates for 2023 and 2024 are preliminary and very likely to deteriorate due to the US Federal Reserve’s difficult hawkish stance to combat galloping inflation. In the absence of demand-driven inflation, the US Federal Reserve’s signal to slow down consumption and investment is on track to seriously disrupt economic conditions.
This may reflect lower demand for products from many retailers, particularly apparel retailers, whose momentum is heavily influenced by the business cycle.
Since this isn’t the best time for apparel retail stocks, investors should consider trimming their positions in many of them.
The Buckle, Inc. Sales Are Slowing Down While Net Margins Are Shrinking
The Buckle, Inc. (NYSE:BKE) could be one of these stocks as this company’s sales and profits are shrinking while profit margins are falling. These trends do not make The Buckle one of the most resilient players in the industry to forecast the next recovery as soon as it can reasonably be expected.
These trends are far from encouraging and are illustrated in the table and two graphs below.
Year-to-year growth rates of total revenue become progressively smaller from 12 months in July 2021 to 12 months in July 2022. Also, the net income margin is shrinking from the 12-month period ending January 2022.
|
The Buckle, Inc.’s’ items |
12 Months Jul 2021 |
12 Months Oct 2021 |
12 Months Jan 2022 |
12 Months Apr 2022 |
12 Months Jul 2022 |
|
Total Revenues [in billion of USD] |
1.164 |
1.233 |
1.295 |
1.306 |
1.311 |
|
Total Revenues YoY Growth Rate |
5,93% |
5,03% |
0,85% |
0,38% |
|
|
Earnings From Continuing Operations [in million of USD] |
216 |
237 |
255 |
253 |
252 |
|
Net Income Margin |
18,56% |
19,22% |
19,69% |
19,37% |
19,22% |
The below graphic shows sales calculated over the trailing 12 months to the most recent quarter ended July 29, 2022, with the year-on-year increase decreasing over time, as the gold-colored line clearly shows.
seekingalpha/symbol/BKE/income-statement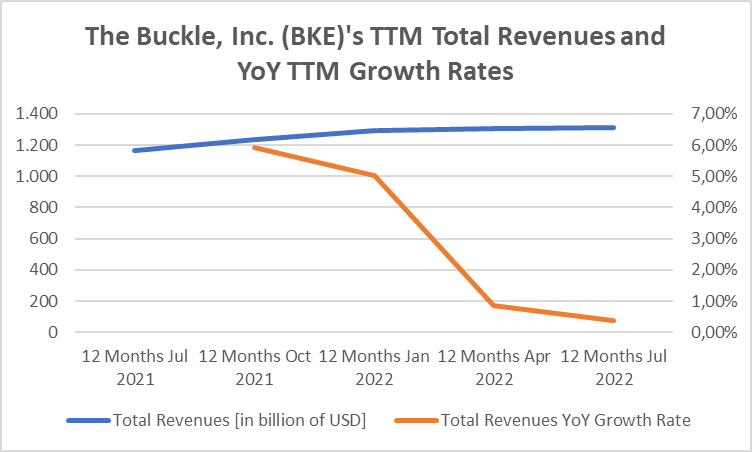
The second chart below shows declining profits from continuing operations coupled with a sharp drop in TTM net margin.
seekingalpha/symbol/BKE/income-statement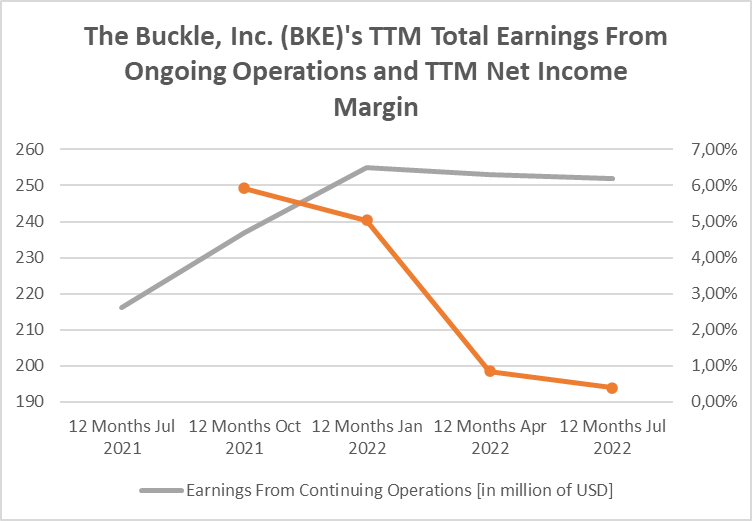
While the table below also highlights trends that The Buckle, Inc. shareholders will not like either.
The increase in the annual growth rate of net sales for the 13-week fiscal period slowed from 19.5% of fiscal 2021 vs. fiscal 2020 to 3.3% of Q1 fiscal 2022 vs. Q1 fiscal 2021 and thereafter slowed down further to 2.3% of the first half of the fiscal year 2022 compared to the first half of the fiscal year 2021.
seekingalpha/symbol/BKE/news?filter=earnings_news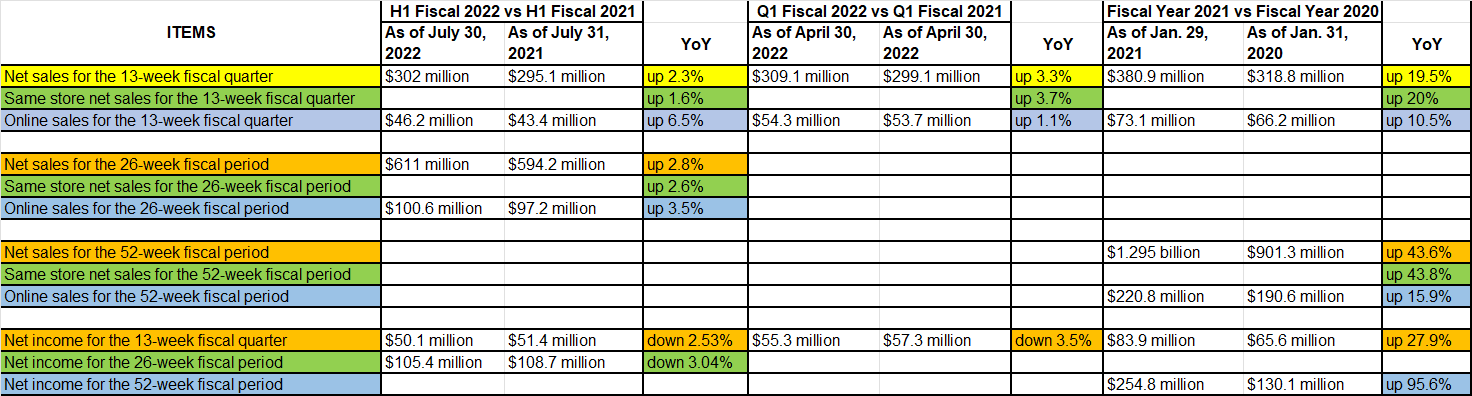
The YoY increase in net sales from the same store for the 13-week fiscal period also declined from 20% for fiscal 2021 vs fiscal 2020 to 3.7% for Q1 Fiscal 2022 vs Q1 Fiscal 2021 to 1.6% for H1 Fiscal 2022 vs H1 Fiscal 2021.
Net sales for the 26-week fiscal period for the first half of 2021 versus the first half of 2020 grew 79.3% year over year, although this pace was impacted by the COVID-19 pandemic. But in the first half of 2022, it was only 2.8% higher than in the first half of 2021.
Increases in net income also show signs of decline.
For the 13-week fiscal period, the year-over-year growth rate in net income was positive for H1 Fiscal 2021 versus H1 Fiscal 2020 and for the Fiscal Year 2021 versus the Fiscal Year 2020. These were 48.1% and 27.9%, respectively.
The year-over-year growth rate in the net income has turned negative for Q2 fiscal 2022 versus Q2 fiscal 2021 and for the H1 of fiscal 2022 versus H1 of 2021 as they were -2.53% and -3.5%, respectively.
Based on the 26-week fiscal period, the growth rate for H1 FY 2021 compared to H1 FY 2020 was a YoY increase of 374.7%. While for H1 FY 2022 vs. H1 FY 2021 the YoY growth was a negative rate of 3.04%. However, it must be noted that the first growth rate was impacted by the COVID-19 pandemic crisis.
These trends, coupled with bearish sentiment due to the Federal Reserve’s rate-hike policy, have impacted the share price, which has performed poorly so far this year. As of this writing, The Buckle, Inc. stock is down nearly 20%, but less than the S&P 500 (^GSPC), a benchmark for the stock market, which is down about 25% instead.
seekingalpha/symbol/BKE/charting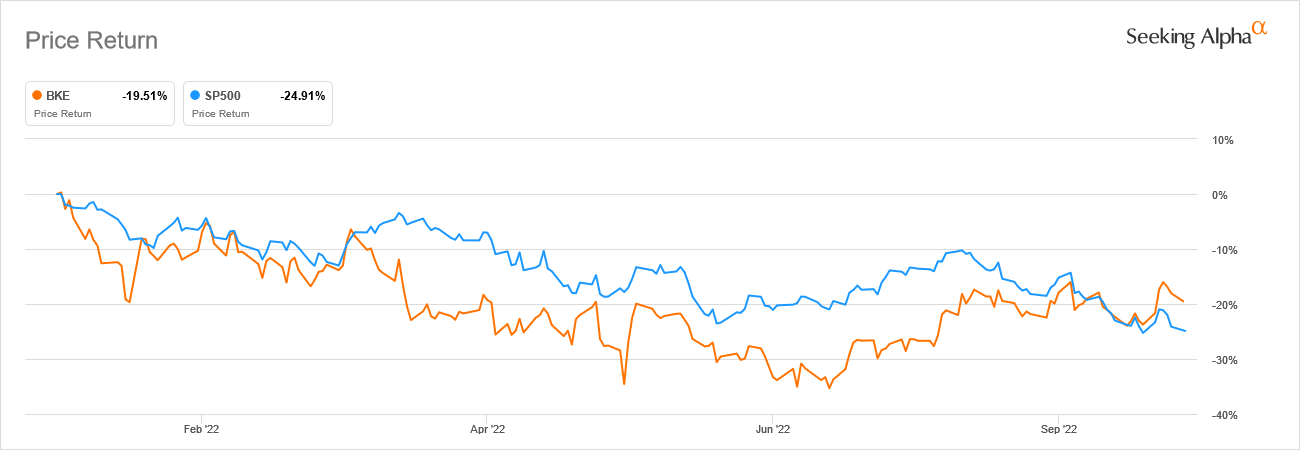
The Near Future Doesn’t Look Rosy
The near future for the Kearney, Nebraska-based company, which operates in the United States as a retailer of casual clothing, footwear and accessories for young men and women, does not look good.
Inflationary pressures are eroding the excess savings consumers have accumulated during the COVID-19 crisis through government financial aid in the form of social cheques and limited spending opportunities as a result of lockdowns and restrictions.
Neither the good levels of employment nor the wage increases employers have used to encourage workers to return to work and support the recovery from the COVID-19 crisis have prevented the additional savings of US consumers from falling dramatically. In 7 months, incremental savings decreased 43% from $2.1 trillion by the end of 2021 to $1.2 trillion in July 2022.
With record high energy bills and runaway inflation, which could continue as the rise in prices for goods and services is well entrenched, the remainder of the additional savings should be used up within a few months.
After the next spending season, without the additional savings from US consumers but with inflationary pressures lingering as the geopolitical triggers are not going to end anytime soon, The Buckle, Inc. is likely to see a further decline in demand for its products.
The company will attempt to pass on higher prices to end users to offset weaker sales volume, but this move is unlikely to be enough to avoid further net profit margin deterioration.
Analysts expect higher revenue for 2023, let’s say an increase of about 4.12% year-over-year to $1.35 billion, while earnings per share should fall 1.36% year-over-year to $5.09.
//seekingalpha/symbol/BKE/earnings/estimates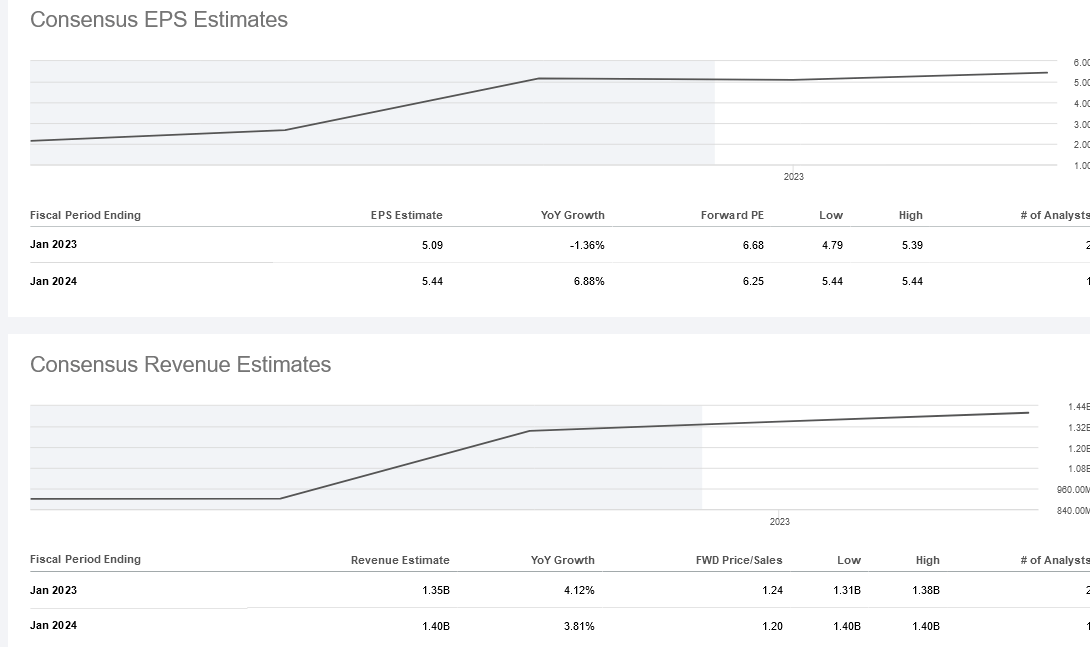
Due to lower earnings, the impact could push the stock price further below current levels, leaving no room for an optimistic recommendation rating.
Wall Street is proposing to hold this stock, but if investors showed more interest in selling some shares given the above, even with a dividend yield of around 4.1%, they can’t be blamed.
seekingalpha/symbol/BKE/ratings/sell-side-ratings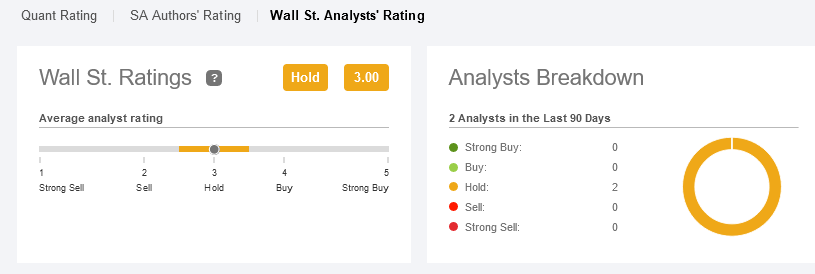
The Stock Price Could Still Go Down
At the time of this writing, The Buckle, Inc. shares are exchanging hands at $33.81 per unit for a market cap of $1.67 billion.
seekingalpha/symbol/BKE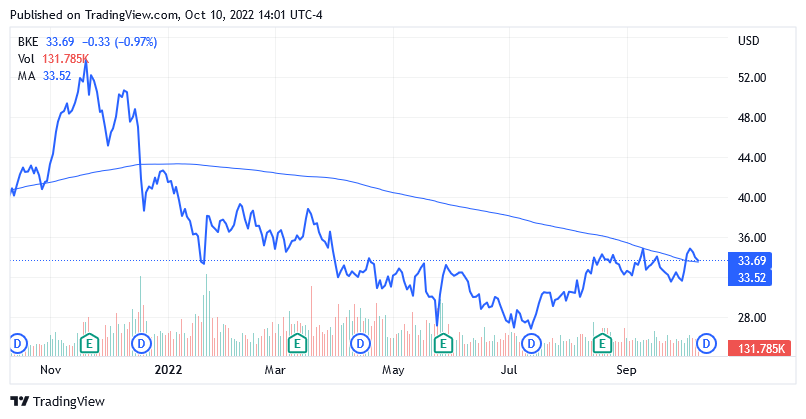
Shares are low compared to the 52-week range of $26.50 to $50.24 and the long-term trend of the 200-day simple moving average of $33.56, but these comparisons don’t imply the ongoing downtrend of the share price will not last. The likelihood of this to happen is high given the strong downward pressure from the headwinds highlighted above.
The 14-day relative strength indicator of 56.21 suggests that there is still ample room for the share price to post additional dips.
Conclusion – Uncertain Economic Prospects Are Having a Negative Impact on Sales, Margins and the Share Price
The company could experience a further decline in its sales and margins due to heightened inflationary pressures and the uncertain economic outlook.
These factors are expected to continue influencing the share price at least until the end of 2023.
Be the first to comment