

bankrx/iStock via Getty Images
By Joe Duarte
At least one Wall Street bank is calling on the Federal Reserve to raise the Fed Funds rate by 0.75%, just ahead of the central bank’s Open Market Committee (FOMC) meeting scheduled for June 14 and 15.
Meanwhile, if Friday’s mini-crash wasn’t bad enough, a projected multi-trillion-dollar options expiration is scheduled on June 17, which is likely to deliver more volatility. And it all comes in the wake of Friday’s ultra-nasty post-CPI meltdown which was made worse by terrible market liquidity resulting from, you guessed it, the Fed’s QT.
In other words, there is no good news left at all. But remember, when everyone is bearish, it often pays to be bullish. So, in today’s installment, I will put forth a scenario to describe the mechanics of what it will take to move beyond the current trading environment into a new bull market.
The Liquidity Trap
The Fed started its QT (bond selling) program on June first, to the tune of $47.5 billion per month, which will continue by the same amount in July and August. By September it’s scheduled to be selling $95 billion of combined US treasuries and mortgage-backed securities.
That’s money that’s being drained from the financial system which has no backup since it lives on cash flow, not cash on the balance sheet due to high debt levels.
That’s also money that’s no longer going into stock buybacks and speculative trading by banks. And it’s creating a liquidity trap for anyone who strays into the market while causing stock prices to fall, which as I describe below is causing trouble in the MELA system.
That means that until something extraordinary reverses this dynamic, the stock market will have to deal with increases in the Fed Funds rate and the likelihood of higher bond market interest rates and persistent illiquidity as the Fed unwinds its balance sheet.
Meanwhile, if next week’s options expiration leans to the sell side, stocks could head decidedly lower, perhaps in equally dramatic action. Check out the effect of the Fed’s QT drain on the US Ten-Year Note Yield (TNX).
Bond yields rise in response to inflation and the Fed’s rate hikes. But at some point, the bond market senses when the Fed has gone too far. The recent dip in TNX, prior to the Friday reversal, suggests that, at least for a while, the bond market was considering that possibility.
A closer look, however, suggests that TNX may be forming a double top. If that’s the case, then a case could be made for a potential reversal in rates.
It’s a Numbers Game
Let me put it this way. Price action is based on the opinion of the majority. Remember the Reddit mobs and how they crushed the hedge funds? Think of what I’m about to describe as a market-wide Reddit mob that responds to some sort of credible sign that the Fed is close to reversing its higher rate mantra.
Moreover, the new dynamic would be, at its most organic level, a mechanical event based on how complex systems work—the crowd follows a winner. So, in order for a sustainable rally to occur, four things need to happen:
- A credible sign that the Fed is done raising rates will have to appear.
- In response, there needs to be enough buying of stocks to cause short sellers to cover their short positions;
- The ensuing short-covering needs to be massive in order to move prices to a point where buyers become fearful of missing out on “the bottom;”
- And once the buyer stampede starts, it needs to grow as more traders join the buying frenzy.
Unfortunately, for the bulls, all we’ve seen of late has been short-covering without real buying. All of which leads to failing bear market rallies. See the section below on the New York Stock Exchange Advance-Decline line and the major indexes for full details of where we are at the moment.
MELA Centric Scenario Building
Regardless of where things stand at the moment, there are two plausible scenarios to consider in the future. One is that the stock market does what it always does in response to higher interest rates and with the Fed continuing to drain liquidity; it tanks. So far stocks have followed that script as the Fed began to forecast its moves in December 2021, and the bear market has unfolded. See the S&P 500 (SPX) chart below.
The other scenario is that the stock market has fallen enough or is close to having fallen enough, it shakes the Fed fear off and stocks start to move higher. Of course, that won’t happen out of the blue. And it will have to be preceded by not just concern and dismay from traders, but an all-out panic attack—even if it’s not fully played out by a colossal stock crash.
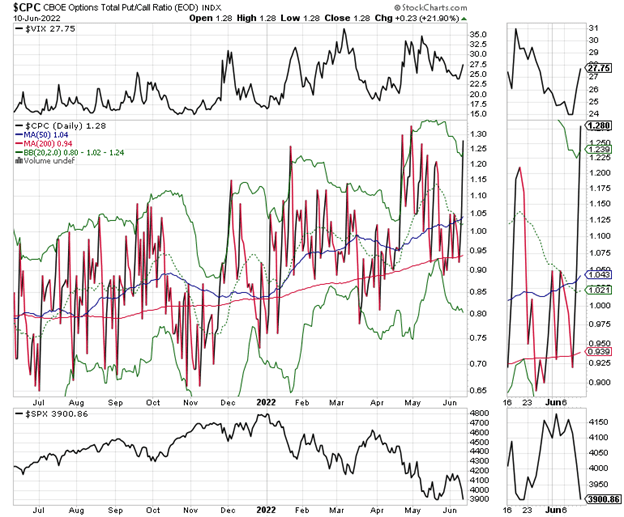
You know what I mean: a Cramer—“they know nothing” moment which leads the Fed to a “whatever it takes” QE unleashing. At this point, we see the Put/Call ratio (CPC, middle panel) rising along with CBOE Volatility Index (VIX) (upper panel). But there is no evidence that a true Cramer moment has happened yet, although one may be in the works.
But here is where the MELA angle becomes central to the theme.
Because the stock market has been falling, household wealth is shrinking. That means that in the not-too-distant future—perhaps it’s already rolling, an economic contraction becomes fully apparent.
This, in turn, would give rise to expectations for the end of the Fed’s rate hike cycle should be reversed.
It Can Happen
Remember, twenty years ago no one thought that the stock market would dictate the economy. But that’s where we are today. Indeed, who would have predicted the emergence of the MELA system where the stock market (M) is the primary influence on the economy (E) as the value of 401 (k) plans, IRAs, trading, and crypto accounts is a major influence on how people’s life decisions (L) take shape?
Now, what would make things unfold more rapidly than anyone expects is the A in MELA, which stands for Algos—artificial intelligence that runs everything from stock, bond, and commodity training to the dissemination of news.
They work at the speed of light based on a simple principle: “If this happens, do this.”
You fill in the blanks.
And yes, a reversal to the upside could come as suddenly as the bottom fell out.
Put Buyers Stick It to NYAD; Trading Volume Disappears
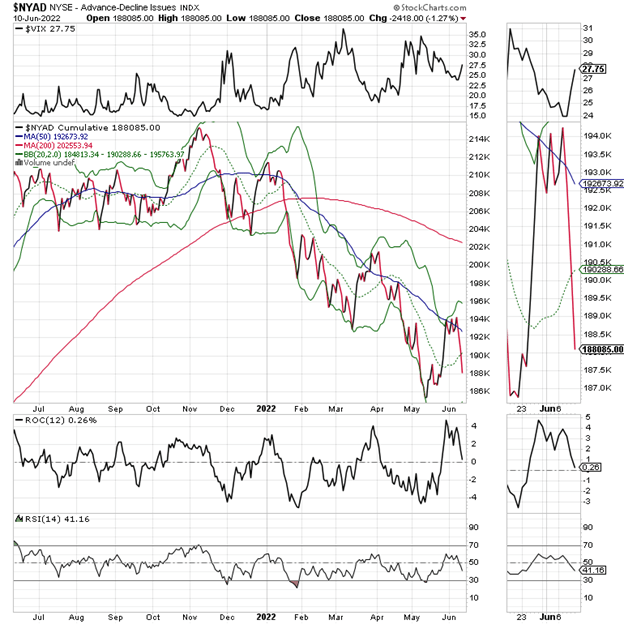
Familiar readers know that I’ve been watching the relationship between the CBOE Volatility Index (VIX) and the New York Stock Exchange Advance-Decline line (NYAD) for months now. Usually, when VIX rises, NYAD falls and vice versa.
That’s because a rise in VIX means rising put option volume, a bearish development for stocks. And after a recent pause, the relationship is back in sync as of the close on 6/10/22 as:
- NYAD crashed below its 50-day moving average while
- VIX rose although it remains well off of its recent highs
So right now, the sellers are in charge. Raw volume, however, is starting to rise, which suggests that sellers are gathering steam.
The S&P 500 (SPX) crashed through the 4000 level after failing to rise above the important resistance zone at 4100-4200. Moreover, SPX could be on its way to testing its recent lows.
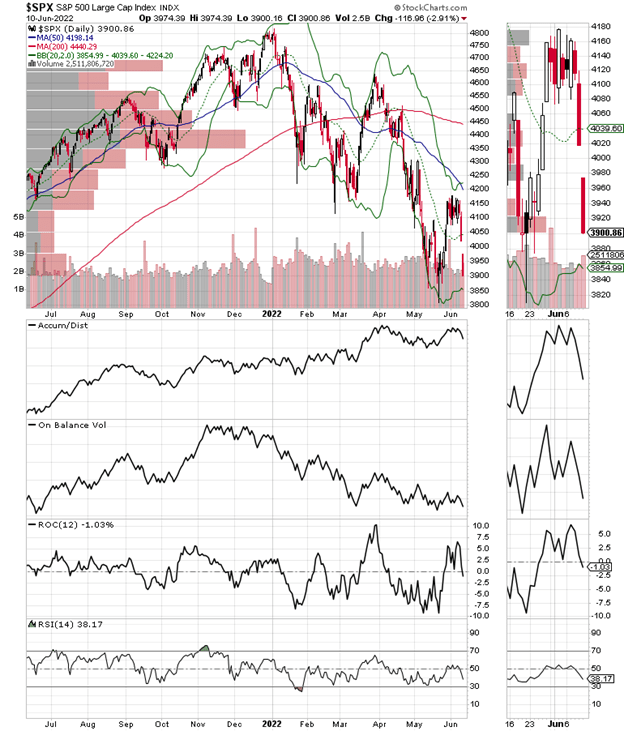
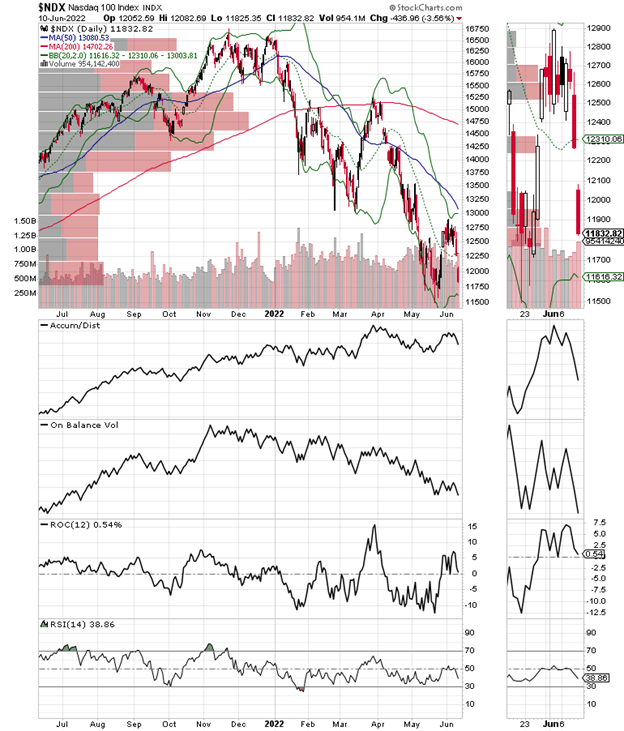
The Nasdaq 100 Index (NDX) continues to act in a similar fashion.
Originally published on MoneyShow.com
Editor’s Note: The summary bullets for this article were chosen by Seeking Alpha editors.
Be the first to comment