

Nina Shatirishvili/iStock via Getty Images
I began my investment career as a Securities Analyst Intern at Fidelity Investments during the summer of 1981.
At the beginning of June, I was asked to join Ned Johnson, the legendary Chairman of Fidelity, for lunch in his private dining room, along with the two other Summer Interns.
As we were served a gourmet meal prepared by his executive chef, Ned grilled us on our best investment recommendations. This was sort of the precursor to the Idea Dinner immortalized on Showtime’s Billions, where the top hedge fund managers in the city try to outshine each other with their brilliance and investment acumen.
Instead, we were first year MBA students, trying to impress Ned. One intern pitched the merits of the dominant consumer products companies like Procter & Gamble (PG) and Kimberly Clark (KMB). The other praised the growth prospects of the cable industry, which was the delivery mechanism for new programming channels like HBO and CNN, the recently created first 24-hour news network. They dazzled with P/E ratios, free cash flow projections and gains in market penetration.
Then it was my turn.
I was quite intimidated because Ned was an icon in the industry. He was the first superstar portfolio manager of the Fidelity Magellan Fund. He was the leading figure in mutual funds.
I wondered if Ned was asking a trick question. Fidelity was the largest mutual fund company in the country and had just surpassed $10 billion in assets under management. Eight billion dollars of that was in money market funds. Money funds were yielding 16%.
I knew that the Fed was in a tightening mode as they were battling inflation, which although it had already peaked was still in double digits. Fed Chairman Paul Volker was determined to keep money tight until inflation broke. There was an old mantra I had learned pre-business school when I worked in the money center of a commercial bank doing asset/liability management – “Don’t fight the Fed.”
With that quick analysis, I told Ned I thought money market funds at 16% looked pretty good to me.
Six months later, during my final year of business school, I was invited to the Fidelity Holiday Party in Boston. I checked in with the head of the research department before the party to say hello, and after catching up on my semester at school, he wanted to let me know that Ned had remembered my answer during that summer lunch and that the market had proven it to be correct. The stock market had declined 15% during the period while money market funds returned 8%.
I relay this story for two reasons – First, today’s environment has many similarities to the summer of 1981 and second, sometimes the most obvious answer is the right one.
We have been in a period of high inflation for more than a year. The highest inflation rate since 1981.
FRED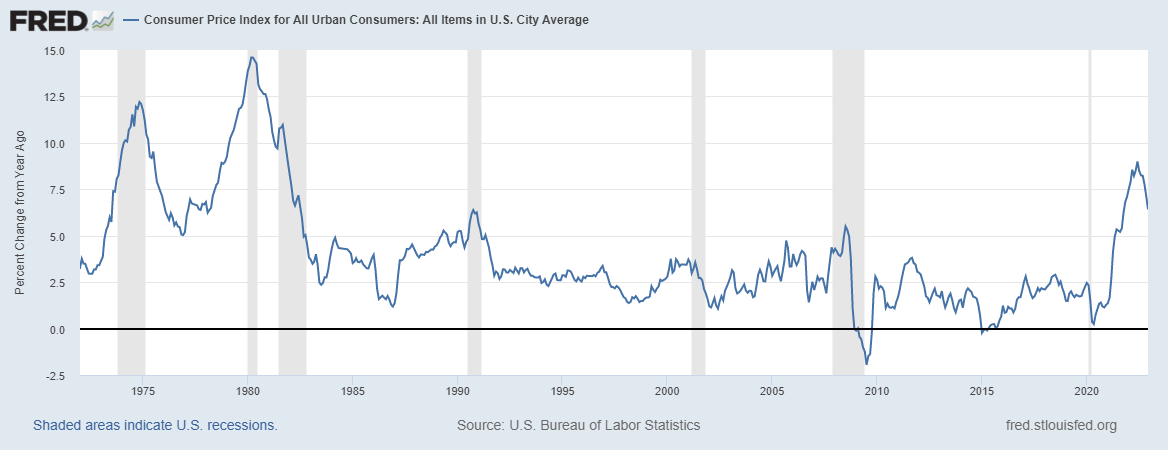
Fed Chairman Jay Powell has been insistent that the Fed will stay the course until inflation returns to the 2% target.
While there are signs that inflation may have peaked, it is still above the desired rate and there are many indications that the economy is too strong to be assured that we will hit the 2% goal on a sustainable basis. Last week’s surprise non-farm payroll increase of 517,000 new jobs in January and the 3.4% unemployment rate, the lowest in 54 years, among them.
There seems to be a disconnect between the market expectations of a Fed pivot and the Fed’s statements that rates will continue to rise and will stay elevated for some time.
That old mantra “Don’t fight the Fed” seems appropriate here.
Much of the focus has surrounded discussion of where the Fed will take rates, but this is only one part of their monetary policy.
The second part is referred to as “Policy Normalization” which is being accomplished through a reduction in the Fed’s Balance Sheet. The more common name is Quantitative Tightening (QT.) This plan was communicated in the May 4, 2022 FOMC statement and was implemented beginning in June 2022.
The Fed was to reduce their SOMA portfolio by allowing maturing securities to roll off, initially by $47.5 billion monthly for the first three months, then by $95 billion per month going forward.
The Fed now has eight full months of QT under their belt and the results, to date, have been less than originally anticipated.
Federal Reserve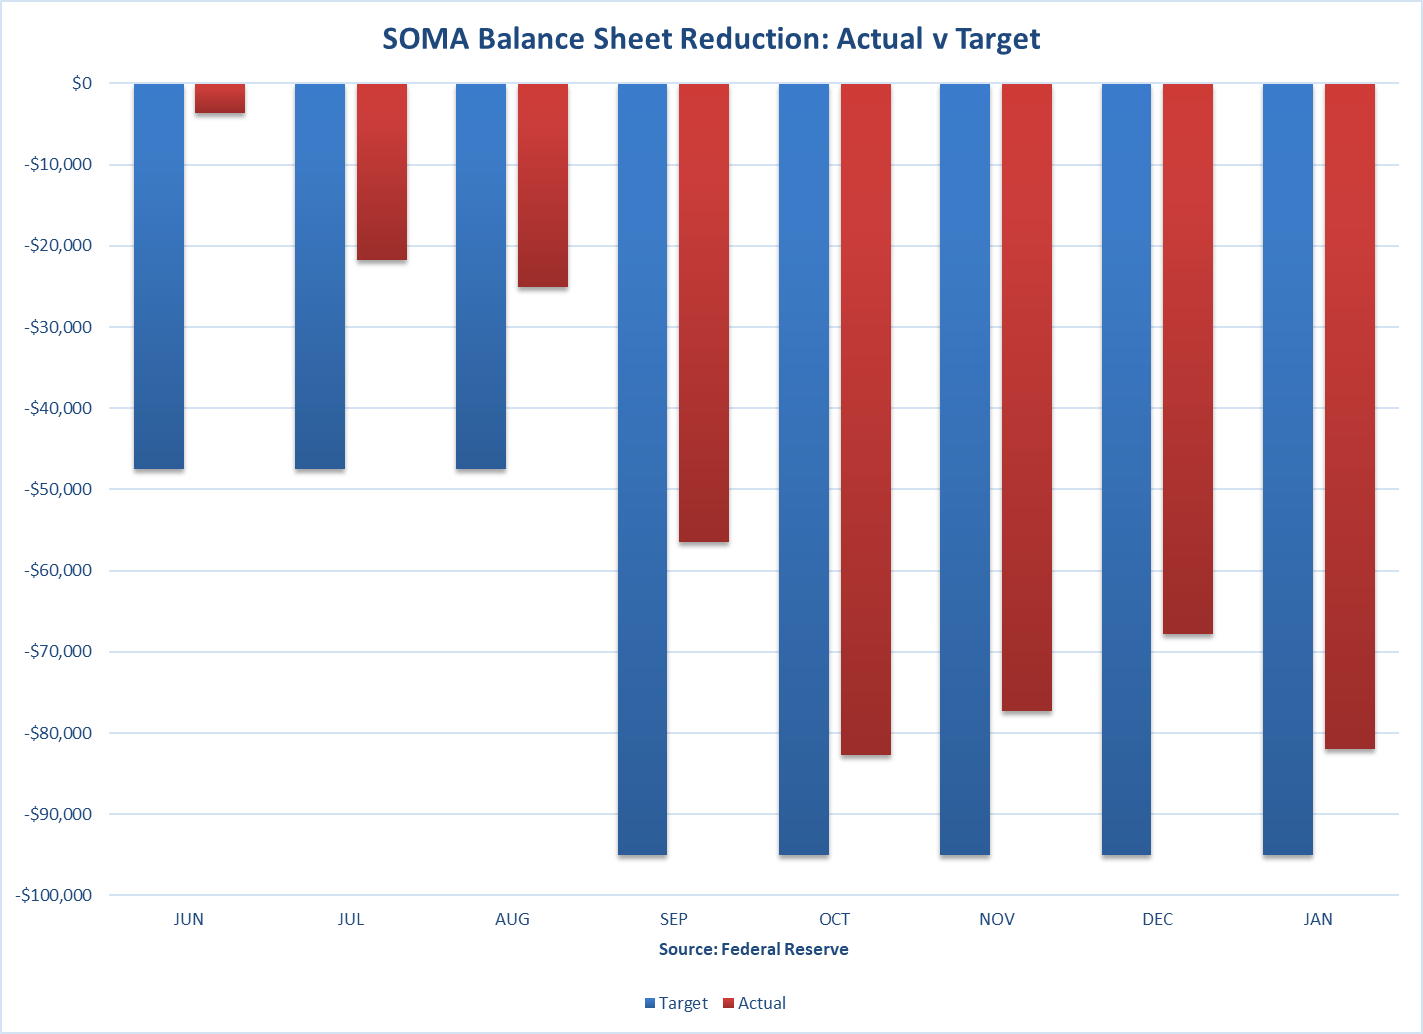
The Fed has not once yet hit their projected monthly target of security roll-offs, and cumulatively they have cut just $416.6 billion of the targeted $617.5 billion, or 67% of projections.
The Fed’s balance sheet, at $8.4 trillion, is only 6% smaller than when QT started. Although the Fed has been reluctant to explicitly state how much QT they plan, the $416.6 billion drop hardly puts a dent in their $8 trillion balance sheet expansion under Quantitative Easing. Normalization seemingly has much further to go.
FRED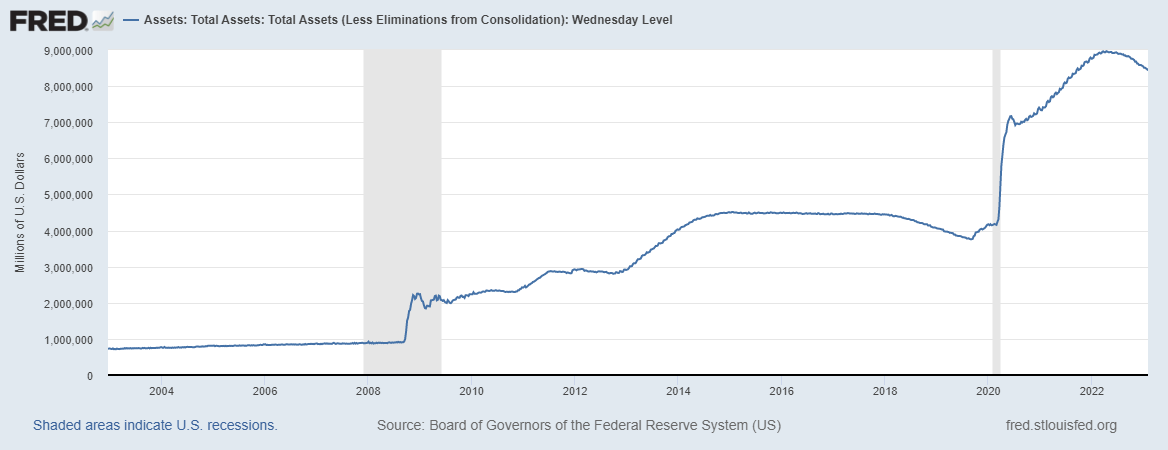
The Fed’s monetary policy in total, higher short term interest rates combined with draining bank reserves through QT creates much uncertainty as to the direction of risk assets, such as stocks and bonds. Both seem to be negatives for these assets.
The 5% Solution
In this environment, one thing is different. For the first time in 17 years, cash is offering some yield. With the Fed tightening by 450 basis points over the past year, short rates have risen significantly.
Cash has become attractive!
Six-month T-bills are hovering around 5%.
FRED
Historically, cash has been the laggard in the allocation of assets between stocks, bonds and cash.
Professor Aswath Damodaran of the Stern School of Business at NYU has compiled the most complete set of historical data for these three asset classes between 1928 and 2022. For this 95-year period the average annual return for each has been:
Stocks 9.6%
Bonds 4.6%
Cash 3.3%
The standard rule of investments is “the greater the risk, the greater the reward,” and this rule is generally true for these asset categories over the long term. Stocks are the most volatile over time, and offer the greatest average annual return, while cash is the safest investment and offers the lowest average annual return.
But for shorter periods of time, the rule does not necessarily hold.
In 2022, as in 1981, cash outperformed both stocks and bonds. In fact, this event occurs more often than one might think. Professor Damodaran’s data show that cash actually outperforms both stocks and bonds 15% of the time.
Two of the major investment luminaries currently agree on cash:
Charlie Munger, the Vice Chairman of Berkshire Hathaway, says they hold almost 20% of their portfolio in cash, one of their highest amounts ever. They hold so much cash Munger, the value investor, explains, “because there is nothing we can stand buying.”
Ray Dalio, the Chairman of Bridgewater Associates, the largest hedge fund in the world, who has been a longtime adherent of the “cash is trash” philosophy, recently changed his tune. Just last week he was quoted on CNBC saying cash has become “pretty attractive” relative to both stocks and bonds.
With much uncertainty as the Fed continues on its tightening policy to return inflation to the desired 2% level, the 5% solution – cash, just might be the way to go.
Be the first to comment