

peshkov
Stocks are off to the races again, up almost 6% in two days, the best two-day rally since April 2020.
- the best start to October since 1930
YCharts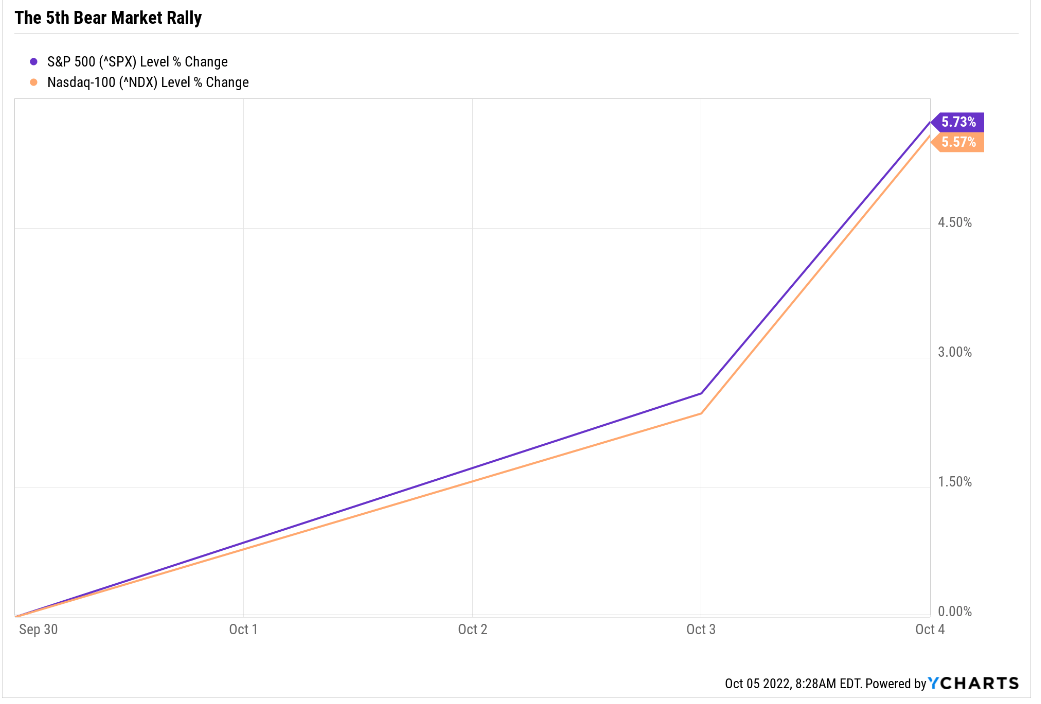
Some of these gains, in deep value blue-chips are fundamentally justified, and sanctified by math and logic.
But the broader market rally? I think that’s based largely on the most absurd hopium theory the market has dreamt up yet.
The theory goes, at least according to FactSet, that global central banks are going to have to stop hiking soon and even start cutting interest rates.
Why? Because of a significant slowing in global economic growth, or even downright severe recessions in the UK and Europe.
In the US, the latest Jobs Openings And Labor Turnover Survey or JOLTS report showed 1 million fewer jobs in August than expected, though no significant change in hirings or firings.
Along with a sharp decrease in long-term bond yields in recent days, this has the market feeling euphoric, betting on a “soft landing”.
What is a soft landing?
- growth slows enough to cause inflation to collapse
- so the Fed pauses at a lower peak Fed funds rate than currently expected
- and the Fed starts cutting much earlier than expected (2024)
- economic growth is strong enough to still drive 8% to 9% EPS growth next year
In other words, it’s a dream scenario in which we get just enough growth for stocks to do well but not enough growth for rates to keep rising.
Morgan Stanley’s Chief Investment Officer Mike Wilson was on Bloomberg recently and put it very aptly when commenting on this most recent hopium-induced rally.
That light you see at the end of the tunnel, is actually a freight train.”
How likely is a soft landing? How likely are earnings to grow at 8% to 9% next year?
First, let’s address the issue of the Fed and whether or not it will actually pause shallower and faster than expected.
The Fed has made it very clear the only thing it currently cares about is inflation. Specifically, Jerome Powell said at the last press conference that the Fed plans to hike until the Fed funds rate is above the core inflation rate.
Cleveland Federal Reserve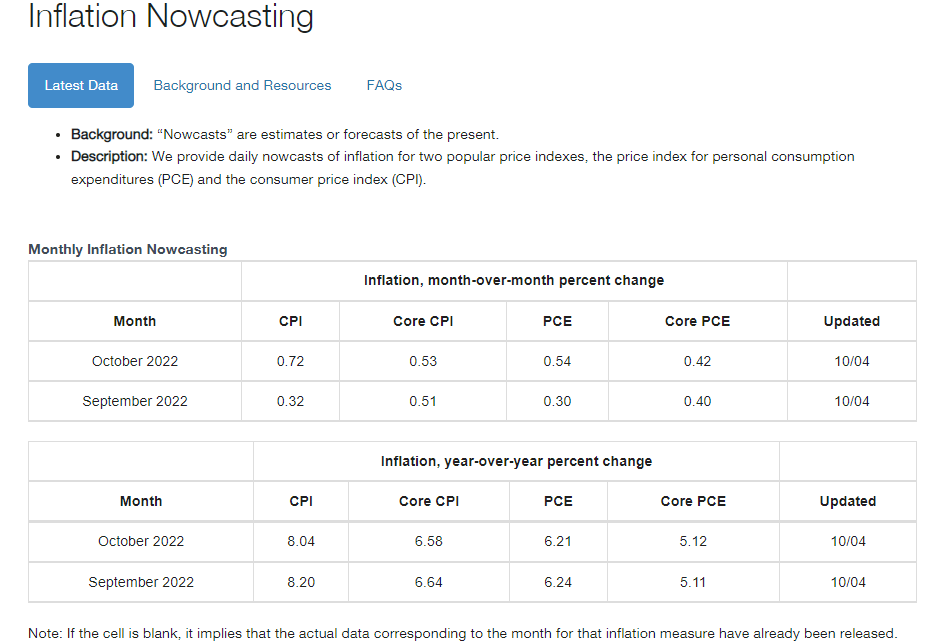
Core PCE, the Fed’s official inflation metric, is 4.9% and by the end of the month expected to rise to 5.1%. By the end of November it’s expected to also be 5.1%.
The Fed will have to make the next two rate decisions based on just these next two reports, and so is likely to hike 1.25% by year-end, just as the latest Dot plot shows.
CME Group 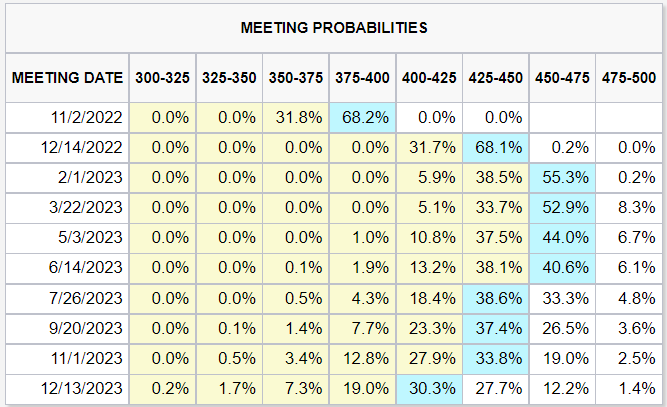
The bond market is now aligned with the Fed, with the exception of a potential 25 basis point rate hike to 4.25% in July. According to the “smart money” on Wall Street, the “pivot” the market is so excited about right now, is the Fed staying at 4.25% through the back half of next year.
- That’s a 1.25% higher rate than we have now
Does this sound like a reason for stocks to be screaming higher? To me, it sounds like a market desperate for any reason to get back to its “FOMO” mentality of the last 14 years.
What about the soft landing that the market is now expecting?
(Source: Dividend Kings S&P 500 Valuation Tool, New York Federal Reserve, CNBC, Bloomberg)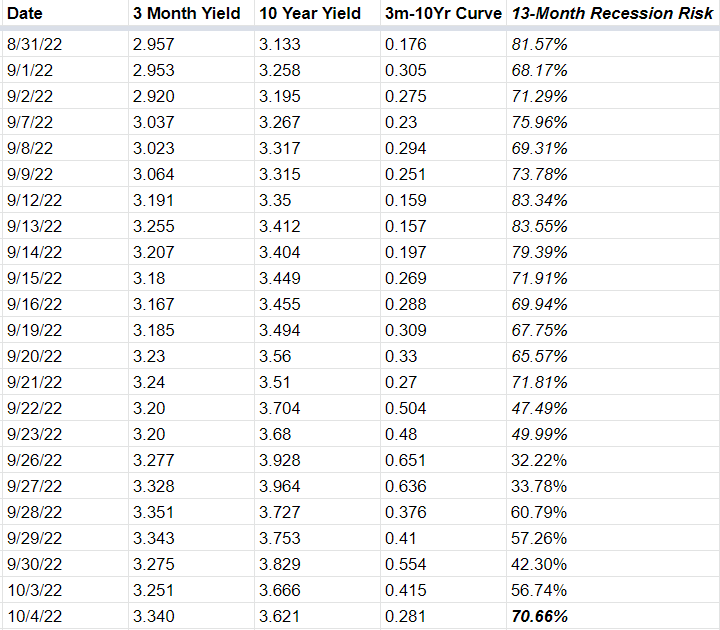
The bond market, via the 3m-10yr yield curve, the most accurate recession forecasting tool ever devised (according to studies from the New York, Cleveland, Dallas, and San Francisco Feds), is now estimating a 71% risk of a recession within 13 months.
- Toronto-Dominion’s economists now expect an average recession, not a mild 6-month one
So, let’s assume that “no recession” = EPS growth of 8% to 9% next year (not justifiable, by the way).
Even if we’re being very generous and bullish on earnings outlooks next year, the probability of the market’s dream scenario is currently 29%.
When you’re facing a long shot such as that, it makes perfect sense for the market to scream higher right?
Citi strategist Scott Chronert cut his year-end target from 4200 to 4000 and set a 2023 year-end target of 3,900.” – FactSet
Citi agrees with Morgan Stanley and Goldman that earnings estimates are still way too high. As a result, they think the market finishes 2023 at 3,900, just 4% higher.
But Citi doesn’t expect a recession (neither does Moody’s or Morgan Stanley). That’s simply due to weaker EPS growth courtesy of the UK and EU recession, very slow growth in China, and the US growing around 1% to 1.5%.
What if we get a mild recession and EPS contracts 11% to 20% next year, as some blue-chip economists think is likely?
In that case, the blue-chip consensus is for the S&P to bottom at -35% to -40% from all-time highs in about six to 12 months. What does that mean for investors contemplating buying the broader market today?
S&P Correction Watch
| All-Time High | 4,819 |
| Current | 3,783.85 |
| Distance From High | 21.48% |
| Pullback Level | 4578.05 |
| Correction Level | 4337.10 |
| -15% Correction Level (Historically Average Correction Bottom) | 4096.15 |
| Bear Market Level (-20%) | 3855.20 |
| -25% Bear Market | 3614.25 |
| -30% Bear Market | 3373.30 |
| -35% Bear Market | 3132.35 |
| -40% Bear Market | 2891.40 |
| Distance To Pullback | -16.5% |
| Distance To Correction | -11.5% |
| Distance To 15% Correction | -8.3% |
| Distance To Bear Market | -1.89% |
| Distance To -25% Bear Market | 4.5% |
| Distance To -30% Bear Market | 10.9% |
| Distance To -35% Bear Market (Average Historical Recessionary Bear Market Low -36%) | 17.2% |
| Distance To -40% Bear Market | 23.6% |
| Decline To Historical Fair Value | -5.4% |
(Source: Dividend Kings S&P 500 Valuation Tool)
If earnings don’t contract any from today’s optimistic levels, then stocks are 5% undervalued.
If we get a mild to average recession (the consensus among the world’s most accurate economists and the bond market), then stocks likely have 17% to 24% more to fall from here.
- with the most likely bottom historically coming in Q1 2023 to Q3 2023
The average historical recessionary bear market bottoms halfway through the actual recession. In this case, the consensus is for a mild six-month recession to begin in Q3 and thus a potential bottom in the 2nd half of the next year.
In the stagflation hell scenario, courtesy of Societe Generale and UBS, stocks bottom at -48% to -53% in 2024 or even 2025.
The good news is that this worst-case scenario is a very low-probability event.
The bad news for anyone hoping for a V-shaped recovery is that we haven’t even begun phase two of this bear market.
- phase one: inflation/interest rate shock (P/E contraction only)
- phase two: growth shock (earnings growth falls short of expectations)
- phase three: recessionary growth contraction (earning growth is negative)
This is not the end. It is not even the beginning of the end. But it is, perhaps, the end of the beginning. Winston Churchill.
What Smart Investors Should Do Now
Nobody can predict interest rates, the future direction of the economy or the stock market. Dismiss all such forecasts and concentrate on what’s actually happening to the companies in which you’ve invested.”— Peter Lynch
Wall Street runs on probabilities, speculative rallies like this on certainties about dream scenarios.
The probability of that dream scenario is less than 29%.
So does that mean that stocks are doomed to fall another 17% to 24%? No, it means that’s the most likely outcome, given the best available data we have today.
So that means to sell everything now and sit in cash, right? Until we hit -35% to -40% in the S&P, right? No.
Charlie Bilello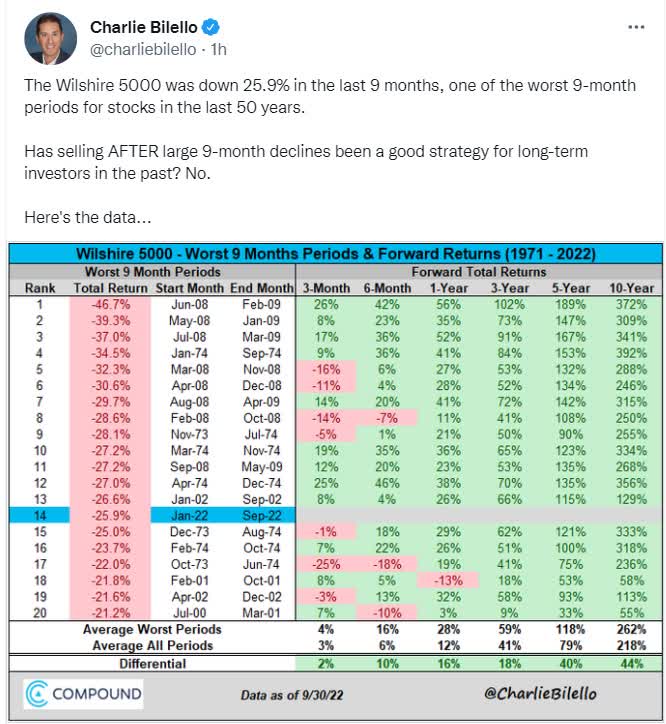
How many investors who had at least 3 years to wait out bear markets like this one have regretted selling? All of them, even those in the 70s stagflation hell market crashes.
How many regretted just sitting in blue-chips and collecting dividends? None.
Bank of America 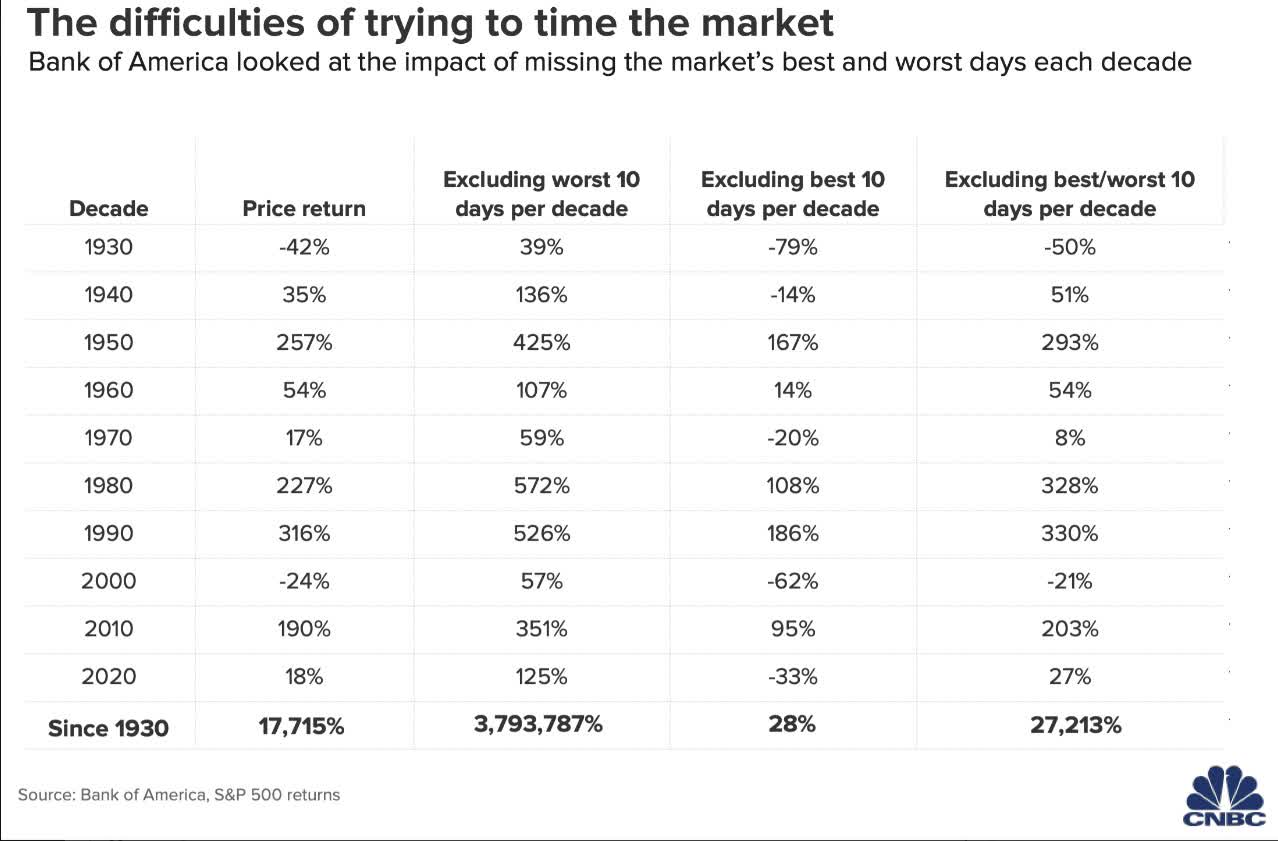
How much of the market’s long-term returns come from just the best 10 single-day gains of each DECADE? 99.84% since 1930.
How many of those come within 2 weeks of the worst-single day losses? 80%.
How many come within bear markets? Nearly 100%.
Believe it or not, making money in stocks is virtually impossible unless you own them through the entire economic cycle.
The only alternative to buying and hold? Perfect market timing to avoid the worst daily losses, or simply the most volatile 10 days of each decade, good or bad.
What are the odds of being able to do that?
- approximately 1 in 9.12*10^115
- there are an estimated 10^82 atoms in the entire universe
So what the data makes very clear is that if you want to retire rich or retire at all, you need to stay invested in blue-chip stocks… especially during bear markets.
Don’t believe me? Does the siren song of market timing still tempt you?
JPMorgan Asset Management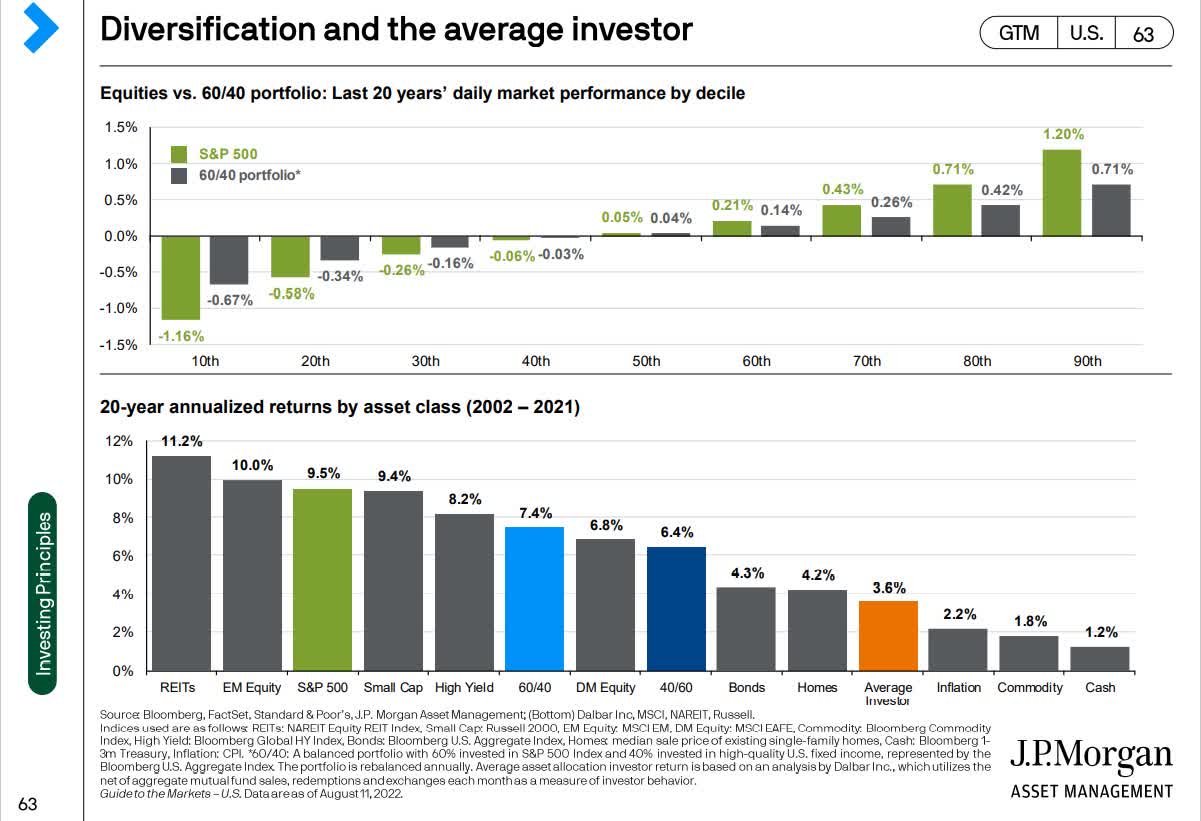
Over the last 20 years, the average retail investor underperformed buy and holding the S&P or even a 60/40 or 40/60 portfolio by a considerable amount.
That’s 100% due to market timing.
Dalbar 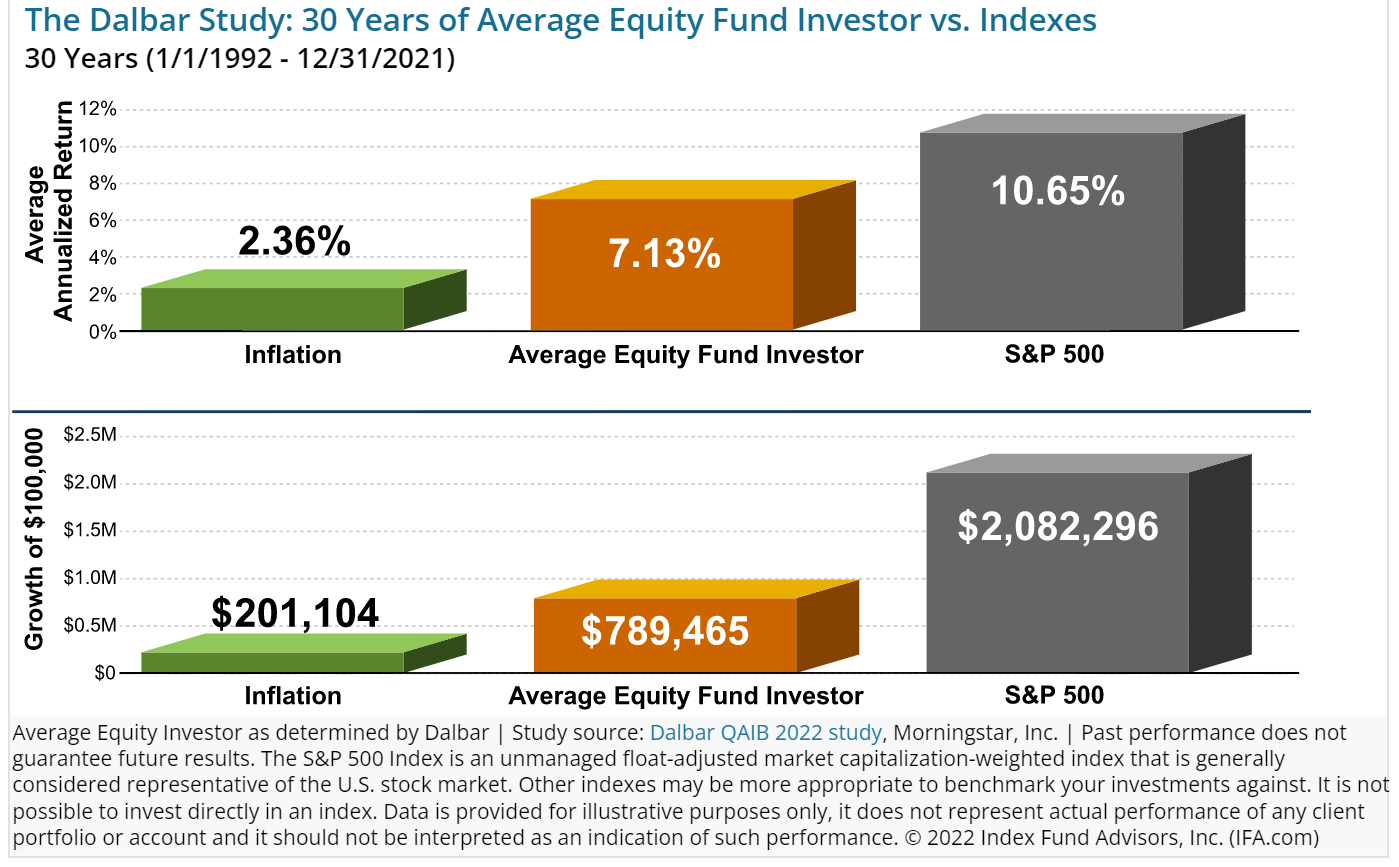
Over the last 30 years, the average investor did a bit better, underperforming the market by 33% instead of 66%. But they still left $1.3 million in gains on the table per $100K initial investment.
That’s also due to market timing.
But don’t despair because there is a gloriously satisfying solution.
High-Yield Dividend Aristocrats: A Great Way To Protect Your Savings And Sanity In Bear Markets
So let’s review. If you want to retire rich or retire at all, you probably need blue-chip stocks.
- the best performing asset class in history
- 7% CAGR inflation-adjusted returns over the last 20 years, 50 years, 90 years, 122 years, and 206 years
You also can’t miss any of the best single-day gains, almost all of which come in a bear market.
That means you need to own blue-chips AND ride out the bear markets.
Unless you’re rich enough to be able to live off less than 1% real returns from cash, that’s just the mathematical fact of life when it comes to retirement planning.
This is where high-yield aristocrats can help you protect your savings and sanity in bear markets.
S&P 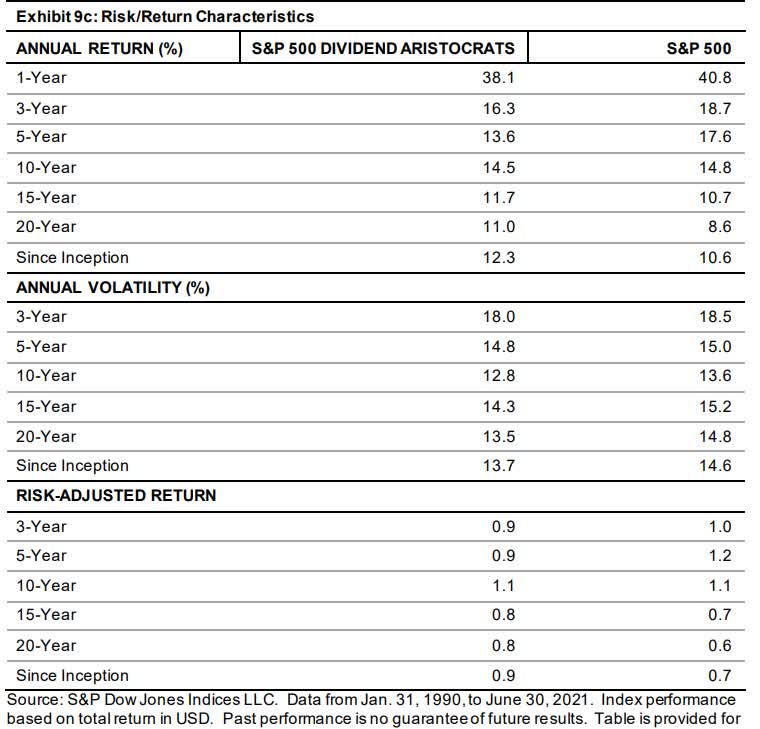
Aristocrats tend to outperform the market over time, with lower volatility.
And high-yield aristocrats?
Bank of America 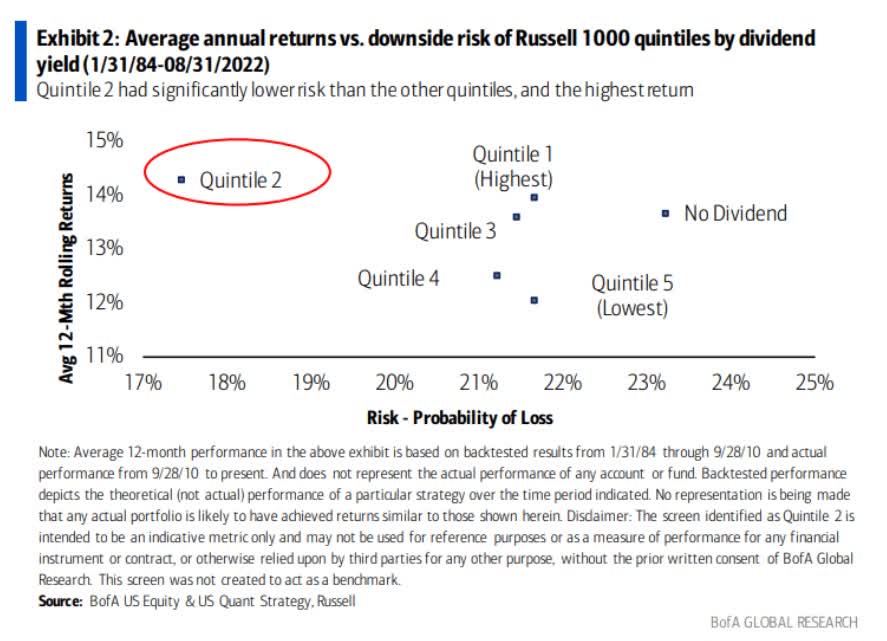
The highest yielding stocks deliver the 2nd best historical returns and with below-average volatility.
And if it’s a high-yield aristocrat? Then it’s been not just paying a generous dividend since 1997 (through at least three recessions and two economic crises) but raising its dividend in even the most extreme economic shocks.
High-yield aristocrats are literally the perfect long-term investment to ride out a bear market… or take advantage of the 29% probability of a soft landing.
How To Find The Best High-Yield Aristocrats For What’s Coming Next… In 3 Minutes
I use the Dividend Kings Zen Research Terminal to screen companies for every article. The Zen Research Terminal runs off the Dividend Kings 500 Master List.
The DK 500 Master List is one of the world’s best watchlists, including
-
every dividend aristocrat (S&P companies with 25+ year dividend growth streaks)
-
every dividend champion (every company, including foreign, with 25+ year dividend growth streaks)
-
every dividend king (every company with 50+ year dividend growth streaks)
-
every foreign aristocrat (every company with 20+ year dividend growth streaks)
-
every Ultra SWAN (wide moat aristocrats, as close to perfect quality companies as exist)
-
40 of the world’s best growth stocks
So let me show you how I could easily screen for the best high-yield aristocrats for whatever is coming next with the market in just three minutes.
| Step | Screening Criteria | Companies Remaining | % Of Master List |
| 1 | Reasonable Buy, Good Buy, Strong Buy, Very Strong Buy, Ultra Value Buy (Never Overpay For Stocks) | 394 | 78.17% |
| 2 | Dividend Champion List (all stocks with 25+ year streaks, including foreign ones) | 102 | 20.24% |
| 3 | 3+% Yield (Vanguard’s Definition of High-Yield) | 44 | 8.73% |
| 4 | 8+% Consensus LT Total Return Potential | 38 | 7.54% |
| 5 | 70+% quality score (blue-chip quality or better) | 30 | 5.95% |
| 6 | 60+% dividend safety (4% or less risk of dividend cut in severe recession) | 30 | 5.95% |
| 7 |
Add “annual volatility” to columns |
||
| 8 |
Sort By lowest to highest annual volatility |
||
| 9 | Select the 13 lowest volatility aristocrats | 13 | 2.58% |
| 10 | Use the watchlist feature to create a watchlist of just those 13 low volatility, high-yield aristocrats | 13 | 2.58% |
| Total Time | 3 minutes |
Now let’s take a look at these high-yield, low-volatility dream aristocrats.
The 12 Best High-Yield Dividend Aristocrats For What’s Coming Next
(Source: Dividend Kings Zen Research Terminal)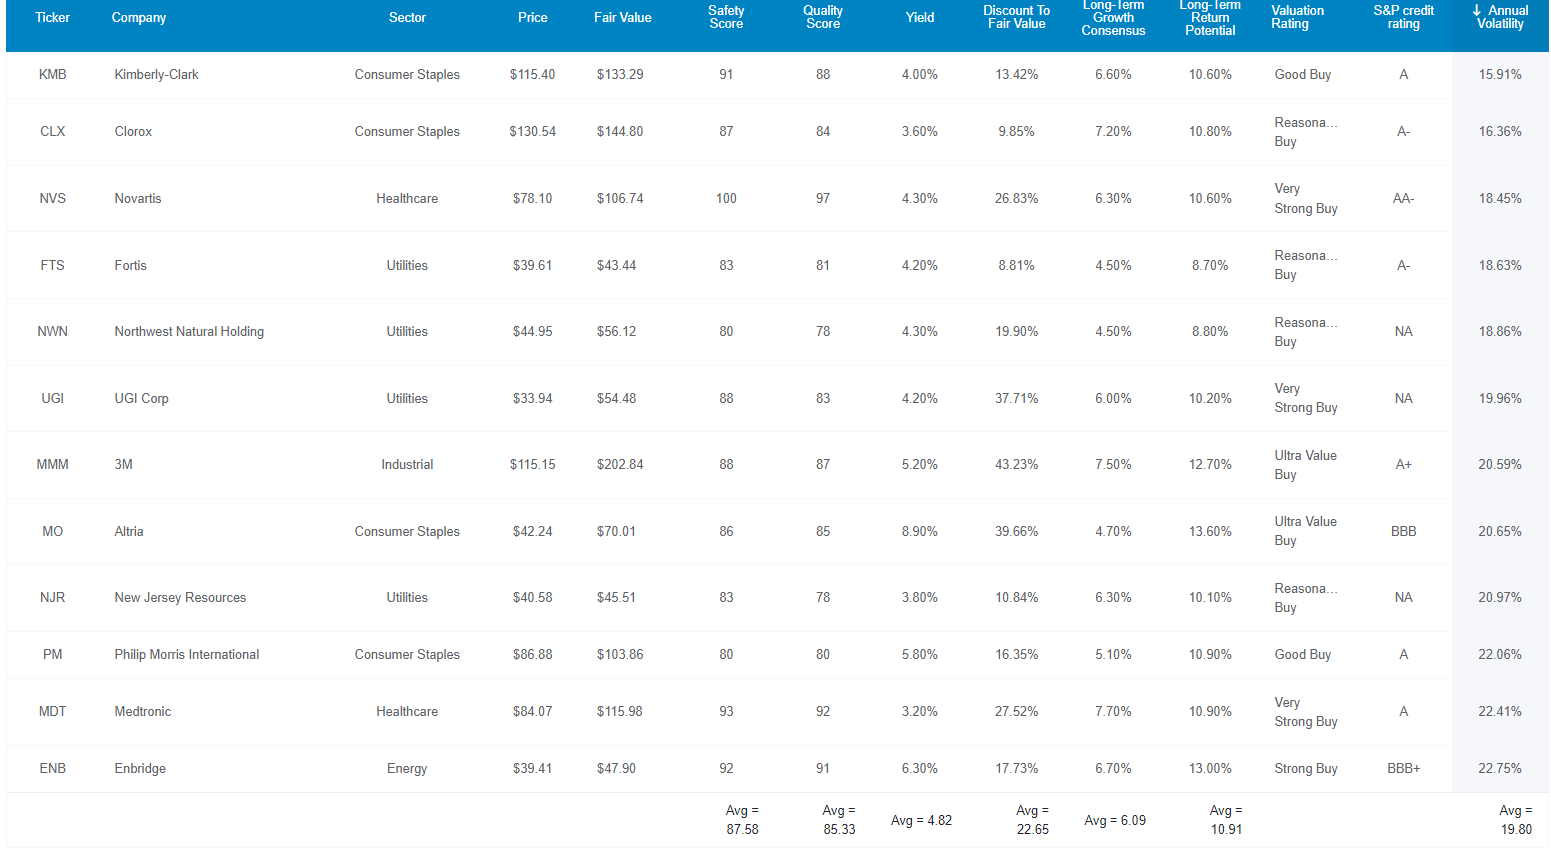
I’ve linked to articles about each company’s investment thesis, growth outlook, risk profile, valuation, and total return potential.
Here they are in order of lowest to highest annual volatility.
Tax Implications
- ENB, and FTS are Canadian companies
- 15% dividend tax withholding ONLY IN TAXABLE ACCOUNTS
- NOT in retirement accounts
- tax credit available in US taxable accounts to recoup the withholding tax
- NVS is Swiss
- 15% tax withholding for US investors
- BUT requires paperwork with your broker otherwise, it’s 35%
- own NVS in a taxable account to qualify for the tax credit and recoup the dividend withholding
- own ENB and FTS in retirement accounts to avoid the withholding tax
Quality And Safety You Can Trust In Any Economy
(Source: Dividend Kings Zen Research Terminal)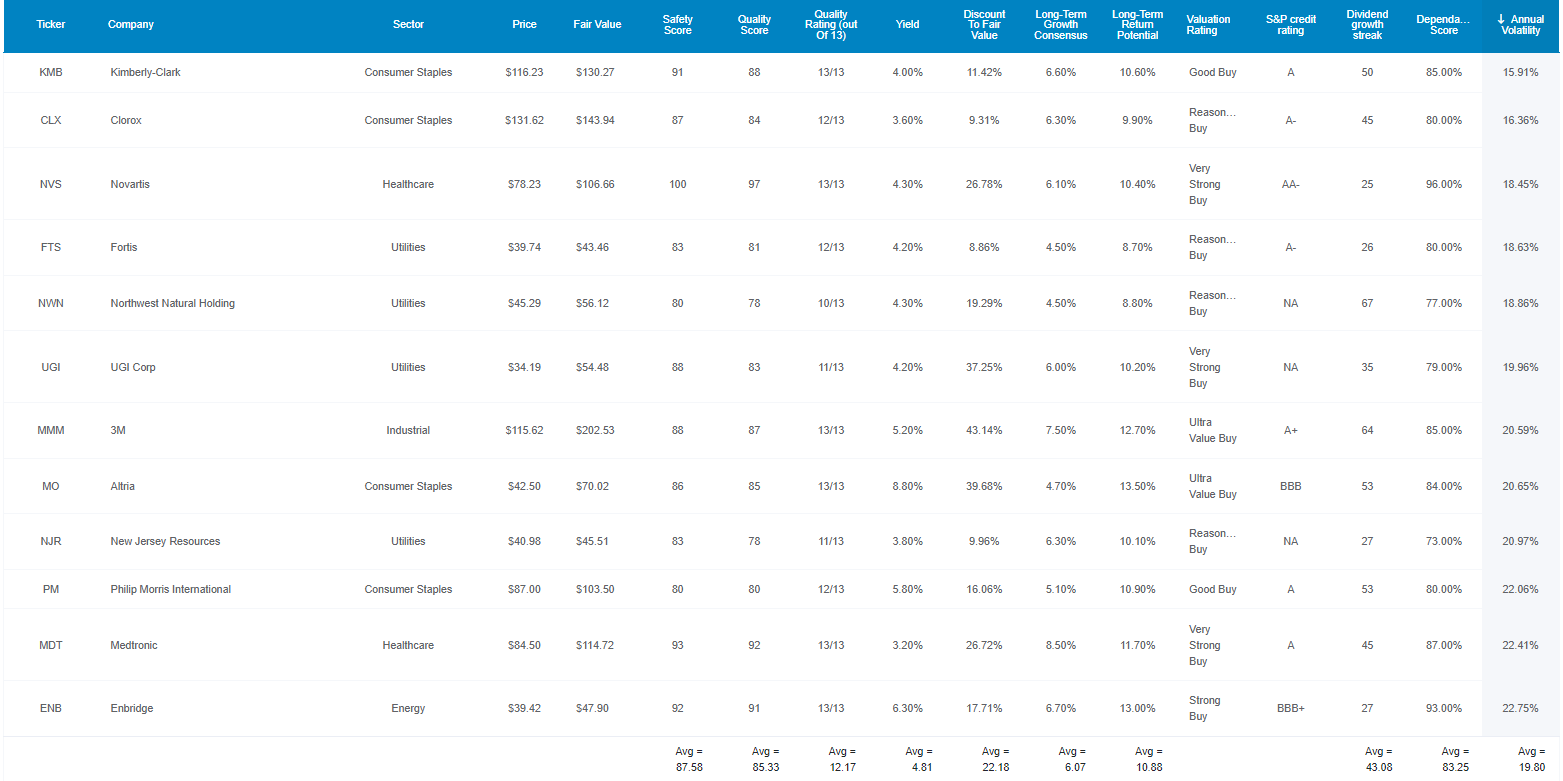
For context, the average standalone company has 28% annual volatility and the average aristocrat 24%.
These ultra-low volatility aristocrats average 19.8%, and as you’ll see later, combine to deliver 12% volatility combined.
More importantly, they are 12/13 quality Super SWANs, a higher caliber of blue-chip. How can we tell? By comparing their safety and quality fundamentals to the bluest of blue-chips, the Super SWAN dividends aristocrats.
Safety And Quality Similar To Super SWAN Dividend Aristocrats
| Metric | Dividend Aristocrats | 12 Ultra-Low Volatility High-Yield Dividend Aristocrats |
Compared To Aristocrats |
| Quality | 87% | 85% | 98% |
| Safety | 90% | 88% | 98% |
| Average Recession Dividend Cut Risk | 0.5% | 0.5% | 100% |
| Severe Recession Dividend Cut Risk | 1.50% | 1.60% | 107% |
| Dependability | 84% | 83% | 99% |
| Dividend Growth Streak (Years) | 44.8 | 43.1 | 96% |
| Long-Term Risk Management Industry Percentile | 67%, Low Risk | 66% Low Risk | 99% |
| Average Credit Rating | A- Stable | BBB+ Stable | NA |
| Average Bankruptcy Risk | 3.04% | 4.05% | 133% |
| Average Return On Capital | 105% | 192% | 183% |
| Average ROC Industry Percentile | 83% | 86% | 104% |
| 13-Year Median ROC | 89% | 130% | 146% |
| Forward PE | 18.8 | 15.9 | 85% |
| Discount To Fair Value | 8% | 22% | 275% |
| DK Rating | Reasonable Buy | Strong Buy | NA |
| Yield | 2.7% | 4.8% | 179% |
| LT Growth Consensus | 8.7% | 6.1% | 70% |
| Total Return Potential | 11.3% | 10.9% | 96% |
| Risk-Adjusted Expected Return | 7.7% | 7.3% | 94% |
| Inflation & Risk-Adjusted Expected Return | 5.5% | 5.0% | 92% |
| Conservative Years To Double | 13.2 | 14.3 | 108% |
| Average | 119% |
(Source: Dividend Kings Zen Research Terminal)
Ben Graham considered a 20+ year dividend growth streak an important sign of excellent quality, and the aristocrats have a 44-year dividend growth streak.
These ultra-low volatility aristocrats match that with an average 43-year streak.
Joel Greenblatt achieved 40% annual returns for 21 years, focusing on quality and value, using cash-adjusted PEs and return on capital or ROC.
- ROC = annual pre-tax profits/the cost of running the business
- S&P 500 ROC is 14.6%
The aristocrats have 105% ROC, and these high-yield aristocrats have 192%, almost 2X that of their famous cousins and 13X better than the S&P average.
Their ROC is in the top 14% of their respective industries, matching the wide moat Super SWAN quality aristocrats.
Over the last 13 years, their median ROC was 130% compared to the aristocrat’s 89%.
- confirming a wide and stable or improving moat
S&P estimates the average aristocrat has a 3% 30-year bankruptcy risk, and an A- stable credit rating.
These high-yield aristocrats have a 4% 30-year bankruptcy risk and a BBB+ stable credit rating.
Seven risk rating agencies estimate these high-yield aristocrats have long-term risk management in the top 66% of their industries, matching the aristocrat’s 67th percentile risk management.
- factoring in over 1,000 fundamental metrics
- covering everything from balance sheet stability, moat stability, supply chain management, labor relations, and even climate change adaptation plans
High-Yield Aristocrats’ Long-Term Risk Management Is The 212th Best In The Master List (58th Percentile)
| Classification | Average Consensus LT Risk-Management Industry Percentile |
Risk-Management Rating |
| S&P Global (SPGI) #1 Risk Management In The Master List | 94 | Exceptional |
| Strong ESG Stocks | 73 |
Good |
| Foreign Dividend Stocks | 75 | Good |
| Ultra SWANs | 71 | Good |
| Low Volatility Stocks | 68 | Above-Average |
| Dividend Aristocrats | 67 | Above-Average |
| 12 Ultra-Low-Volatility High-Yield Aristocrats | 66 | Above-Average |
| Dividend Kings | 63 | Above-Average |
| Master List average | 62 | Above-Average |
| Hyper-Growth stocks | 61 | Above-Average |
| Monthly Dividend Stocks | 60 | Above-Average |
| Dividend Champions | 57 | Average |
(Source: DK Research Terminal)
Their risk-management consensus is in the top 42% of the world’s highest quality companies and similar to that of such other blue-chips as
- Abbott Labs (ABT): Ultra SWAN dividend king
- Hormel Foods(HRL): Ultra SWAN dividend king
- Nike (NKE): Ultra SWAN
- Alphabet (GOOG) (GOOGL): Ultra SWAN
- Honeywell (HON): Ultra SWAN
The bottom line is that all companies have risks, and these high-yield aristocrats are above-average at managing theirs.
How We Monitor Their Risk Profiles
- 204 analysts
- 5 credit rating agencies
- 10 total risk rating agencies
- 23 experts who collectively know this business better than anyone other than management
- and the bond market for real-time fundamental risk assessments
When the facts change, I change my mind. What do you do, sir?” – John Maynard Keynes
There are no sacred cows at iREIT or Dividend Kings. Wherever the fundamentals lead, we always follow. That’s the essence of disciplined financial science, the math behind retiring rich and staying rich in retirement.
Now that you know why these are some of the world’s safest and most dependable low volatility high-yield blue-chips, here’s why you might want to buy some of them today.
Wonderful Companies At Wonderful Prices
It’s far better to buy a wonderful company at a fair price, than a fair company at a wonderful price.” – Warren Buffett
The only thing better than a wonderful company at a fair price is a wonderful company at a wonderful price, which is exactly what you get with these high-yield aristocrats.
(Source: Dividend Kings Zen Research Terminal)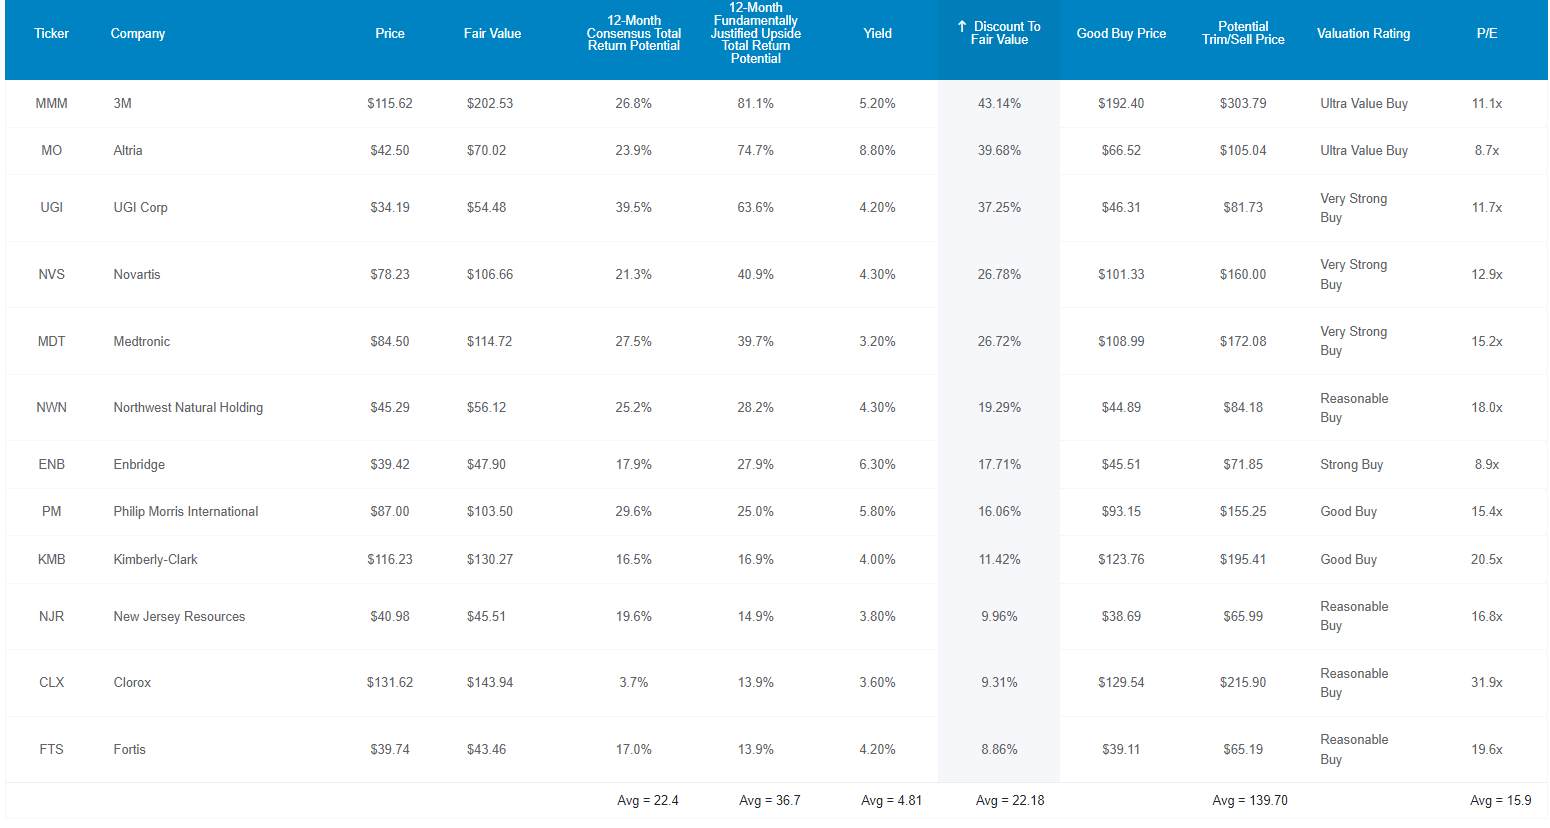
For context, the S&P 500 trades at a 16.1 forward PE, a 5% historical discount.
The aristocrats trade at 18.8X earnings, an 8% historical discount.
These high-yield aristocrats trade at 15.9X earnings, a 22% historical discount.
Analysts expect them to deliver 22% total returns within 12 months, and their 12-month fundamentally justified total return potential is 37%.
- if they all grow as expected and return to historical mid-range market-determined fair value you’ll make 37% in the next year
But my goal isn’t to help you potentially earn 22% in a year or even 37%. I want to help you achieve 11% annual returns and a potential 23X return over the next three decades.
These High-Yield Aristocrats Can Help You Retire You Retire In Safety And Splendor
(Source: Dividend Kings Zen Research Terminal)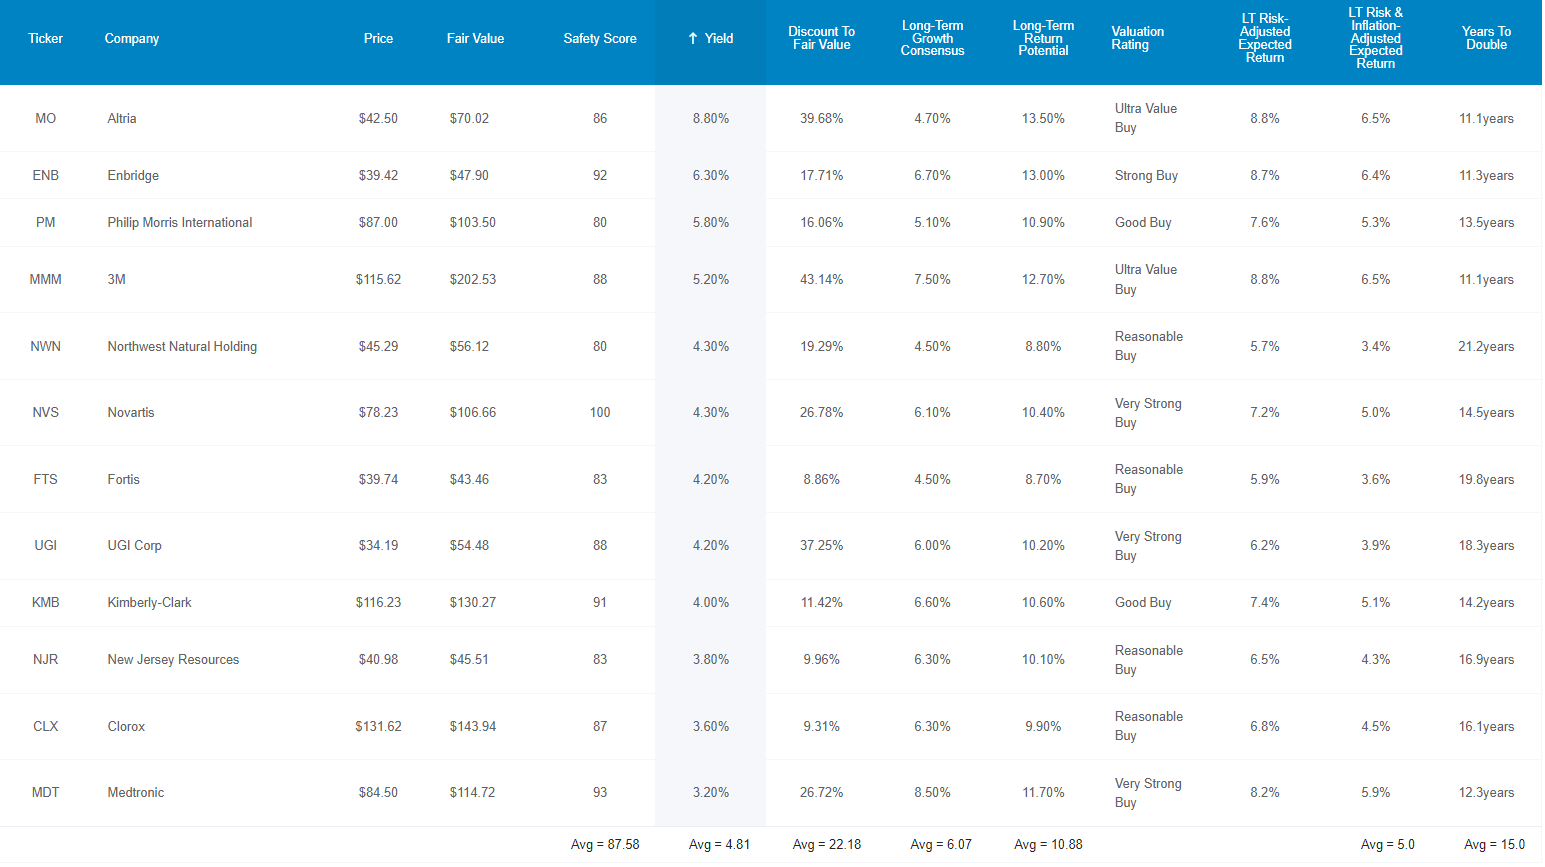
These 12 Super SWAN low volatility aristocrats offer not just one of the safest 4.8% yields on earth, but they are growing at a decent 6% rate and offer a 10.9% CAGR long-term return potential.
| Investment Strategy | Yield | LT Consensus Growth | LT Consensus Total Return Potential | Long-Term Risk-Adjusted Expected Return | Long-Term Inflation And Risk-Adjusted Expected Returns | Years To Double Your Inflation & Risk-Adjusted Wealth |
10-Year Inflation And Risk-Adjusted Expected Return |
| 12 Ultra-Low-Volatility High-Yield Aristocrats | 4.8% | 6.1% | 10.9% | 7.6% | 5.3% | 13.5 | 1.68 |
| REITs | 3.9% | 6.1% | 10.0% | 7.0% | 4.7% | 15.3 | 1.58 |
| Schwab US Dividend Equity ETF | 3.6% | 8.80% | 12.4% | 8.7% | 6.4% | 11.3 | 1.86 |
| S&P 500 | 1.9% | 8.5% | 10.4% | 7.3% | 5.0% | 14.4 | 1.63 |
(Sources: DK Research Terminal, FactSet, YCharts, Morningstar)
There are not many ways to earn a higher very safe yield than these aristocrats, and fewer still that are expected to outperform the market over time and with incredibly low volatility.
Inflation-Adjusted Consensus Return Potential: $1,000 Initial Investment
| Time Frame (Years) | 8.1% CAGR Inflation-Adjusted S&P 500 Consensus | 8.6% CAGR Inflation-Adjusted 12 Ultra-Low-Volatility High-Yield Aristocrat Consensus | Difference Between Inflation-Adjusted 12 Ultra-Low-Volatility High-Yield Aristocrat Consensus And S&P Consensus |
| 5 | $1,476.83 | $1,511.29 | $34.47 |
| 10 | $2,181.02 | $2,284.01 | $103.00 |
| 15 | $3,220.98 | $3,451.81 | $230.83 |
| 20 | $4,756.83 | $5,216.70 | $459.88 |
| 25 | $7,025.01 | $7,883.98 | $858.97 |
| 30 (retirement time frame) | $10,374.71 | $11,915.01 | $1,540.30 |
| 35 | $15,321.64 | $18,007.09 | $2,685.44 |
| 40 | $22,627.40 | $27,214.01 | $4,586.61 |
| 45 | $33,416.74 | $41,128.38 | $7,711.64 |
| 50 | $49,350.71 | $62,157.09 | $12,806.39 |
| 55 | $72,882.41 | $93,937.66 | $21,055.26 |
| 60 (investing lifetime) | $107,634.63 | $141,967.46 | $34,332.83 |
| 100 (institutional time horizon, multi-generational wealth) | $2,435,492.15 | $3,863,504.03 | $1,428,011.88 |
(Source: DK Research Terminal, FactSet)
Analysts think these 12 high-yield aristocrats could deliver 23X returns over the next 30 years, or 12X adjusted for inflation. Over an investing lifetime, they offer the potential for 142X real returns.
| Time Frame (Years) | Ratio Inflation And-Adjusted 12 Ultra-Low-Volatility High-Yield Aristocrat Consensus vs. S&P consensus |
| 5 | 1.02 |
| 10 | 1.05 |
| 15 | 1.07 |
| 20 | 1.10 |
| 25 | 1.12 |
| 30 | 1.15 |
| 35 | 1.18 |
| 40 | 1.20 |
| 45 | 1.23 |
| 50 | 1.26 |
| 55 | 1.29 |
| 60 | 1.32 |
| 100 | 1.59 |
(Source: DK Research Terminal, FactSet)
That’s slightly more than the S&P 500 over the long-term, BUT with 2.5X higher and much safer yield on day one.
And just take a look at how these aristocrats can deliver market-beating returns with volatility so low; it’s like riding over market potholes in a Rolls Royce.
Historical Returns Since April 1990 (Annual Rebalancing)
The future doesn’t repeat, but it often rhymes. – Mark Twain
In our case, “past performance is no guarantee of future results.”
Still, studies show that blue chips with relatively stable fundamentals offer predictable returns based on yield, growth, and valuation mean reversion over time.
Bank of America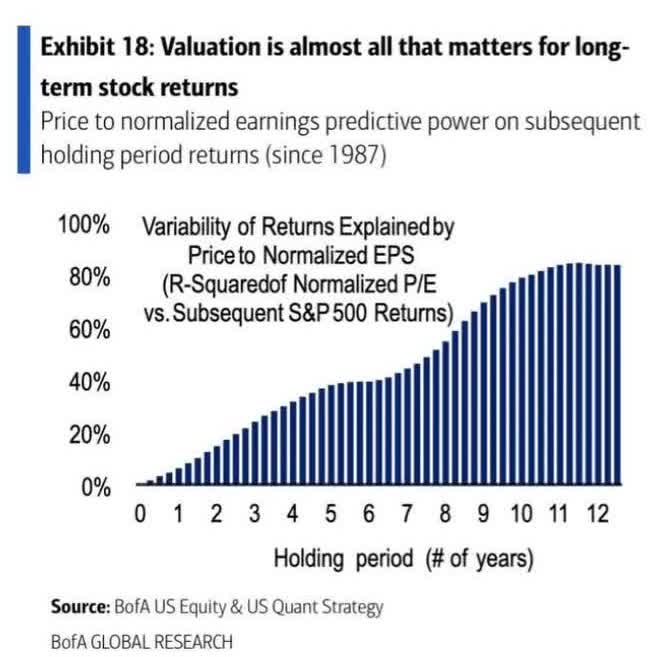
32 years is a time frame in which 97% of total returns are due to fundamentals, not luck.
(Source: Portfolio Visualizer Premium)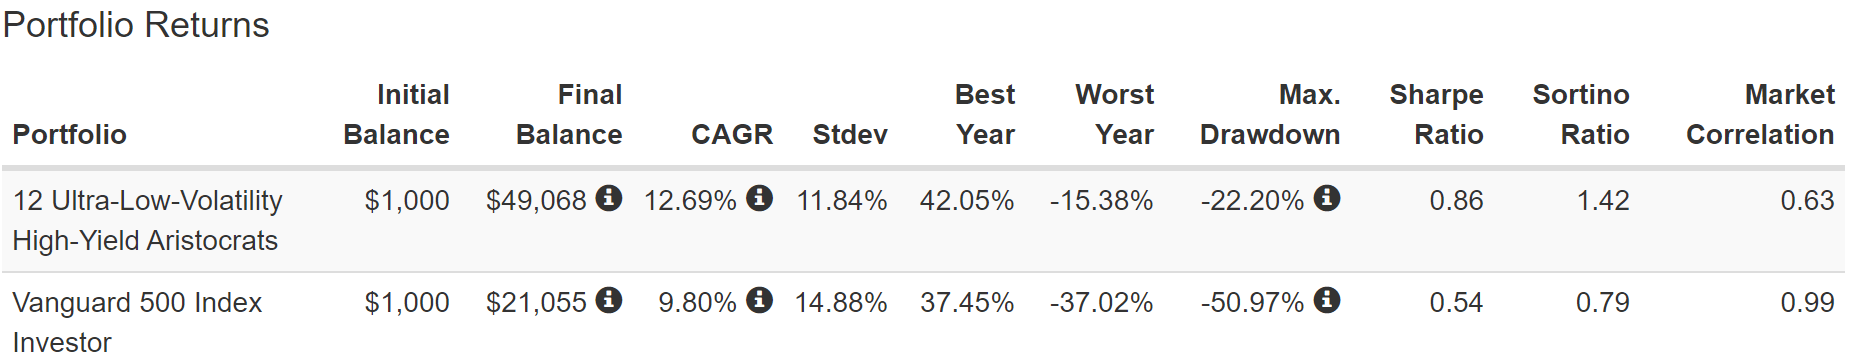
Market-beating returns with much lower volatility, of under 12% per year. And a peak decline of just 22% in the Great Recession, lower than even the 32% of a 60/40.
Double the negative-volatility-adjusted total returns of the S&P 500… for 32 years.
(Source: Portfolio Visualizer Premium)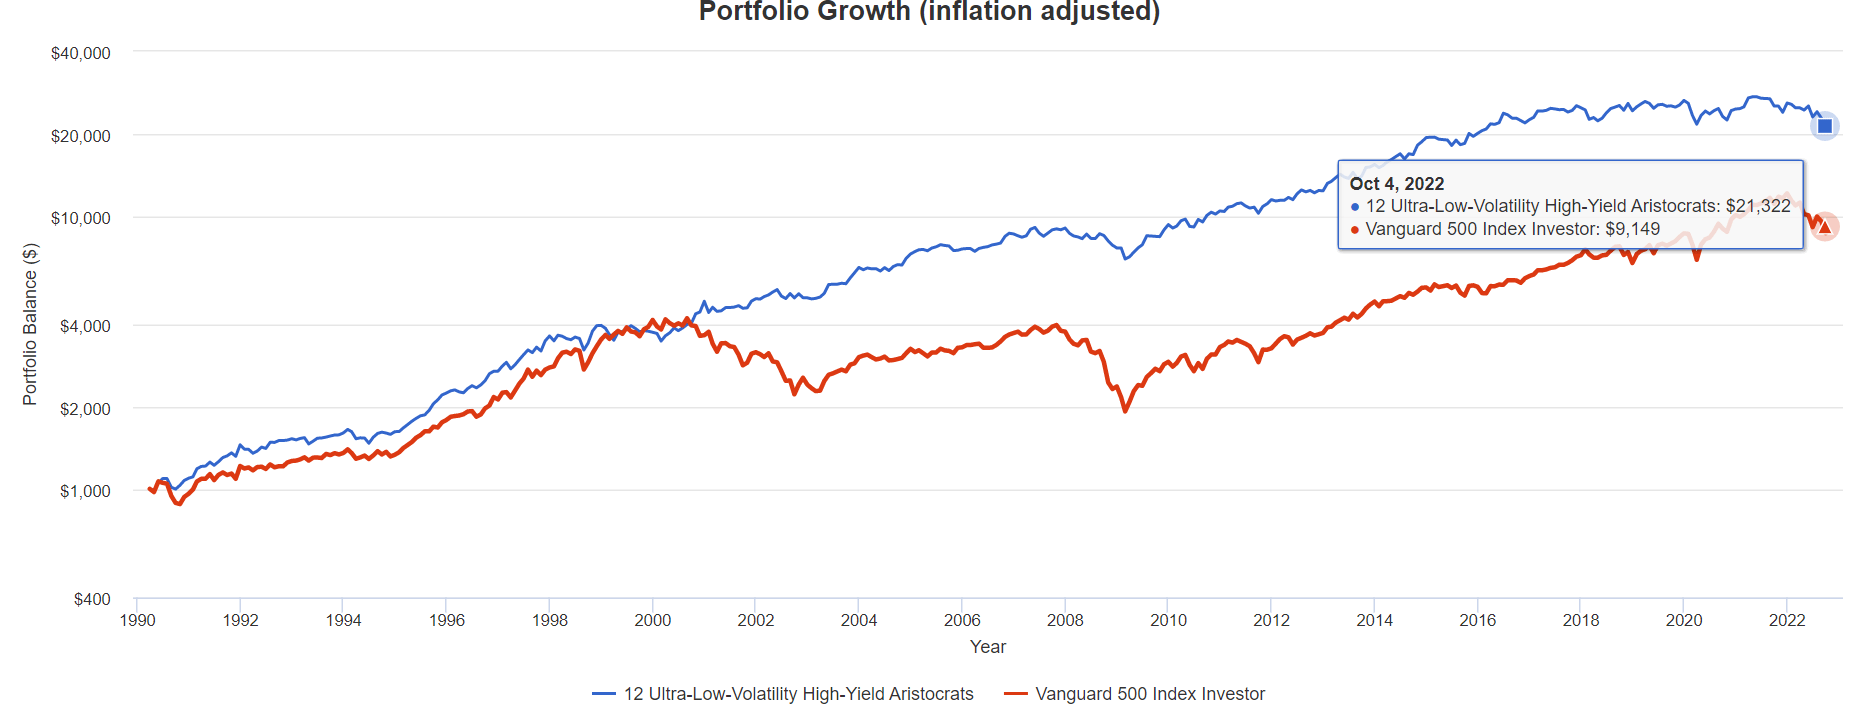
Were they beating the market during the tech craze of the 1990s? Yup, they did that. And then kept right on growing during the tech crash. While barely falling into a bear market during the Great Financial Crisis, the 2nd worst stock market crash in US history.
- 21X inflation-adjusted returns that more than doubled the market over the last 32 years
- 15X inflation-adjusted returns are what analysts expect over the next 32 years
(Source: Portfolio Visualizer)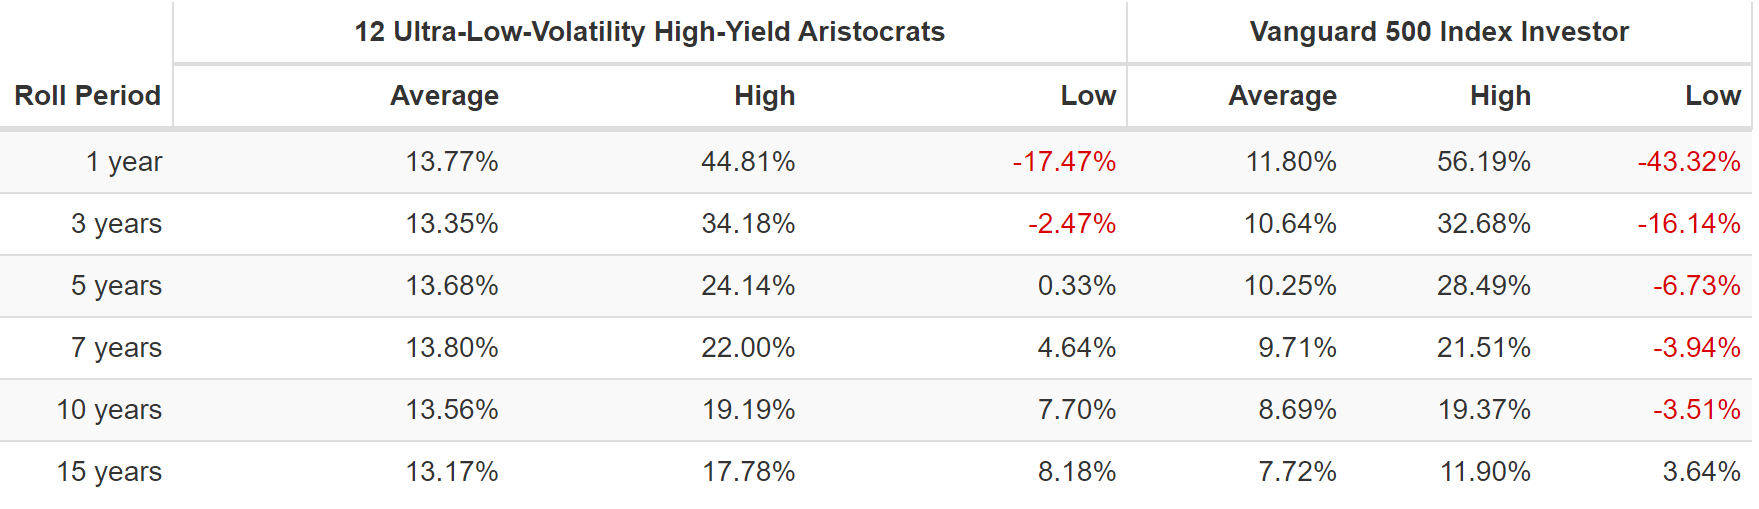
Very consistent market smashing returns, and never a five-year period without profits.
(Source: Portfolio Visualizer)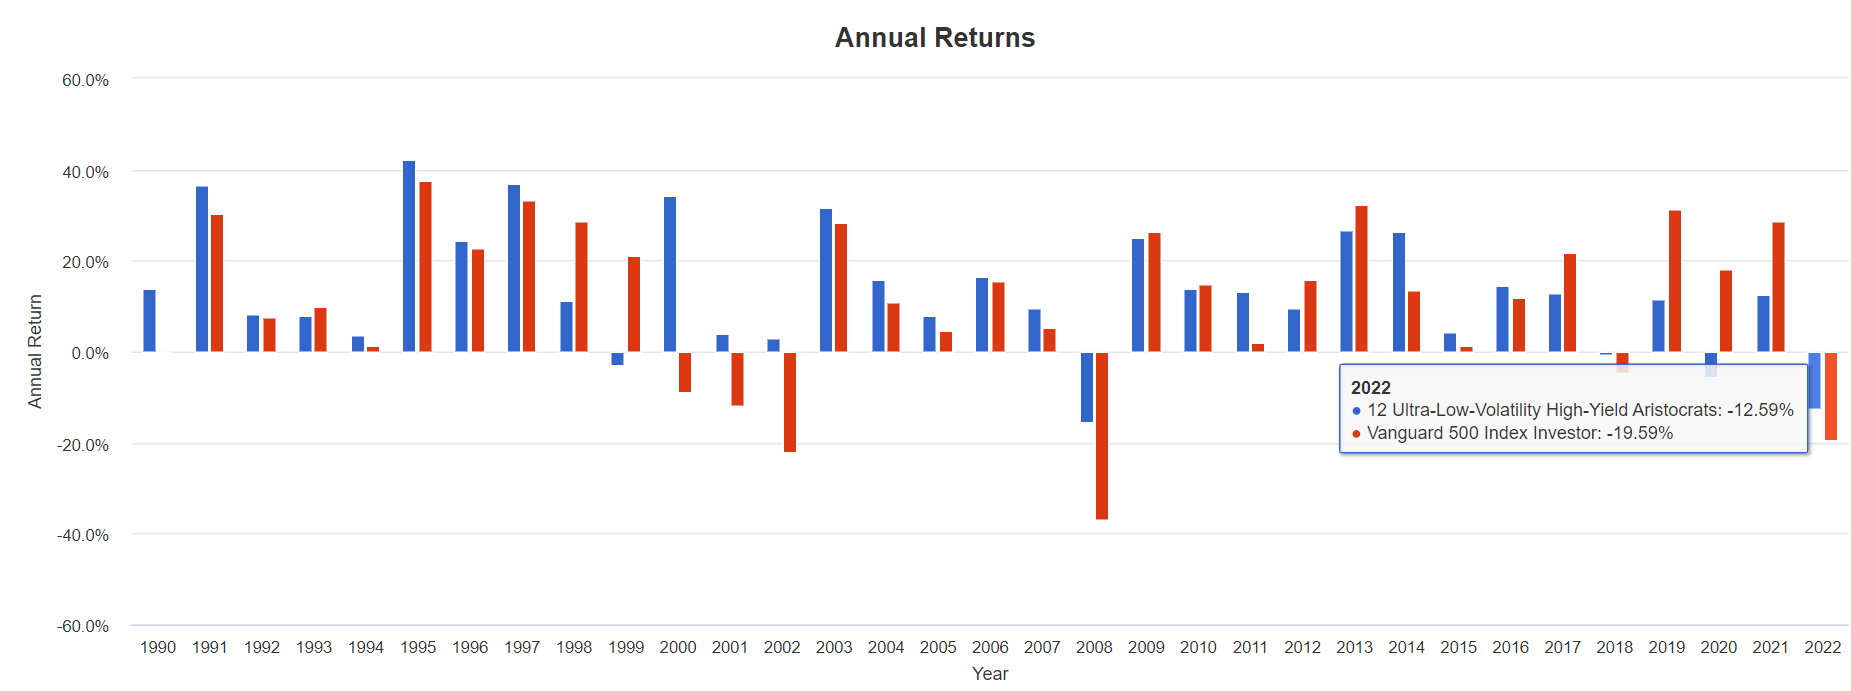
In 2022 they are down 13%, while the market is down 20%.
During the tech crash, they went up every year while the S&P was cut in half and the Nasdaq fell 82%.
(Source: Portfolio Visualizer)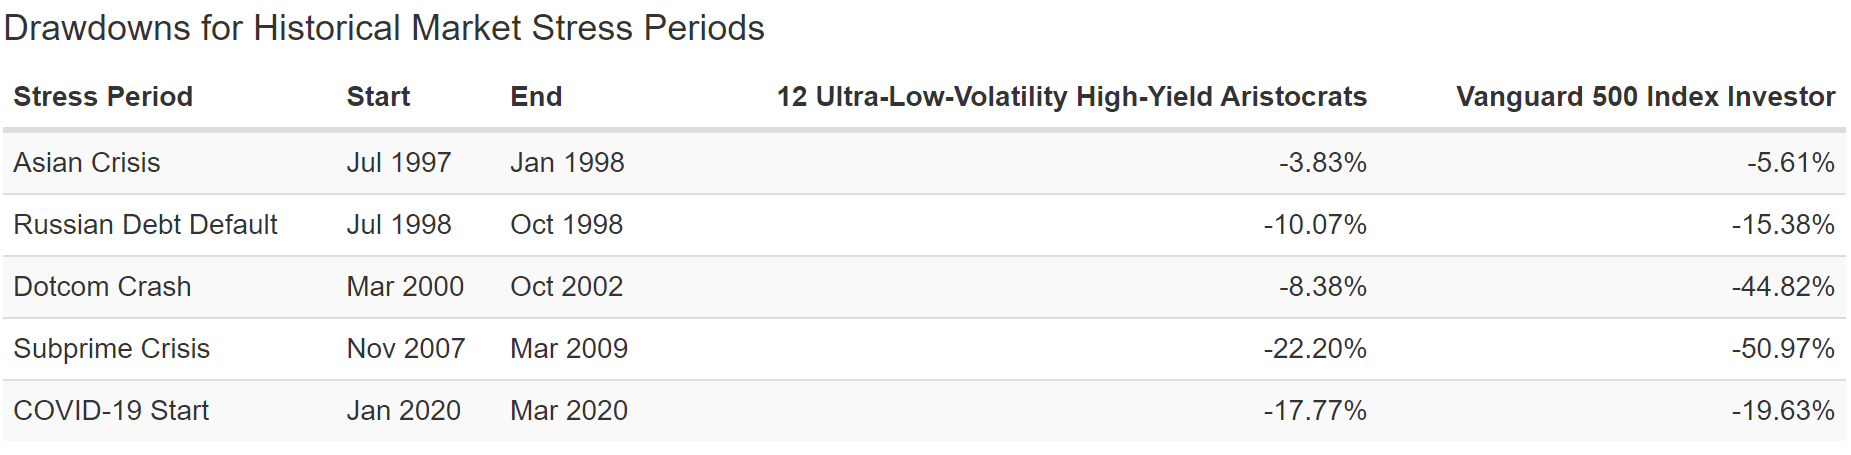
Peak declines much lower than the S&P across almost every major market scare. Including a peak decline of just 8% during the tech crash.
(Source: Portfolio Visualizer)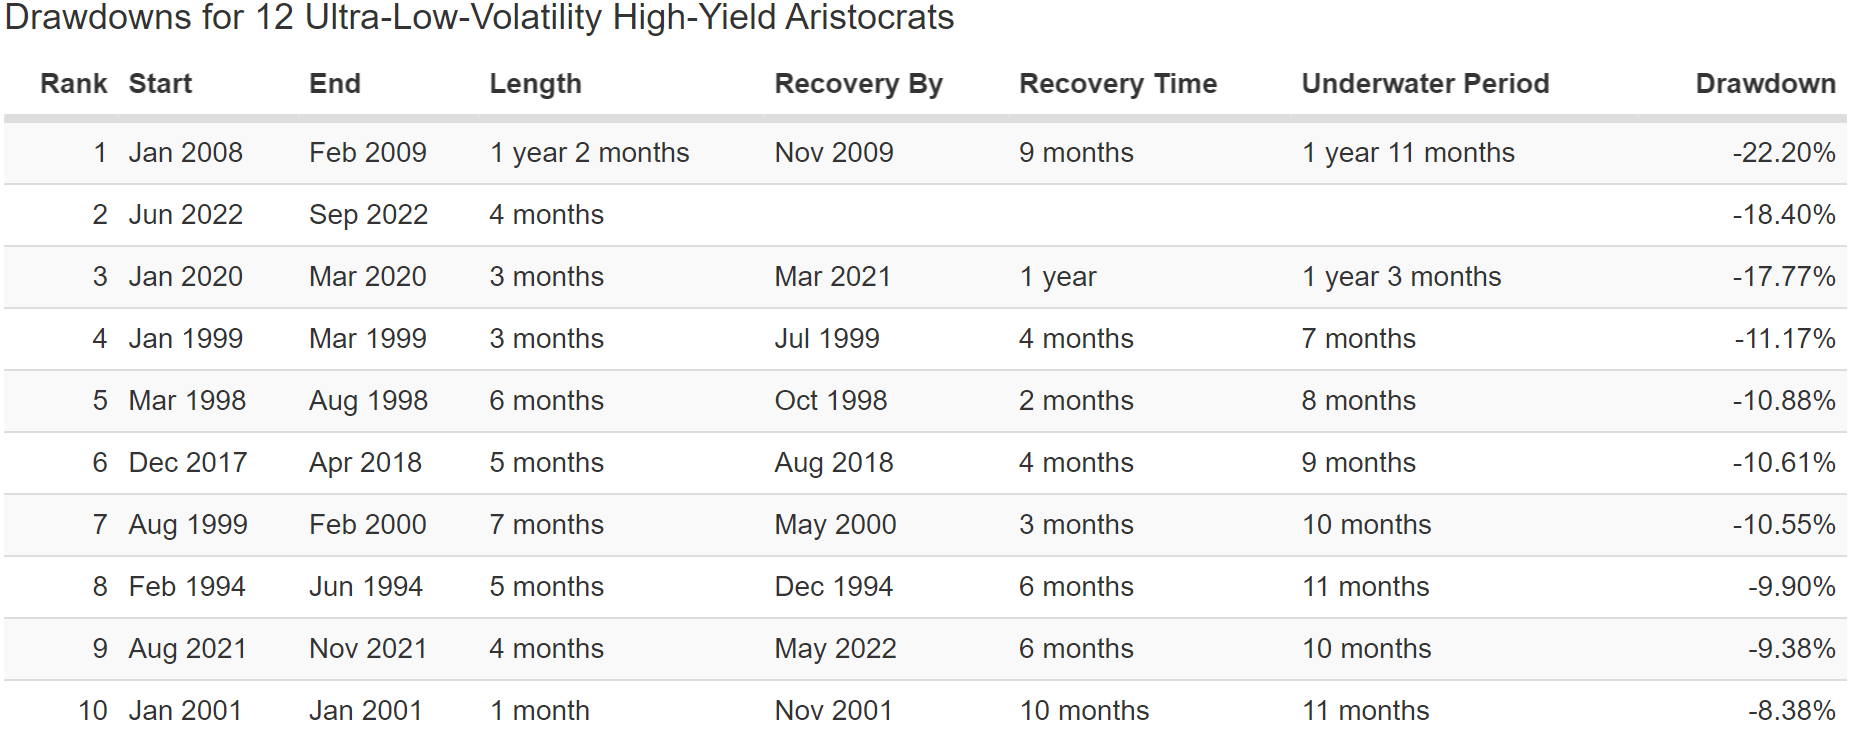
Just one bear market in the last 32 years, and it took the market getting cut in half to push these low-volatility aristocrats into that.
A peak decline of 18% in this bear market:
- Nasdaq -33%
- S&P -26%
- 60/40 -21%
And let’s not forget the entire reason for owning high-yield aristocrats, the income!
Income You Can Trust In Any Economy
2007 and 2008 were 3 MO spin-offs ( (Source: Portfolio Visualizer))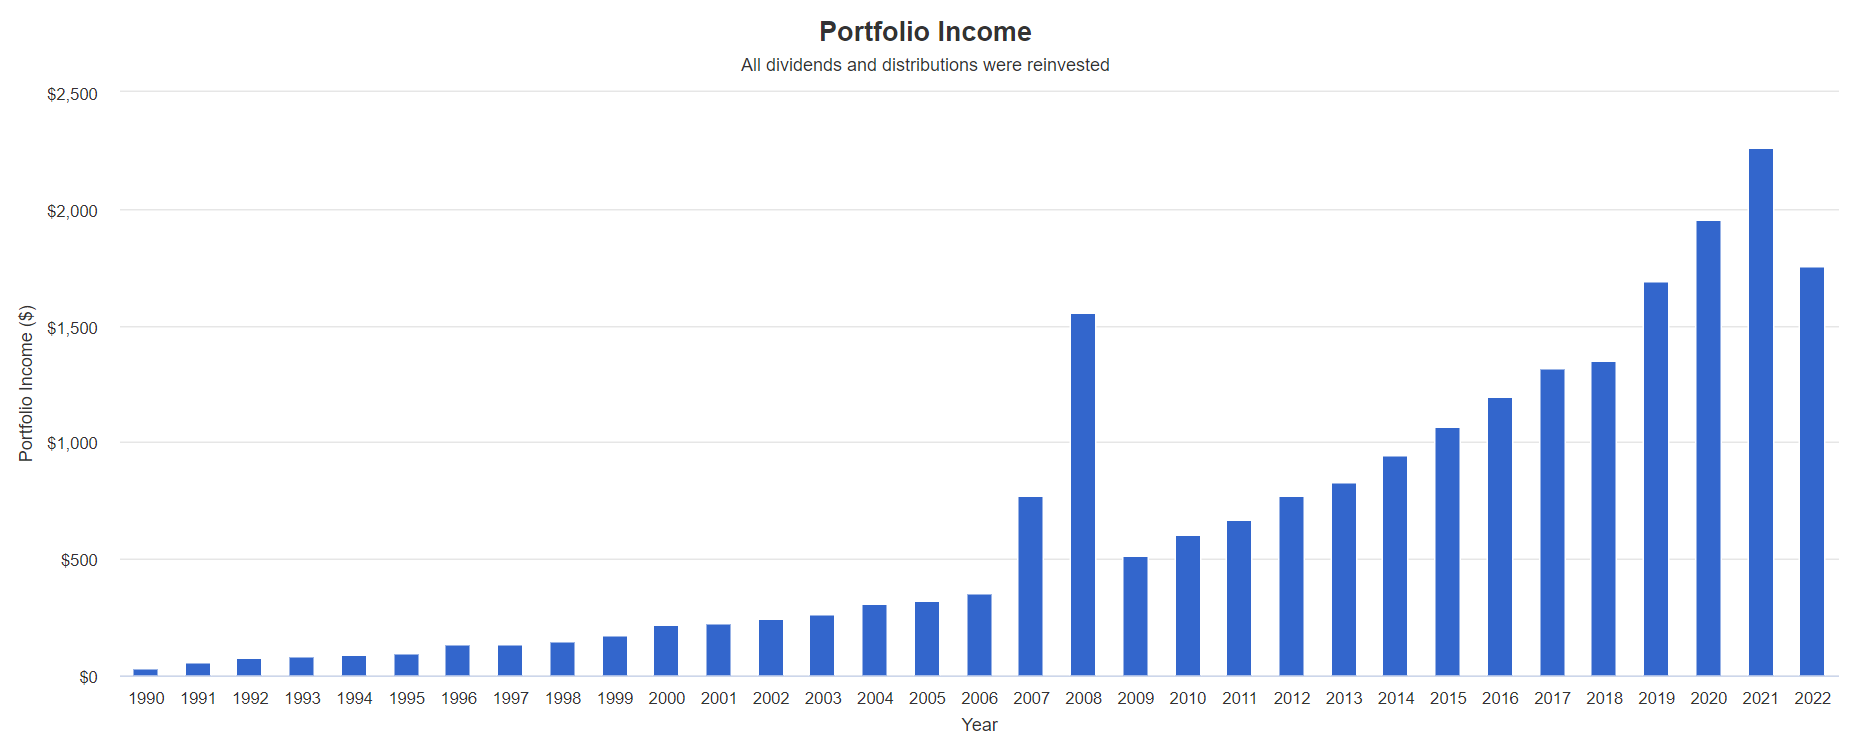
Steady income growth for 32 years through:
- three recessions
- three market crashes
- five bear markets
- and dozens of correction
- and geopolitical scares
But even more impressive than this income dependability is how much dividends these aristocrats have paid for even a modest investor over the last third of a century.
Cumulative Dividends Since X: $1,000 Initial Investment
| Metric | 12 Ultra-Low-Volatility High-Yield Aristocrats |
| Total Dividends | $22,808 |
| Total Inflation-Adjusted Dividends | $9,831.03 |
| Annualized Income Growth Rate | 6.4% |
| Total Income/Initial Investment % | 22.81 |
| Inflation-Adjusted Income/Initial Investment % | 9.83 |
| Starting Yield | 5.0% |
| Today’s Annual Dividend Return On Your Starting Investment (Yield On Cost) | 234.1% |
| 2022 Inflation-Adjusted Annual Dividend Return On Your Starting Investment (Inflation-Adjusted Yield On Cost) | 100.9% |
(Source: Portfolio Visualizer)
10X your initial investment back in inflation-adjusted dividends. A 5% yield back in 1990 (just like today) that’s grown into a 101% inflation-adjusted yield on cost over a third of a century (standard retirement time frame).
OK, but what if you just can’t stomach the idea of even a 22% bear market during the Great Recession? What if sleeping well at night requires even less volatility for you personally?
How To Build A ZEUS Ultra-Low Volatility High-Yield Aristocrats Portfolio
ZEUS stands for Zen Extraordinary Ultra SWAN (sleep well at night) and represents a long-term recession-optimized portfolio you can set and forget.
- annual rebalancing, and otherwise you can safely ignore it for an entire year
The ZEUS strategy involves:
- 33% core ETFs
- 33% hedging assets (cash, bonds, alternatives)
- 33% individual blue-chips
In this case, a ZEUS Ultra-Low-Volatility High-Yield Aristocrat might look like this:
- 33% SCHD or VYM (gold standards of high-yield ETFs)
- 16.7% EDV, or TLT (long-bonds)
- 16.7% DBMF, AMFAX, or PQTAX (managed futures)
- 33% these 12 high-yield aristocrats (2.8% each)
| Metric | 60/40 | ZEUS Ultra-Low-Volatility High-Yield Aristocrat | X Better Than 60/40 |
| Yield | 2.3% | 5.1% | 2.19 |
| Growth Consensus | 5.1% | 5.0% | 0.98 |
| LT Consensus Total Return Potential | 7.4% | 10.1% | 1.36 |
| Risk-Adjusted Expected Return | 5.2% | 7.1% | 1.36 |
| Safe Withdrawal Rate (Risk And Inflation-Adjusted Expected Returns) | 2.9% | 4.8% | 1.64 |
| Conservative Time To Double (Years) | 24.7 | 15.1 | 1.64 |
(Source: DK Research Terminal, FactSet)
Market-like returns that blow away a 60/40 with more than 2X the yield and a nearly 5% safe withdrawal rate.
That’s the power of ZEUS, the king of sleep-well-at-night retirement portfolios.
What kind of difference could that extra 2.5% annual returns mean for your retirement?
Inflation-Adjusted Consensus Total Return Potential: $510,000 Average Retired Couple’s Savings Initial Investment
| Time Frame (Years) | 5.1% CAGR Inflation-Adjusted 60/40 | 7.8% Inflation-Adjusted ZEUS Ultra-Low-Volatility High-Yield Aristocrat | Difference Between ZEUS Ultra-Low-Volatility High-Yield Aristocrat and 60/40 Consensus |
| 5 | $654,320.24 | $742,823.35 | $88,503.11 |
| 10 | $839,480.35 | $1,081,934.38 | $242,454.02 |
| 15 | $1,077,037.23 | $1,575,855.14 | $498,817.90 |
| 20 | $1,381,818.17 | $2,295,258.81 | $913,440.64 |
| 25 | $1,772,846.27 | $3,343,082.04 | $1,570,235.77 |
| 30 | $2,274,527.85 | $4,869,253.74 | $2,594,725.89 |
| 35 | $2,918,175.72 | $7,092,147.81 | $4,173,972.10 |
| 40 | $3,743,963.62 | $10,329,829.43 | $6,585,865.81 |
| 45 | $4,803,433.69 | $15,045,565.72 | $10,242,132.03 |
| 50 | $6,162,713.53 | $21,914,112.85 | $15,751,399.32 |
| 55 | $7,906,643.56 | $31,918,264.22 | $24,011,620.66 |
| 60 | $10,144,072.43 | $46,489,474.52 | $36,345,402.09 |
| 100 | $74,468,702.13 | $941,624,199.92 | $867,155,497.79 |
(Source: DK Research Terminal, FactSet)
For the average retired couple, that extra performance translates into a potential extra $2.6 million in inflation-adjusted wealth over 30 years.
| Time Frame (Years) |
Ratio ZEUS Ultra-Low-Volatility High-Yield Aristocrat Vs. 60/40 Consensus |
| 5 | 1.14 |
| 10 | 1.29 |
| 15 | 1.46 |
| 20 | 1.66 |
| 25 | 1.89 |
| 30 | 2.14 |
| 35 | 2.43 |
| 40 | 2.76 |
| 45 | 3.13 |
| 50 | 3.56 |
| 55 | 4.04 |
| 60 | 4.58 |
| 100 | 12.64 |
(Source: DK Research Terminal, FactSet)
It’s more than double the inflation-adjusted wealth of a 60/40.
And of course, it also means a lot more income.
Historical Returns Since March 2007 (The Entire Great Recession)
(Source: Portfolio Visualizer Premium)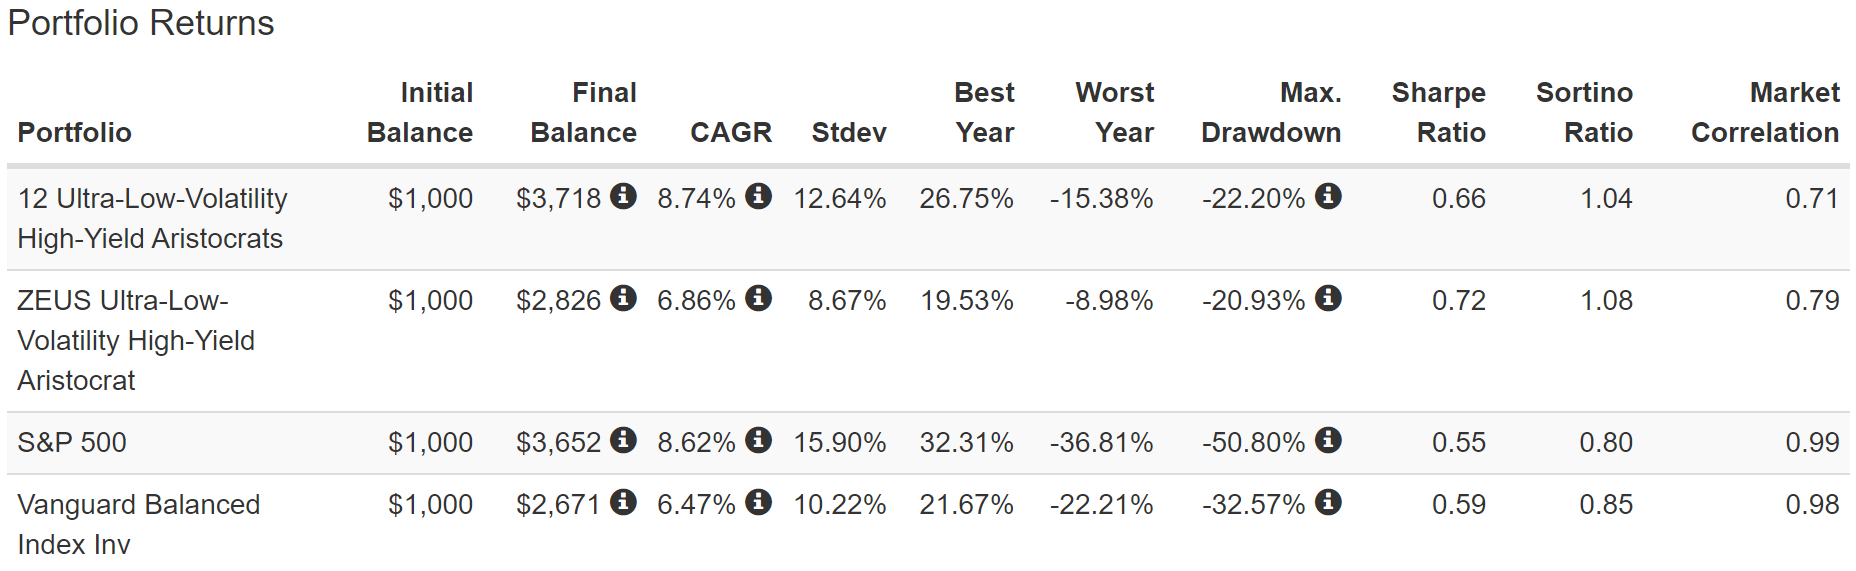
Superior returns to a 60/40? Yup. Lower volatility? Absolutely, less than 9% per year over the last 15 years.
A peak decline of -21% is similar to the aristocrats on their own but notice the smoothness of returns, with the worst year being just a 9% decline.
(Source: Portfolio Visualizer Premium)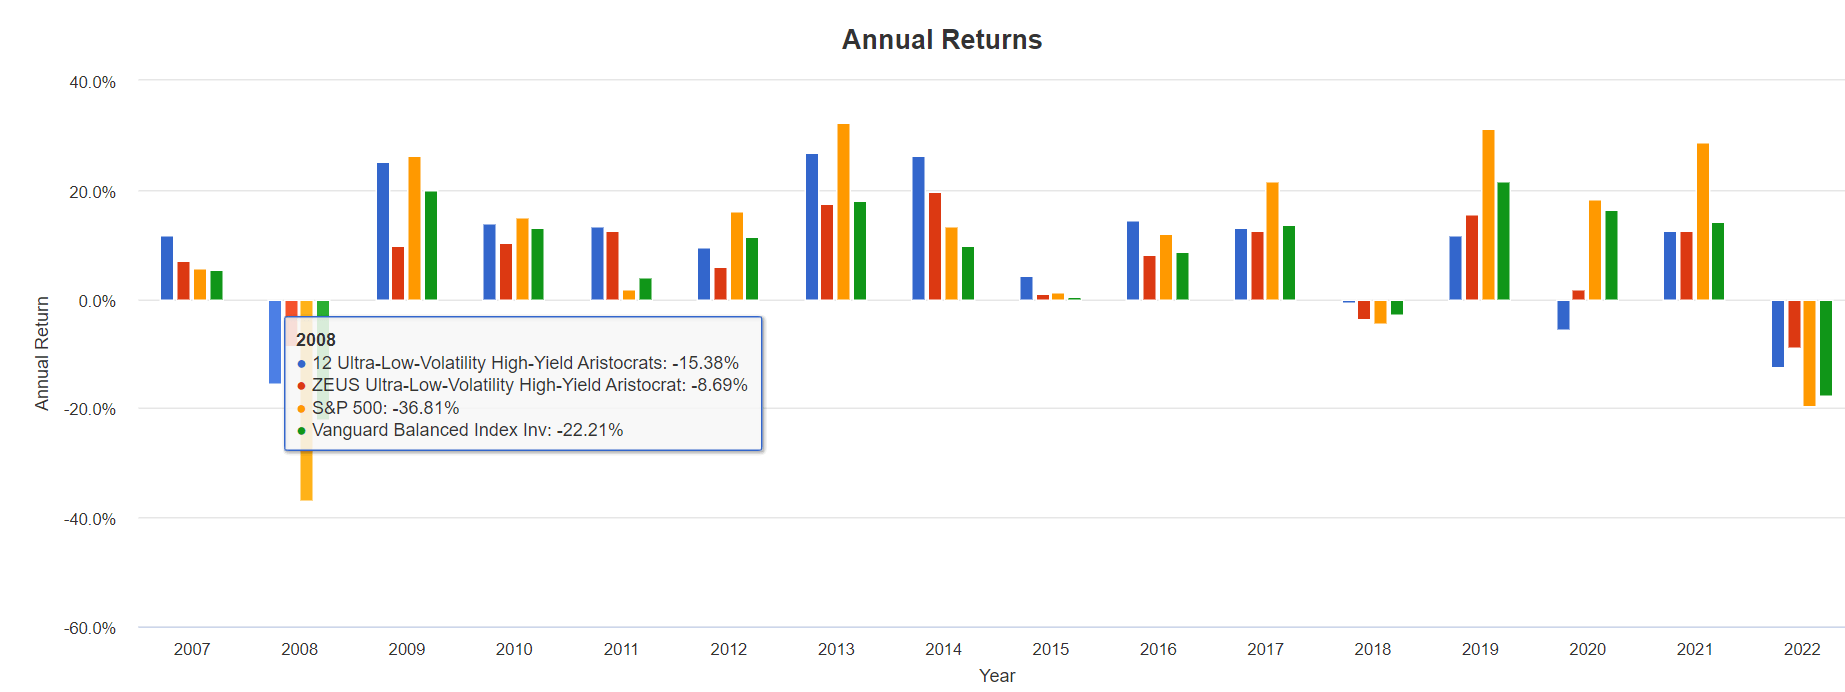
In 2008, the worst year for stocks in decades, the S&P fell 37%, a 60/40 22%, and the high-yield aristocrats 15%. But ZEUS Aristocrats fell less than 9%.
YTD in 2022, ZEUS aristocrats is down just 9%, half the decline of a 60/40 or the S&P 500.
(Source: Portfolio Visualizer Premium)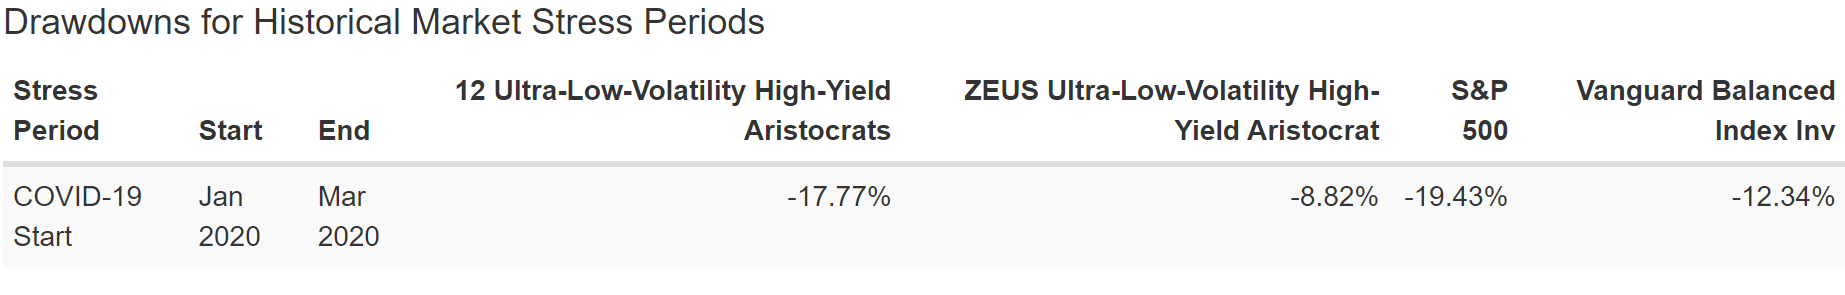
During the Pandemic (March) the S&P fell 20%, a 60/40 12%, and the high-yield aristocrats 18%. ZEUS high-yield aristocrat fell just 9%, not even a correction.
(Source: Portfolio Visualizer Premium)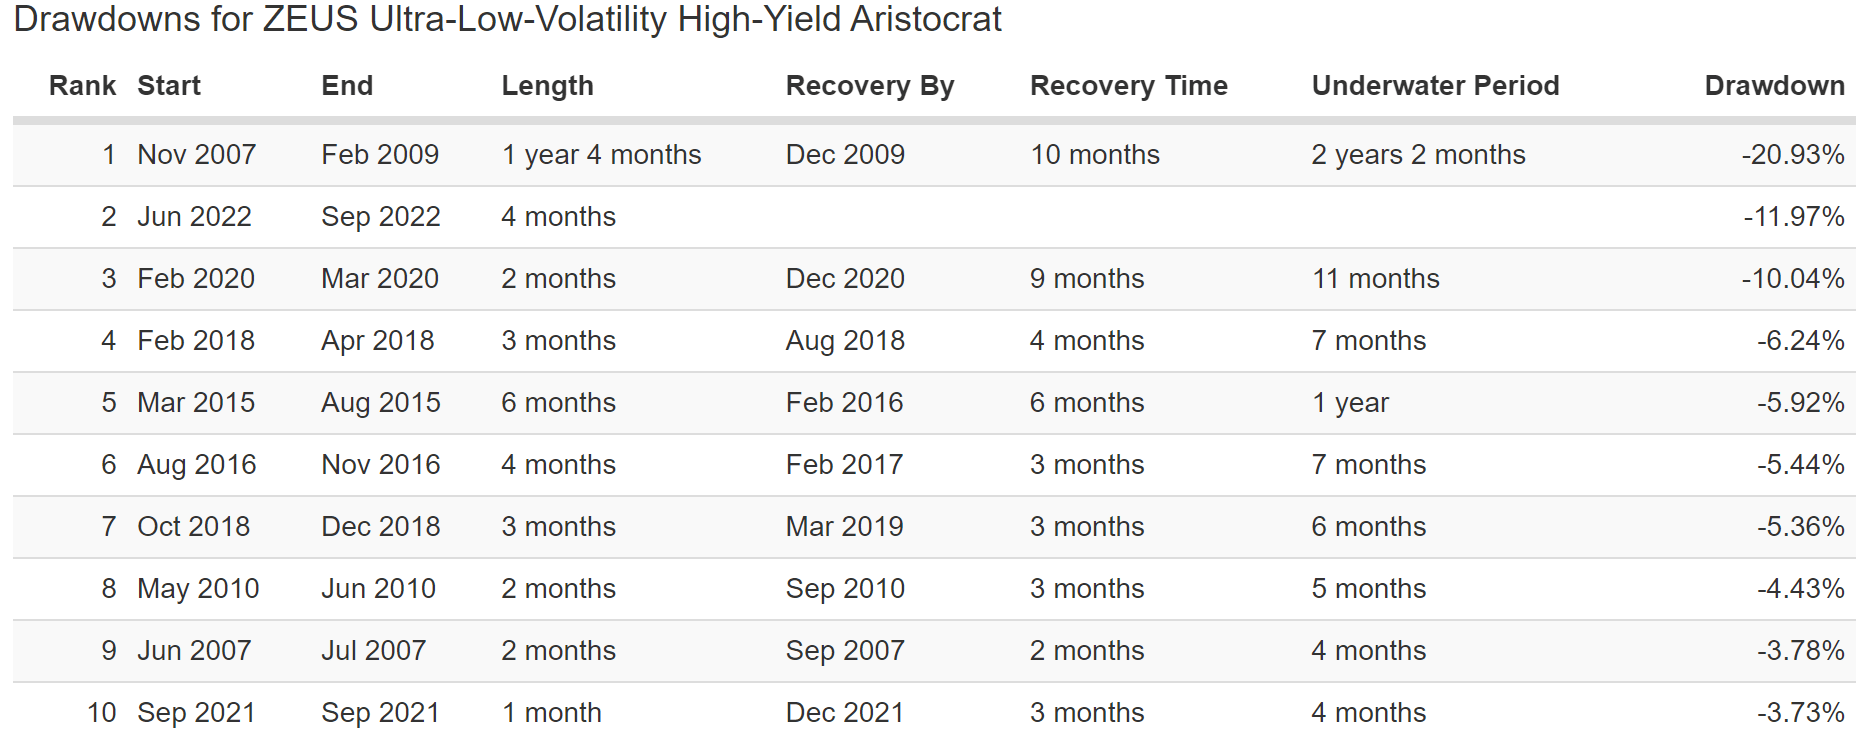
It’s down a peak of 12% in this bear market:
- S&P -26
- 60/40 -21%
- high-yield aristocrats -18%
In fact, in the last 15 years, this ZEUS portfolio has experienced just three corrections.
It’s experienced just seven declines of 5+%.
- Riding over the market’s potholes in a Rolls Royce
(Source: Portfolio Visualizer Premium)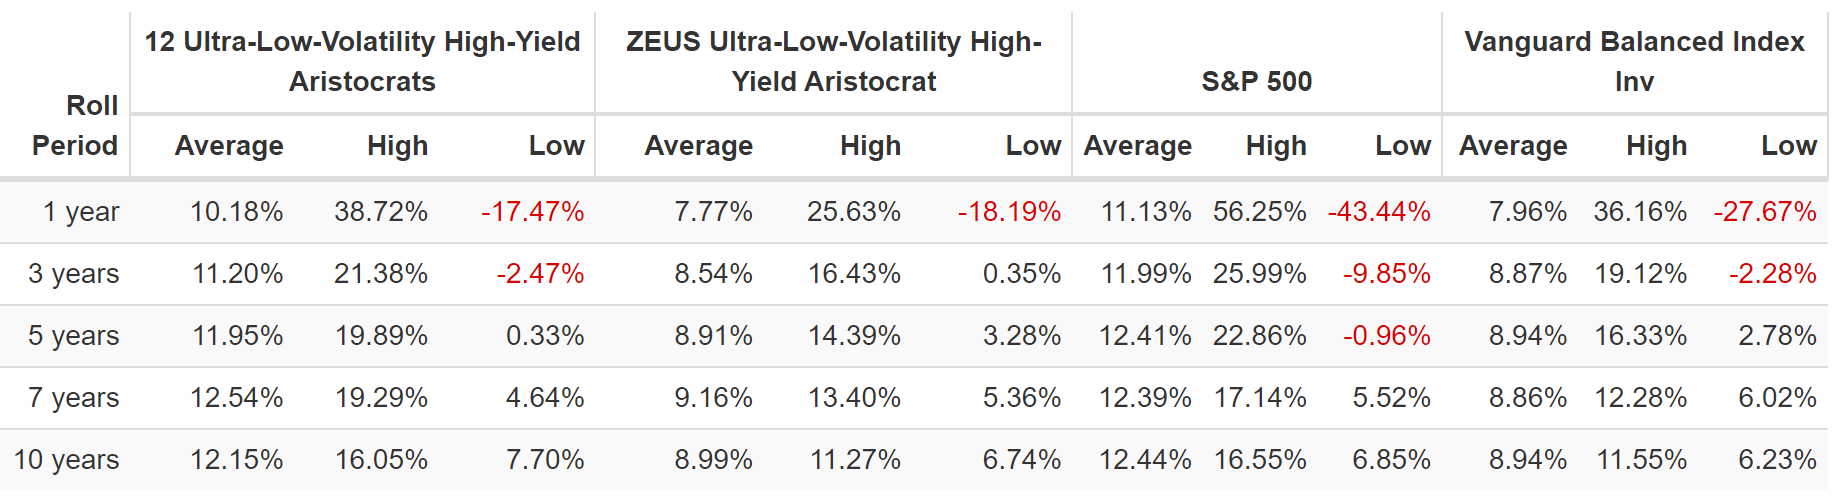
How many times has it failed to deliver positive returns over 3 years? Never.
ZEUS During The Great Recession
(Source: Portfolio Visualizer Premium)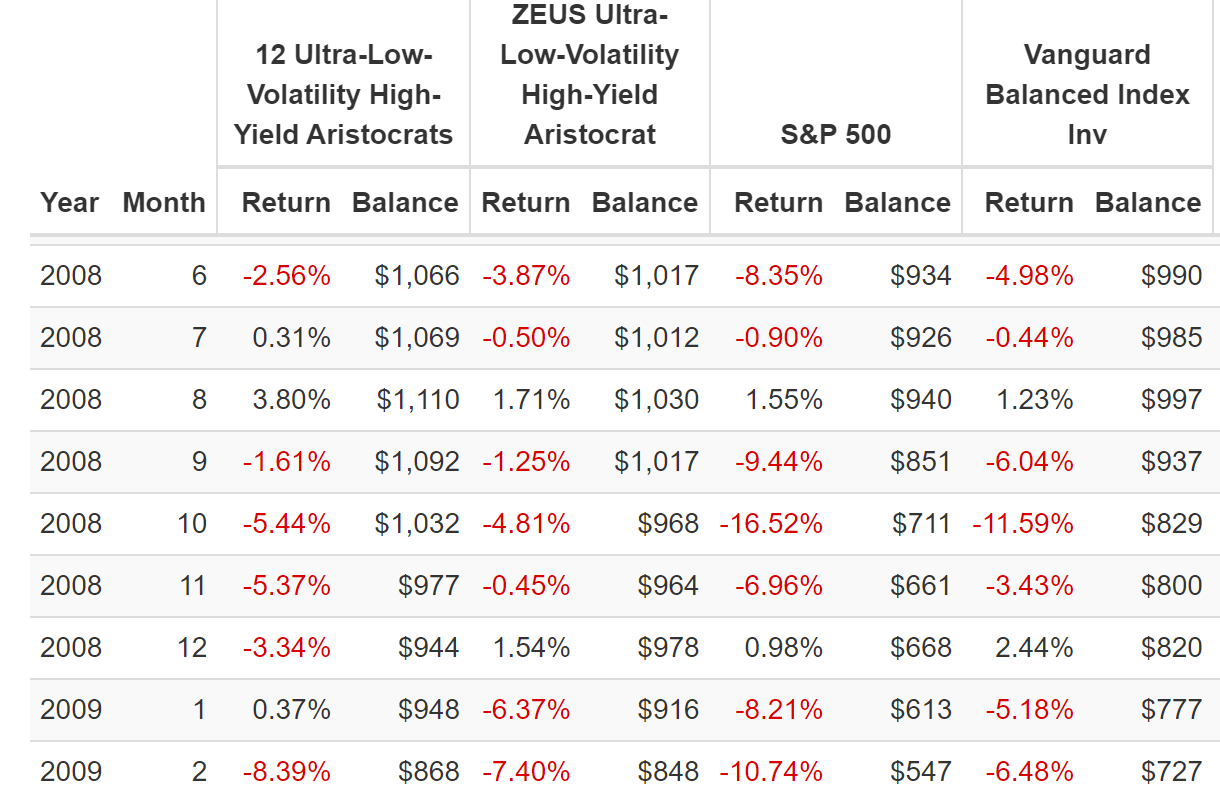
In the Great Recession, the S&P fell 17% in October 2008, and a 60/40 fell just 12%. The high-yield aristocrats fell just 5% and ZEUS just 5% as well.
- 1/4th the decline of the market
Then in November, stocks sold off 7% more, with the 60/40 falling 3% and the high-yield aristocrats 5%. ZEUS was flat, not even falling half a percent.
- 94% smaller decline than the market
In January 2009, the market fell another 8%, and ZEUS fell 6%, about 25% less.
And then it fell 30% less in February, as the Great Recession bear market ran its course.
ZEUS During The 2011 Bear Market
(Source: Portfolio Visualizer Premium)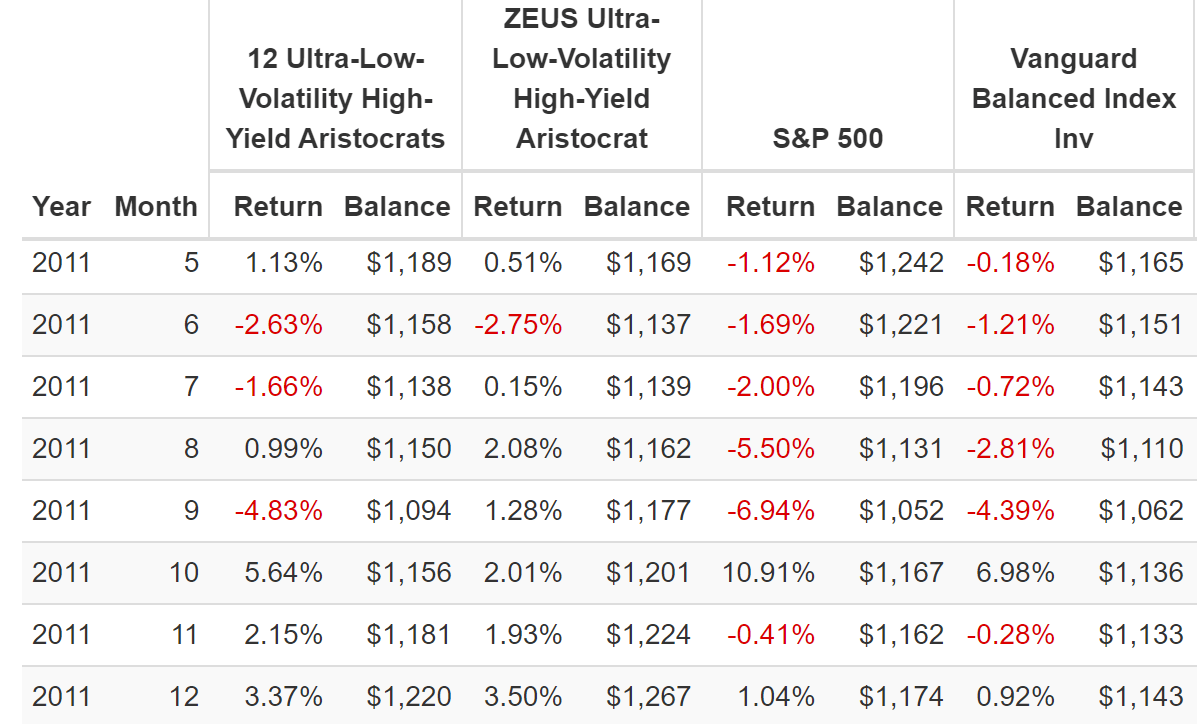
In 2011 the S&P experienced five consecutive months of steadily worse declines, and a 60/40 was only modestly better.
The high-yield aristocrats held up relatively well (-8%). ZEUS went up 0.7% during this 20% bear market for the S&P.
ZEUS During The 2018 Bear Market
(Source: Portfolio Visualizer Premium)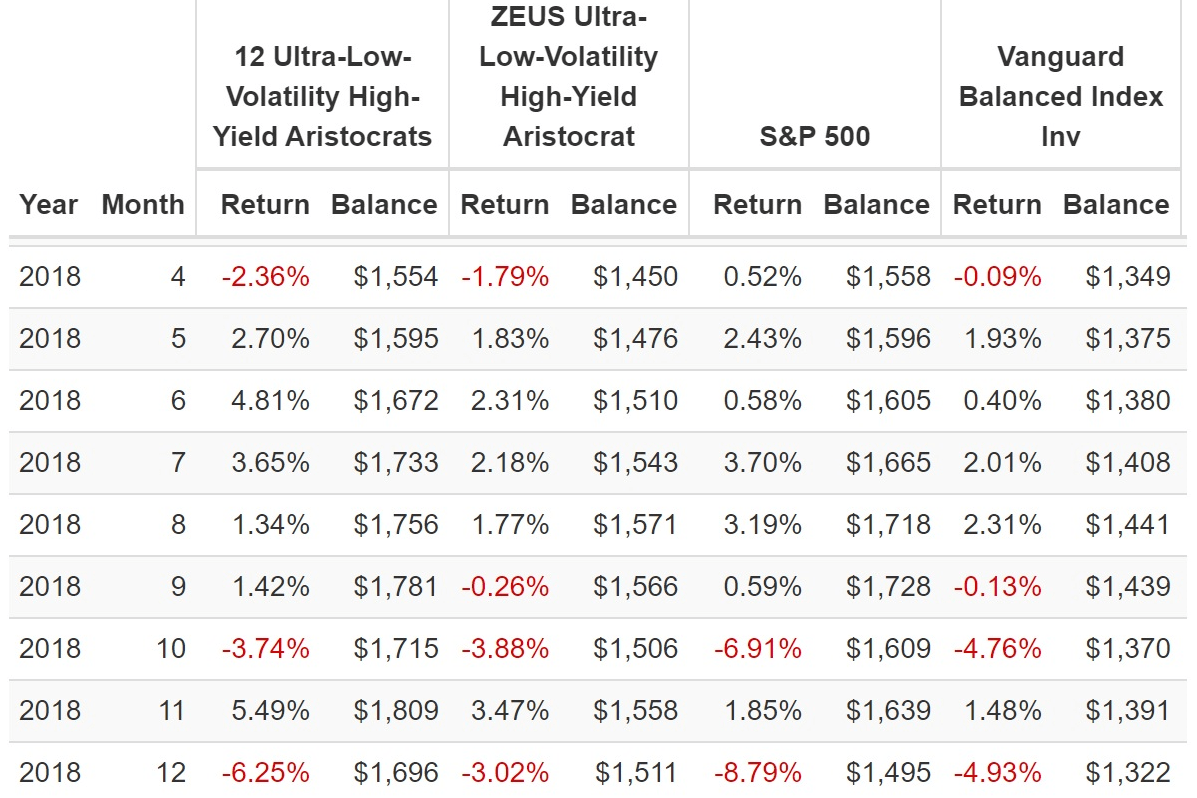
In the 2018 bear market (-20% intraday on Dec 24th), stocks fell 17% in three weeks and were down 9% for the month of December.
The low volatility aristocrats fell 6%, a 60/40 5%, and ZEUS just 3% (1/3rd as much as the market).
ZEUS During The Pandemic
(Source: Portfolio Visualizer Premium)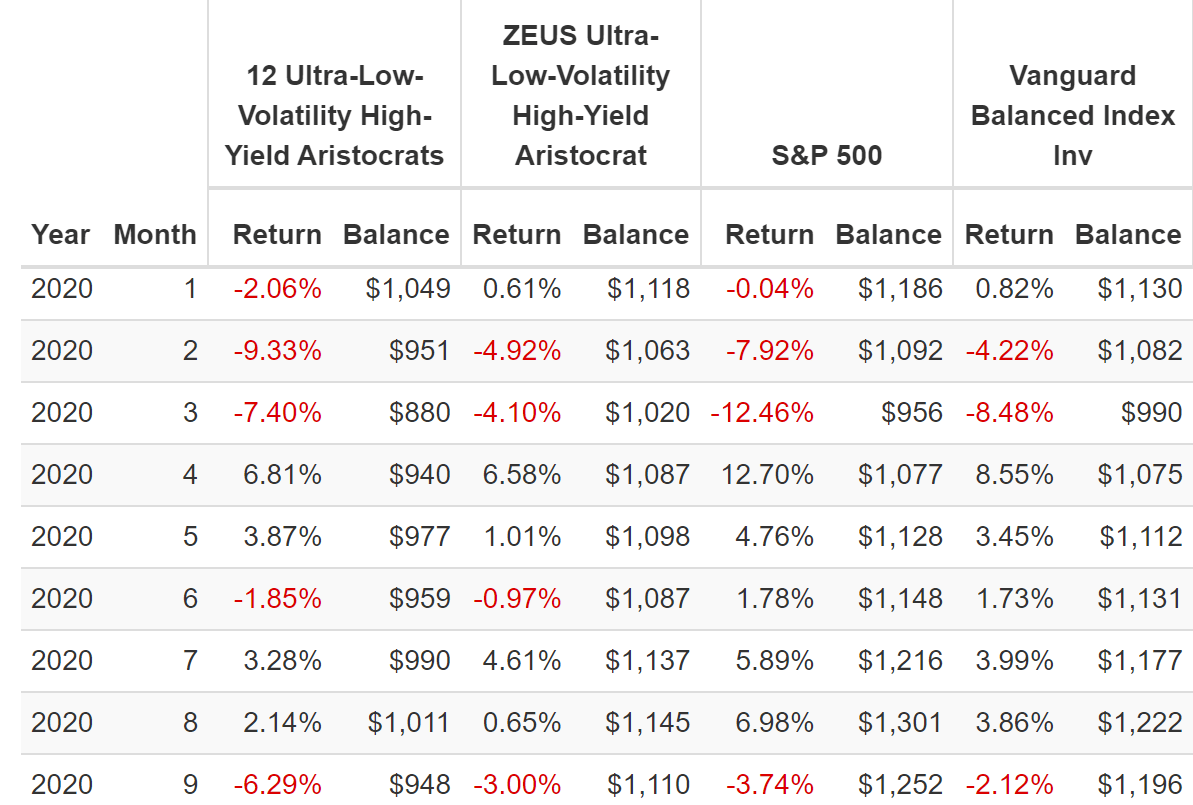
During the Pandemic, the S&P fell 8% in February and another 13% in March.
ZEUS fell about 9% in this time, including just 4% in March, 1/3rd the market’s drop.
ZEUS During The 2022 Stagflation Bear Market
(Source: Portfolio Visualizer Premium)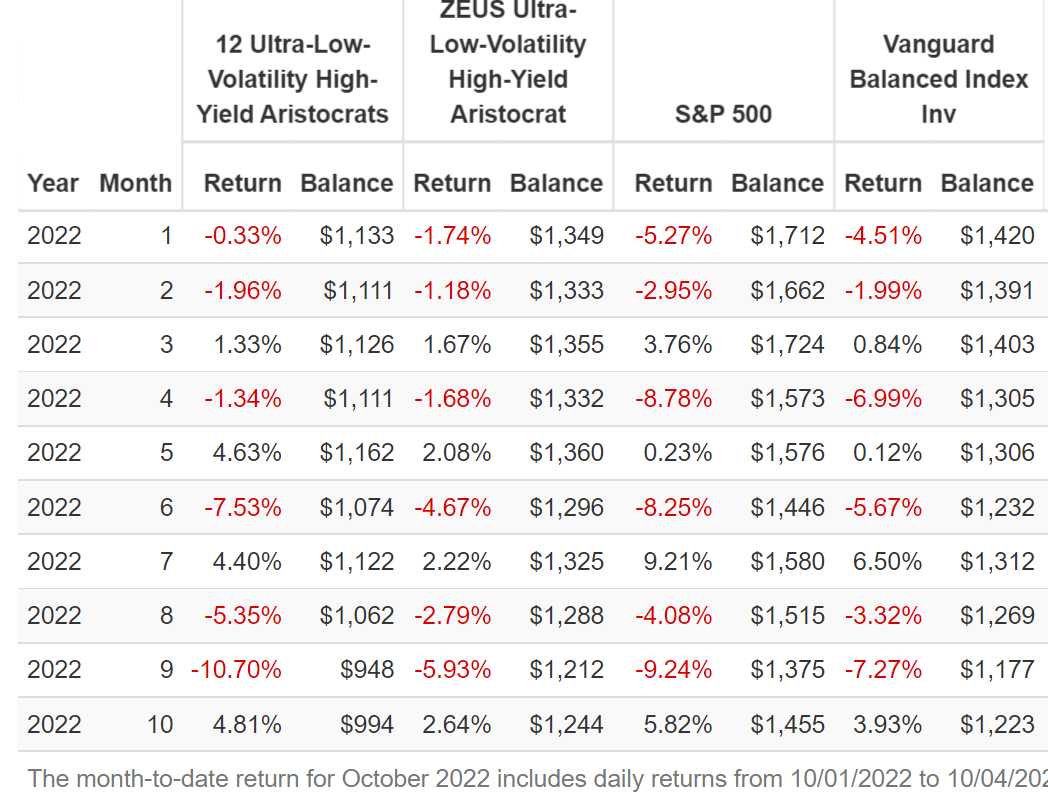
During the stagflation bear market of 2022, the market plunged 5.3% in January, while the high-yield aristocrats and ZEUS barely blinked.
In February, both fell less than the S&P, with ZEUS posting a loss about 1/3rd as bad as the market.
In April, stocks crashed 9% in a single month while the aristocrats and ZEUS fell less than 1/4th as much.
In August, stocks fell 4% while ZEUS fell less than 3%.
In September, the market suffered a 9% decline, with the aristocrats falling 11% while ZEUS fell just 6%.
(Source: Portfolio Visualizer Premium)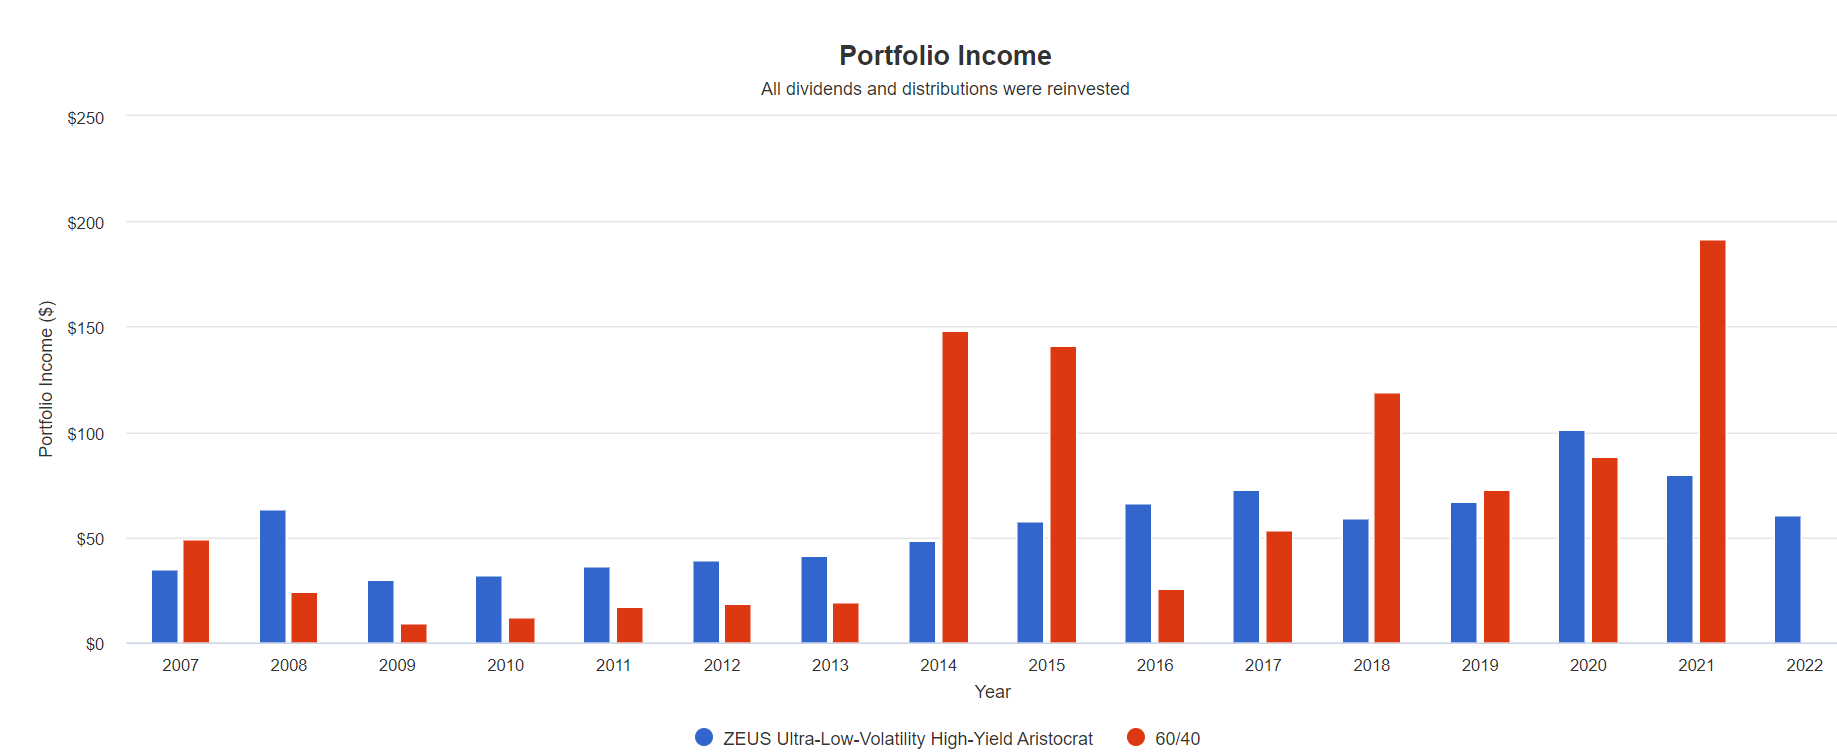
Balanced portfolios like a 60/40 or anything with bonds or alternatives will naturally have variable income.
But ZEUS’s yield tends to be higher than a 60/40’s, and its annual income is more dependable.
Bottom Line: These 12 High-Yield Dividend Aristocrats Can Help Protect Your Sanity And Savings In This Bear Market
A bear market can be scary, and this one especially so, given that the 60/40 retirement portfolio is having its worst year since 1931.
Charlie Bilello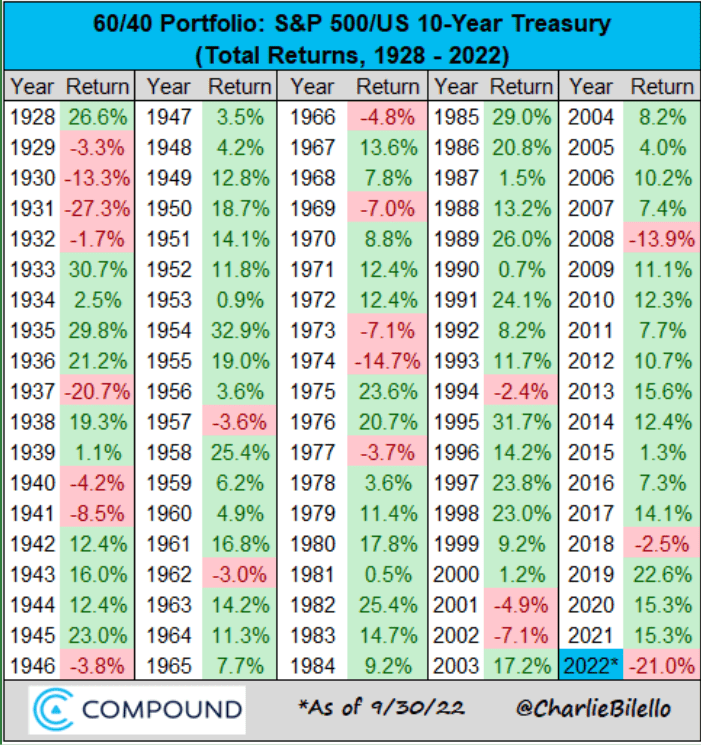
But as I’ve pointed out in the intro, you can’t make money in the stock market without bear markets. The biggest gains in stocks, which drive 99.84% of all long-term returns, come during these periods of market panic and investor despair.
- time in the market will make you rich
- timing the market will put your retirement plans in the ditch
If you want to retire rich and stay rich in retirement, you need to survive and, better yet, thrive during inevitable bear markets. Not just this one, but the four to six that are likely over the next 30 years.
- The US stock market averages one bear market every six years
This is where ultra-low-volatility high-yield aristocrats like KMB, CLX, NVS, FTS, NWN, UGI, MMM, MO, NJR, PM, MDT, and ENB can help.
- 4.8% very safe yield
- BBB+ stable credit rating
- 43-year average dividend growth streak (since 1979, through six recessions)
- 6.1% CAGR long-term growth
- 10.9% CAGR long-term return potential (similar to the last 32 years)
- a peak decline of just 22% during the Great Recession (10% lower than a 60/40)
Whether or not you want to hedge these aristocrats with bonds and managed futures (hedge funds) to achieve even lower volatility (a peak decline of just 9% in the Pandemic), the point is that the right world-beater blue-chips can make all the difference.
- these aristocrats can help you ride over the market potholes in a Rolls Royce
If you want to retire in safety and splendor, you need blue-chips you can trust, not just when the economic sun is shining but also when we’re in an economic hurricane.
The best investment strategy on earth is useless if you panic and sell at the exact wrong time (like right now).
Ultra-low-volatility aristocrats pay you handsomely to wait out the current market storm and are some of the most dependable choices for whatever is coming next.
- 70% chance of a recession in 2023 and up to a 24% further market decline
- 30% chance of a soft landing and possible strong market rally in 2023
Rain or shine, these ultra-low-volatility high-yield aristocrats can help you ensure that your retirement plans will be just fine.
Be the first to comment