


Vertigo3d/E+ via Getty Images
Inflation chatter pushes interest rates higher
This week’s 10-year sharp rise to 2.7% was a rerun to late last year when it went rapidly from 1.3% to 1.78%. That quick trot in rates caused the tech names to get hammered for not being profitable during raging inflation (this is the accepted projection, not mine.) Once the 10-Year reached that 1.78% peak level it retreated to 1.3% and traded between these points for so long that by the time it broke 2% the market didn’t care. I think the same thing will happen in the coming days. We are likely as far as the 10-year will go, for now, maybe it reaches 2.79 or a touch more. It will again trade in a range perhaps from 2.2% to 2.7% until the May meeting. Since the market will be discounting that level of raise for the next few weeks, we should rally after the announced raise. During this time interest rates will chop around the market once again, get bored with this higher level, then the tech names will recover. By recognizing that this is a pattern we can anticipate what happens next. Another benefit (perhaps most important) in pattern recognition is how this time differs from last time, and what influence this difference will have on price action going forward.
Why would the 10-year bond hold at this level?
The dollar is strong and 2.7% is very juicy for the rest of the world. Think of the European bond buyer, they get 2.7%, and if the dollar continues to rise they are making even more money on the arbitrage between the Euro and the ever-stronger dollar. The Yen is also weakening against the dollar. That will keep a cap on our interest rates even as the Fed stops buying T-Bills.
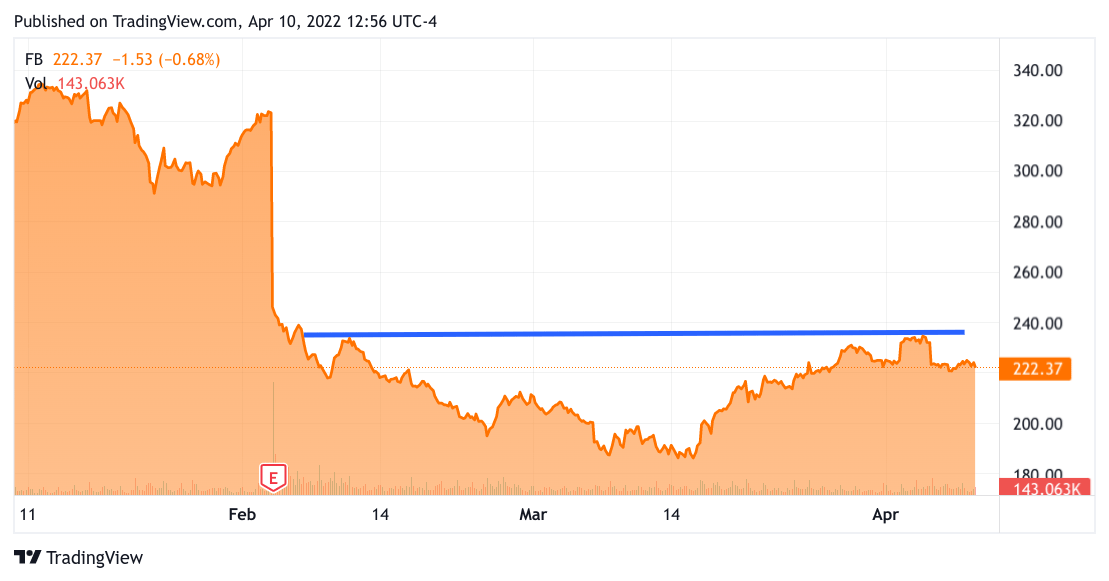
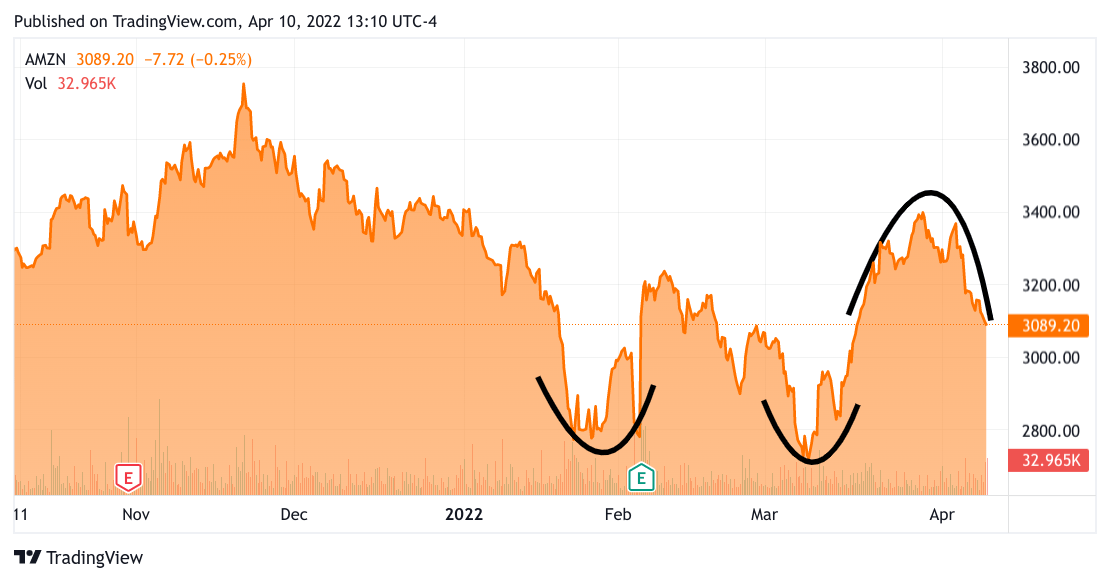
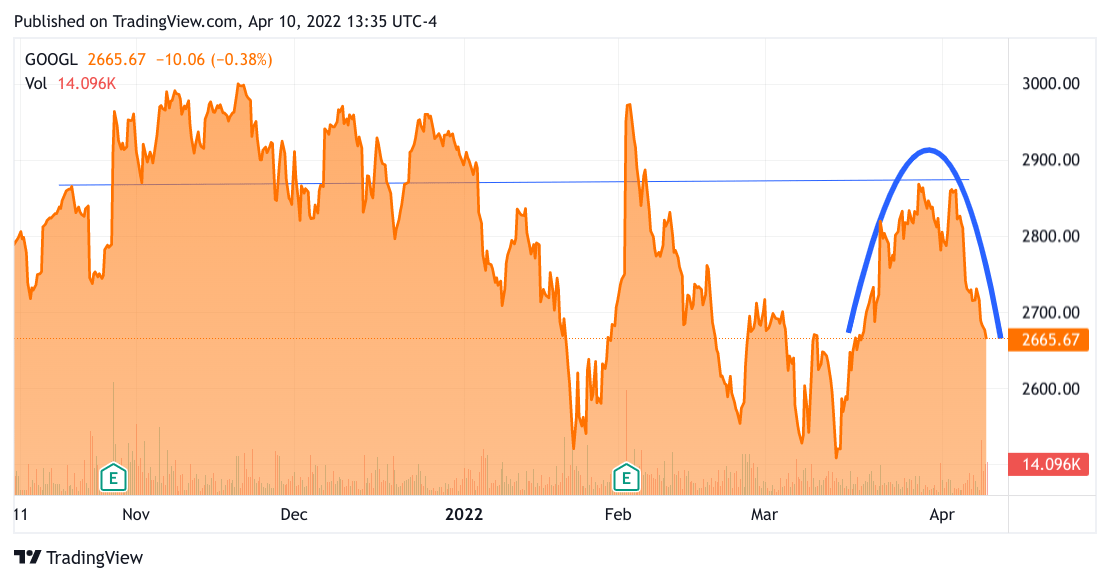
The good news is that many high-beta cloud tech names had hardly any damage in this recent selloff. Look at the charts of Intuit (INTU), Adobe (ADBE), PayPal (PYPL), and even the likes of DocuSign (DOCU) and Zoom Video (ZM) held above recent lows. Facebook (FB) is much higher than its lows, too. So where was the damage?.. Strangely, Amazon (AMZN), Microsoft (MSFT), and Alphabet (GOOGL) (GOOG) did get hurt. AMZN was doing great on the news that they will be splitting 1 to 20, it reached levels last seen in December at almost 3400. This Friday it closed at the lows and a mere skosh from the 2900 handle. GOOGL also announced a 1 to 20 stock split, on the announcement it hit a level first reached this past September, before dropping more than 200 points. The chart looks like it could fall another 100 if there is no further positive newsflow. This is not a fantastic showing for three of the trillion-dollar mega-caps. My thought is that this seems like an end-game, the fall in the Nasdaq and the Nasdaq 100 is coming mostly from these mega caps. They are the ones left that still have some weak hands. I perfectly understand if some of you are taking this with a grain or two of salt since I lean bullish most times. So let’s take a look at some charts, I will illustrate and annotate to make my case, and you can decide on your own. Let’s take a look at FB and a 3 months chart.
TradingView
The above is a super simple chart where FB fell precipitously as all tech did at the beginning of the year, yet since the latter half of March, we see a fairly even level, even when the Nasdaq took a big dive recently. To my mind, this means that FB has bottomed and is a good risk for further gains once the 10-year consolidates its new level. Now let’s take a look at Amazon, at the 6-month chart.
TradingView
As I said earlier on the news of the 20 for 1 split. AMZN reached levels not seen since December. During the recent strong selling in the Nasdaq, we see that AMZN has rolled over significantly. Please note that this rollover has already broken through recent support and under further pressure will break below 3000 perhaps as low as 2800. AMZN has not yet built a strong base. If the 10-year takes a leg higher, perhaps touching 2.8% I suspect selling will continue. I am basing this on the chart. However, if AMZN has some bullish news then, of course, nothing is stopping it from changing directions. Let’s take another look at another member of the trillion-dollar club: GOOGL.
TradingView
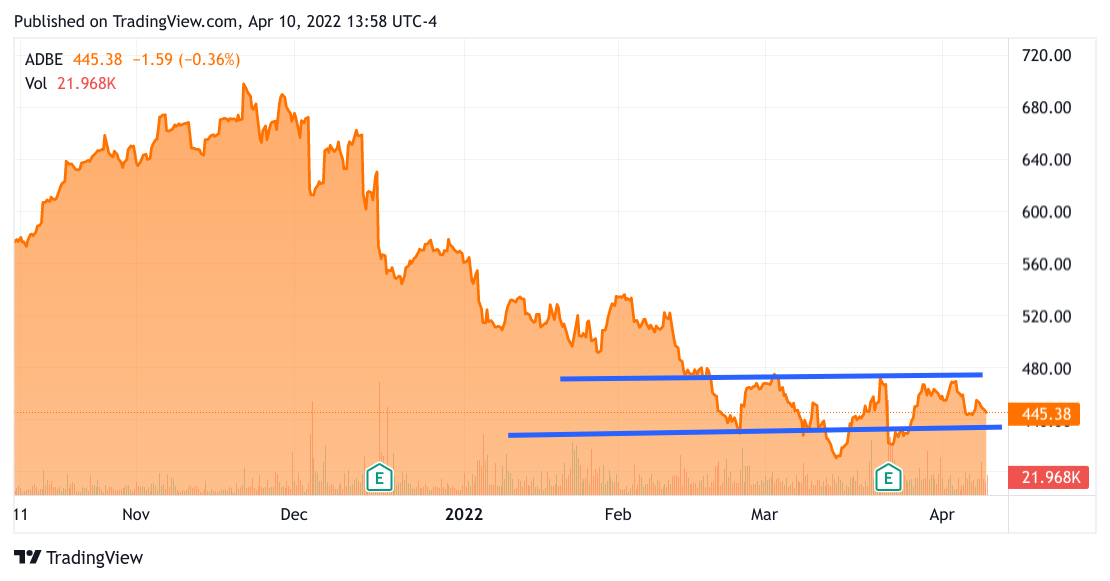
Here again, GOOGL leaped on the news of the 1 to 20 split, and again with the 10-year accelerating higher pressured the Nasdaq, and GOOGL rolled over as well. I am making the case that the biggest names were responsible for most of the recent losses in the Nasdaq. Now let’s sample some well-known names that I believe have already discounted inflation or higher rates, starting with that ½ point raise in May, and perhaps beyond. First, let’s look at ADBE.
TradingView
This is again the 6-month chart for ADBE. Perhaps ADBE is a bit more volatile than FB but still quite different than GOOGL or AMZN. Let’s take a look at PYPL, again at the 6-month chart.
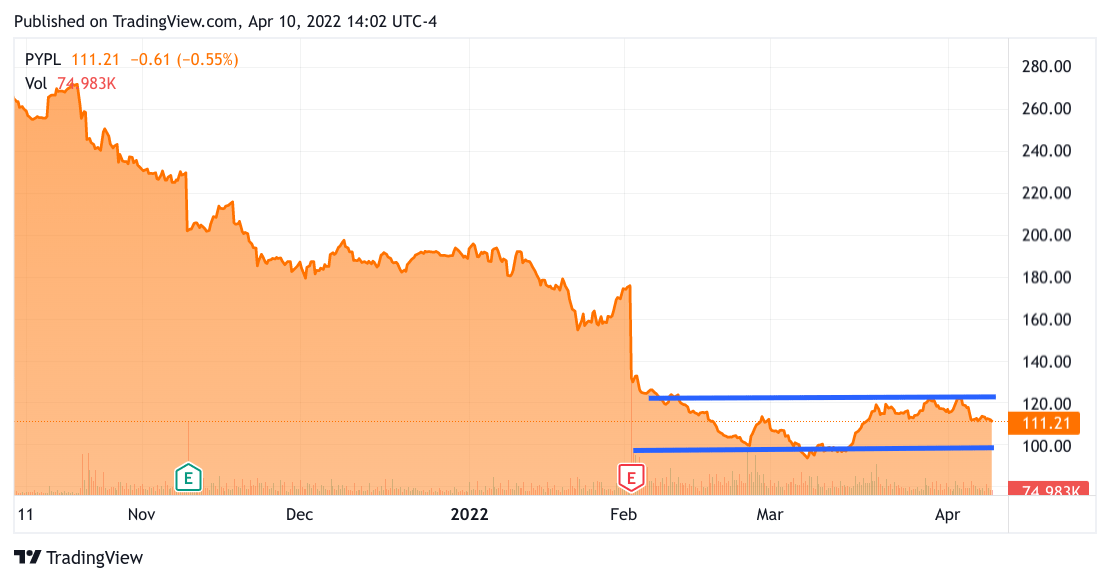
TradingView
This PYPL chart is nearly identical to the ADBE, and FB. I think this chart comparison exercise between the Mega-caps and the former name illustrates several notions:
-
Many tech names below the mega-class level, have already bottomed.
-
The fall in the Nasdaq was primarily due to the trillionaire stocks like AMZN and GOOGL.
-
This comparison justifies not only holding names like ADBE, FB, PYPL, INTU, and other top-end cloud stocks but to adding to the positions or beginning new positions in these names and others like this.
I started this piece with the recognition of a pattern similar to the prior 10-year leap to 1.79%. It is now happening with this quick move to 2.7%, what can we project from this thesis
-
The upward move in the 10-year should soon peter out. If only because a US 10-year treasury at 2.7% to the rest of the world is fantastically competitive.
-
If the pattern is active then once the interest rate settles down the tech names will once again start rallying.
-
I will use these next few weeks to add to my positions in non-Mega-cap tech.
Separately I think MSFT, AMZN, and GOOGL have a good chance to continue rolling over the next 5 trading days as the 10-year will mark out its peak in this new trading range. None of these names have broken out to new highs in many months, and it’s clear that there is a lot of overhead supply in these names. There will have to be some new news that will finally propel them to even approach their old highs. Right now, they seem to be a source of funds whenever they have an inside rally. New money is going into Ag, Oil, Nat Gas, Chemicals and perhaps some select industrial metals like Nickel, Lithium.
I’m not neglecting energy either
Even as my tech names were getting hit. I am glad that I put aside my emotions and got very aggressive with oil & nat gas names. They blunted my losses in my overall portfolio, I also did some hedging as I discussed below. How long will I add to this sector? I expect Oil to reach that 130 level again. The drop in oil price is due to the release of the SPR. I suspect it is not going to move the needle in the end, even if they can get the 1 Million BPD, and as I said earlier I question whether the SPR release will reach anywhere close. Oil will inch up, with WTI moving strongly above 100 and nat gas/LNG will rise as well. Once WTI reaches 110, I will stop accumulating EnP names and begin reducing, with sharper selling if it hits 130 before the driving season.
My Trades
I think my setup of oils, ag, refiners, and intermediate chemicals from refining is a great counterbalance for tech. I successfully deployed some hedging, unfortunately, I closed early, but if I would have held my SPXS, SQQQ, and UVXY positions I would have done even better. Once the VIX falls below 20 again, I will start my hedging again.
I added to my Devon (DVN) call options, and I opened call positions in Kosmos Energy (KOS). I also went long on some Puts on DWAC. This is not an expression of any political stance. It is just that the optimism for the future of Twitter (TWTR) being more open to conservative concerns makes DWAC and its eventual future reverse merger with Truth Social that much less necessary. Also, there were several recent high-level resignations from the venture. Finally, if market participants are going to dump non-profitable stocks, this one qualifies as well.
I have my eye out for more opportunities to bet on the downside. I am thinking of betting against further upside in HP Inc. (HPQ) Now that Buffett has made his big investment, I don’t know what news will come along to take it higher. I think TWTR may also have similar behavior. Now that Musk is on the board and made that large investment.
For refiners, I added Phillips 66 (PSX), a broad-based refiner to my list of specialty refiners, Calumet (CLMT), Holly Energy Partners (HEP), and Vertex (VTNR). I looked at the PSX chart and I realized that it had not broken out to new highs, so I initiated a position on that big boy.
For my Frackers, I was happy that I added to my Coterra (CTRA), and Occidental (OXY), also started with Range Resources (RRC). Finally, I added Apache (APA), Earthstone (ESTE), and Kosmos (KOS).
For LNG, I added shares to Tellurian (TELL), New Fortress Energy (NFE), FLEX LNG (FLNG).
If I haven’t made this clear, I still expect volatility as the 10-Year tries to move a bit higher. On the other side of the coin, there are some green shoots on the side of lowering price pressures. A big one is trucking rates, they have fallen notably of late, also inventories are growing again. As they get back toward normal levels, prices, in general, will fall. Be prepared for more chatter about the Fed not needing to take that 0.50% raise, but they likely will anyway. This sets up the May Fed meeting as another moment for volatility, and some good trades.
Be the first to comment