

jetcityimage/iStock via Getty Images
I think the 10-year Treasury yield topped out a hair under 3.50% in mid-June.
There was a really messy sell-off in Treasury bonds in early June, and the bond market blew past all kinds of stops to frustrate both the bulls and the bears. True, the bulls in the Treasury market are few and far between compared to the bears, but this is how major reversals are made.
In retrospect, I think what we experienced in June was a false breakout in Treasury bond yields. Prior to June, the 10-year Treasury yield had never surpassed its high from a prior Fed rate hiking cycle from the time the venerable Paul Volcker broke the back of inflation about 40 years ago (from 1979 to 1982).
Jerome Powell is no Paul Volcker, for sure. In fact, The Economist recently concluded that he is a failed Fed Chairman (see the April 23, 2022, Economist, “The Fed That Failed”). I would give him a mixed report: I think that what he did in 2020 in coordination with the Trump administration was highly necessary to avoid a second Great Depression, but I also think that in his quest to get renominated by the Biden administration, he blew it spectacularly in the second half of 2021. The extreme nature of quantitative easing in a recovering economy was completely unnecessary.
US 10-Year Government Bond (Trading Economics)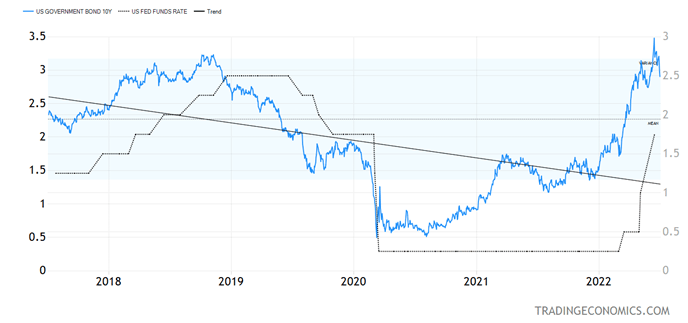
Graphs are for illustrative and discussion purposes only. Please read important disclosures at the end of this commentary.
To be fair, inflation is not a Democratic or a Republican phenomenon. To fight the economic effects of COVID closures, governments in the developed world spent as much as they did in World War II. Now we are all paying for it, but if the Fed had leaned against the effects of rampant COVID deficit spending in the second part of 2021, I think inflation would have been somewhat lower in the United States.
When the Fed is behind the curve, as they are now, they end up resorting to more aggressive tightening, which in a highly leveraged financial system may do significant damage. Let’s hope for a softish landing, but right now the economic numbers are getting weaker, and the 60-basis point decline from the recent multi-year high in Treasury yields suggests to me we have seen a top in long-term interest rates.
The Fed will keep hiking, as they have already stated, and inflation will decline with a lag as rising rents will keep pressure on the CPI. I do think the Treasury yield curve will invert later this year. Whether that means a recession or a softish landing in 2023, we will find out soon enough.
How to Trade the Fed’s Mistake
Zero-coupon Treasuries have the longest duration and most leverage – without being 2X or 3X leveraged – to a decline in Treasury yields. I think a long position in the PIMCO 25+ Year Zero Coupon U.S. Treasury Index ETF (ZROZ) should pay off handsomely in the next six months, as the upside is multiple times any possible downside, in my opinion, putting a stop on the trade at 3.51% on the 10-year Treasury yield.
PIMCO 25+ Year Zero Coupon U.S. Treasury Index ETF (ZROZ) (StockCharts)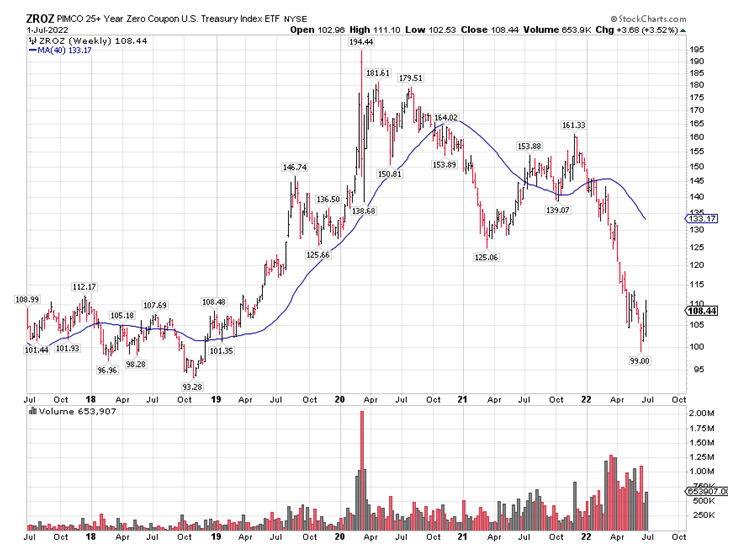
Graphs are for illustrative and discussion purposes only. Please read important disclosures at the end of this commentary.
This may be a high-conviction trade, but since I am not a clairvoyant, I cannot give any guarantees. (In order to not create any conflict of interest, I won’t be personally involved in this security.)
Gold (Trading Economics)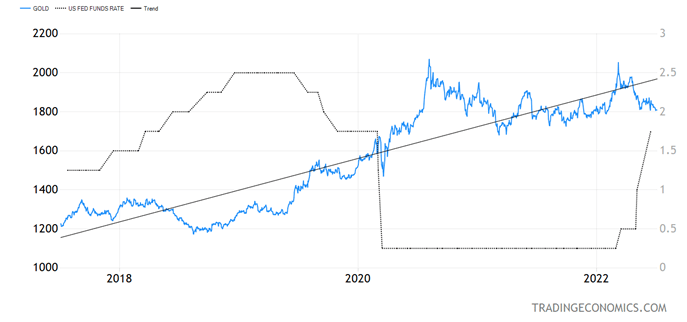
Graphs are for illustrative and discussion purposes only. Please read important disclosures at the end of this commentary.
The other way to trade the Fed’s mistake is to go long gold bullion, which has not been doing well in these highly inflationary times due to rising interest rates and a surging dollar. Neither interest rates nor the dollar should be surging by the end of 2022. When gold bullion blows past that double top a little above $2,000/oz., it may very well not see a sub-$2,000 price level again, as rising above that level would constitute a major breakout after a lengthy consolidation. This should happen in the next 6-12 months.
All content above represents the opinion of Ivan Martchev of Navellier & Associates, Inc.
Disclosure: *Navellier may hold securities in one or more investment strategies offered to its clients.
Disclaimer: Please click here for important disclosures located in the “About” section of the Navellier & Associates profile that accompany this article.
Editor’s Note: The summary bullets for this article were chosen by Seeking Alpha editors.
Be the first to comment