

yorkfoto
Earnings of CVB Financial Corp. (NASDAQ:CVBF) will continue to surge next year on the back of strong top line growth. Sticky deposit costs will help the margin expand as interest rates rise, which will in turn boost the net interest income. Further, subdued organic loan growth will boost the top line. Overall, I’m expecting CVB Financial to report earnings of $1.65 per share for 2022, up 6% year-over-year. For 2023, I’m expecting earnings to grow by 16% to $1.92 per share. Compared to my last report on the company, I haven’t changed my earnings estimates much. Next year’s target price suggests a moderate downside from the current market price. Based on the total expected return, I’m maintaining a hold rating on CVB Financial.
Non-Interest-Bearing Deposits Remain CVBF’s Biggest Strength
CVB Financial’s net interest margin continued to grow strongly during the third quarter of 2022. The margin increased by 30 basis points during the quarter, after it had increased by 26 basis points in the second quarter of the year. The rate hikes will continue to lift the margin in upcoming quarters, even though CVB Financial’s asset mix is not very favorable for the current rate environment. Securities made up 40% of total earning assets at the end of September 2022. As most securities carry fixed rates, they will hold back the average earning-asset yield as market interest rates rise.
In sharp contrast to the asset mix, the deposit mix is very favorably positioned for an up-rate cycle. Non-interest-bearing deposits made up a whopping 63.2% of total deposits at the end of September 2022. These deposits will keep the average deposit cost sticky as market interest rates rise.
The management’s interest rate simulation model shows that a 200-basis point hike in interest rates could boost the net interest income by 3.11% in the first year, and 5.85% in the second year of the rate hike, as mentioned in the 10-Q filing. Considering these factors, I’m expecting the margin to grow by ten basis points in the last quarter of 2022 and 30 basis points in 2023.
Organic Loan Growth Likely To Remain Lackluster
CVB Financial’s loan portfolio grew by 0.9% in the third quarter of 2022, which was in line with expectations. The company has relied more on acquisitions than organic growth in past years. As there are no upcoming whole bank M&A transactions, for now, I have ignored this factor when forecasting loan growth. Instead, I’m assuming that organic growth will lead the way next year. Further, CVB Financial may acquire some banking teams as per its strategy.
I don’t have much hope that organic loan growth can be better than the lackluster historical average in 2023. This is because high borrowing costs will diminish credit demand. However, the economic activity is still healthy for now. CVB Financial operates in California, where the economic activity is quite remarkable compared to the national average as well as the state’s own history.
The Federal Reserve Bank of Philadelphia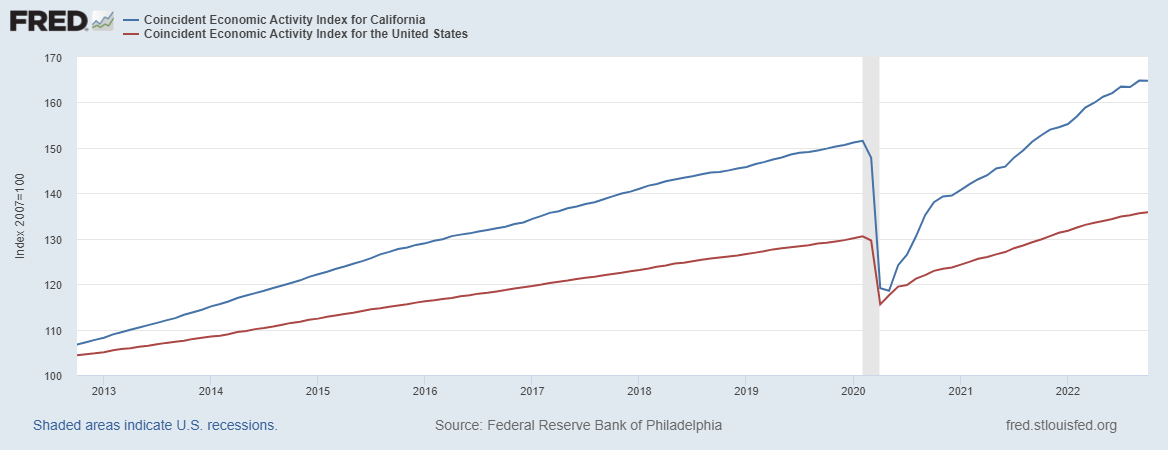
Considering these factors, I’m expecting the loan portfolio to grow by 0.75% in the last quarter of 2022, taking full-year loan growth to 11.9%. For 2023, I’m expecting the loan portfolio to grow by 3.0%.
I’m expecting deposits to grow in line with loans. However, the equity book value will suffer because of the large securities portfolio. As interest rates rise, the market value of available-for-sale, fixed-rate securities will fall, leading to unrealized mark-to-market losses. These losses will bypass the income statement and erode the equity book value through the other comprehensive income account. The equity book value per share has already declined by 24% in the first nine months of 2022. The following table shows my balance sheet estimates.
| Financial Position | FY18 | FY19 | FY20 | FY21 | FY22E | FY23E |
| Net Loans | 7,701 | 7,496 | 8,255 | 7,823 | 8,757 | 9,022 |
| Growth of Net Loans | 61.4% | (2.7)% | 10.1% | (5.2)% | 11.9% | 3.0% |
| Other Earning Assets | 2,506 | 2,445 | 4,857 | 6,778 | 6,064 | 6,248 |
| Deposits | 8,827 | 8,705 | 11,737 | 12,976 | 13,976 | 14,400 |
| Borrowings and Sub-Debt | 768 | 477 | 530 | 695 | 480 | 495 |
| Common equity | 1,851 | 1,994 | 2,008 | 2,082 | 1,815 | 1,871 |
| Book Value Per Share ($) | 15.2 | 14.3 | 14.7 | 15.4 | 13.1 | 13.5 |
| Tangible BVPS ($) | 9.3 | 9.2 | 9.6 | 10.3 | 7.4 | 7.8 |
| Source: SEC Filings, Author’s Estimates (In USD million unless otherwise specified) | ||||||
Expecting Earnings To Surge By 16% Next Year
The outlook for the net interest income remains bright due to the anticipated loan growth and margin expansion. On the other hand, inflation-driven growth of non-interest expenses will curb earnings growth. Further, non-interest income will come under pressure due to lower trust fee income and investment management income as assets under management have declined recently due to the market rout. Moreover, a large client with more than $800 million in assets has recently moved to another financial institution, as mentioned in the conference call.
Overall, I’m expecting CVB Financial to report earnings of $1.65 per share for 2022, up 6% year-over-year, and $1.92 per share for 2023, up 16% year-over-year. The following table shows my income statement estimates.
| Income Statement | FY18 | FY19 | FY20 | FY21 | FY22E | FY23E |
| Net interest income | 349 | 436 | 416 | 415 | 504 | 586 |
| Provision for loan losses | 2 | 5 | 24 | (26) | 11 | 10 |
| Non-interest income | 43 | 59 | 50 | 47 | 49 | 47 |
| Non-interest expense | 180 | 199 | 193 | 190 | 217 | 244 |
| Net income – Common Sh. | 152 | 207 | 177 | 212 | 232 | 267 |
| EPS – Diluted ($) | 1.24 | 1.48 | 1.30 | 1.56 | 1.65 | 1.92 |
| Source: SEC Filings, Earnings Releases, Author’s Estimates(In USD million unless otherwise specified) | ||||||
In my last report on CVB Financial, I estimated earnings of $1.58 per share for 2022 and $1.93 per share for 2023. I haven’t changed my earnings estimates much because the third quarter’s financial results were in line with expectations. Further, my macroeconomic outlook hasn’t changed much since the issuance of that last report.
My estimates are based on certain macroeconomic assumptions that may not come to fruition. Therefore, actual earnings can differ materially from my estimates.
Maintaining A Hold Rating
CVB Financial is offering a dividend yield of 3.1% at the current quarterly dividend rate of $0.20 per share. The earnings and dividend estimates suggest a payout ratio of 41.6% for 2023, which is below the five-year average of 50.5%. Therefore, there is room for a dividend hike. However, I’m not expecting an increase in the dividend level because CVBF does not change its dividend often. The company only recently increased its dividend in the third quarter, and so the next hike could be a long way off.
I’m using the historical price-to-tangible book (“P/TB”) and price-to-earnings (“P/E”) multiples to value CVB Financial. The stock has traded at an average P/TB ratio of 2.20 in the past, as shown below.
| FY18 | FY19 | FY20 | FY21 | Average | ||
| T. Book Value per Share ($) | 9.3 | 9.2 | 9.6 | 10.3 | ||
| Average Market Price ($) | 23.0 | 21.3 | 19.0 | 20.9 | ||
| Historical P/TB | 2.48x | 2.32x | 1.97x | 2.03x | 2.20x | |
| Source: Company Financials, Yahoo Finance, Author’s Estimates | ||||||
Multiplying the average P/TB multiple with the forecast tangible book value per share of $7.8 gives a target price of $17.1 for the end of 2023. This price target implies a 34.6% downside from the December 23 closing price. The following table shows the sensitivity of the target price to the P/TB ratio.
| P/TB Multiple | 2.00x | 2.10x | 2.20x | 2.30x | 2.40x |
| TBVPS – Dec 2023 ($) | 7.8 | 7.8 | 7.8 | 7.8 | 7.8 |
| Target Price ($) | 15.6 | 16.4 | 17.1 | 17.9 | 18.7 |
| Market Price ($) | 26.2 | 26.2 | 26.2 | 26.2 | 26.2 |
| Upside/(Downside) | (40.5)% | (37.5)% | (34.6)% | (31.6)% | (28.6)% |
| Source: Author’s Estimates |
The stock has traded at an average P/E ratio of around 15.2x in the past, as shown below.
| FY18 | FY19 | FY20 | FY21 | Average | ||
| Earnings per Share ($) | 1.24 | 1.48 | 1.30 | 1.56 | ||
| Average Market Price ($) | 23.0 | 21.3 | 19.0 | 20.9 | ||
| Historical P/E | 18.5x | 14.4x | 14.6x | 13.4x | 15.2x | |
| Source: Company Financials, Yahoo Finance, Author’s Estimates | ||||||
Multiplying the average P/E multiple with the forecast earnings per share of $1.92 gives a target price of $29.3 for the end of 2023. This price target implies an 11.8% upside from the December 23 closing price. The following table shows the sensitivity of the target price to the P/E ratio.
| P/E Multiple | 13.2x | 14.2x | 15.2x | 16.2x | 17.2x |
| EPS 2023 ($) | 1.92 | 1.92 | 1.92 | 1.92 | 1.92 |
| Target Price ($) | 25.4 | 27.4 | 29.3 | 31.2 | 33.1 |
| Market Price ($) | 26.2 | 26.2 | 26.2 | 26.2 | 26.2 |
| Upside/(Downside) | (2.9)% | 4.5% | 11.8% | 19.2% | 26.5% |
| Source: Author’s Estimates |
Equally weighting the target prices from the two valuation methods gives a combined target price of $23.2, which implies an 11.4% downside from the current market price. Adding the forward dividend yield gives a total expected return of negative 8.3%. Hence, I’m maintaining a hold rating on CVB Financial.
Be the first to comment