

Jorge Villalba
Note: This report was previously shared with members of Value Investor’s Edge on October 25th, 2022.
Box Leasing Overview
Textainer Group (NYSE:TGH) is one of the largest container lessors in the world, second only to Triton International (NYSE:TRTN), the largest publicly traded entity in the space. Both companies have posted strong performance since the depths of the pandemic, but they are still trading at a large discount to normalized valuations. TGH trades even cheaper than TRTN even as free cash flow is surging, backed by long-term contracts extending, in some cases, into the 2030s.
TGH and TRTN are leasing companies; they acquire the underlying asset, in this case, container boxes, and lease them to liners, who use those in their day-to-day operations. As is the case in other industries, leasing allows for capacity additions with minimal capex outlay for the lessee.
TGH, similarly to TRTN, pursued a gigantic growth program throughout 2021, taking delivery of $2B worth of containers, which, for illustrative purposes, represents more than the company’s current market capitalization. The growth program was secured at very attractive terms, both considering the long-term nature of most contracts as well as regarding the cash-on-cash returns (estimated at slightly above 10%).
TGH and TRTN run leveraged operations, but this is not concerning given the nature of the long-term contracts on the boxes as well as due to the extremely low margins they have managed to secure the cost of their indebtedness at. Rising interest rates are a significant concern for leveraged companies in the prevailing interest rate environment, but 91% TGH’s debt and 86% of TRTN’s indebtedness is either fixed or hedged, which protects these firms against rising interest rates (both firms strive to match contract duration with fixed/hedged debt duration).
Last year, growth capex weighed on shareholder returns, but alongside Q2-22 results the amount of cash spent on share repurchases increased substantially on a quarter-over-quarter basis, and I expect additional increases going forward. I also expect both entities to raise their dividends in the near-term (although TGH’s dividend raise should be larger and will most likely be announced alongside the upcoming Q3 results in a few weeks).
Container Box Leasing
TGH and TRTN are leasing companies, similar to the likes of AerCap (AER) in the aviation industry, but instead of leasing aircraft, they lease container boxes. The lead time for ordering new containers amounts to a few months, generally from three to six, which provides a lot of flexibility to market participants relative to other leasing markets such as shipping, where lead times tend to be closer to two years.
For good or ill, this tends to smooth out the extreme volatility other shipping segments experience, considering supply can more easily adjust to both upturns and downturns (although the container box leasing market has also experienced a boom alongside the containership sector).
As can be seen in the image below, new box pricing tends to vary from around $1,500 to $2,500/TEU, with 2021 being the most notable exception, with prices reaching nearly $4,000/TEU, although they have eased significantly over the past few months and are back at the higher end of normalized historical pricing (and will most likely continue to ease going forward, depending on global steel prices).
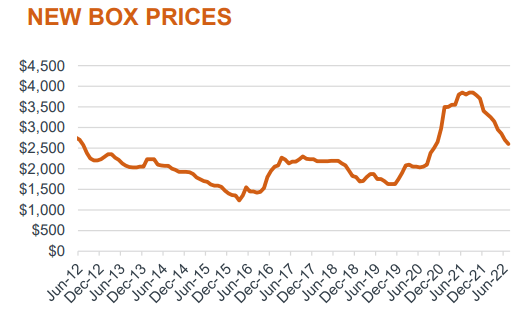
Source: TRTN’s August Presentation, slide 17.
The substantial increase in containerized demand due to both port congestion and higher demand resulted in a similar increase in demand for container boxes, exerting a positive effect on box leasing rates, which ultimately led to a substantial increase in newbuild ordering, as can be seen in the image below. Box additions to the overall fleet doubled from 2020 to 2021; however, orders/deliveries have started 2022 on a weaker note, as can be seen in the image below.
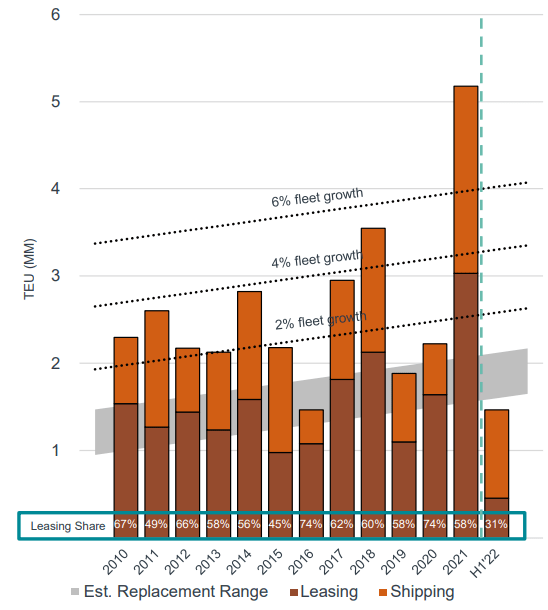
Source: TRTN’s August Presentation, slide 18.
Regarding the supply side of the container box market, the four largest manufacturers account for more than 90% of global production volume (link), both for the dry and the refrigerated markets. Both TRTN and TGH have built extensive relationships with these manufacturers, whereas there is little incentive to compete on price and saturate the market given the concentrated nature of the sector.
As can be seen in the image below, tightness in the container box leasing market led to very high second-hand pricing, which resulted in a decent increase in profitability for both TGH and TRTN. For instance, TGH’s gain on sale of owned fleet containers increased from $27.2M in 2020 to $67.2M in 2021, whereas in H1-22 they have realized closer to $39.1M. TRTN is in a similar position, with gains on sales increasing from $37.7M in 2020 to $107M in 2021, followed by a further $64M in gains in H1-22.
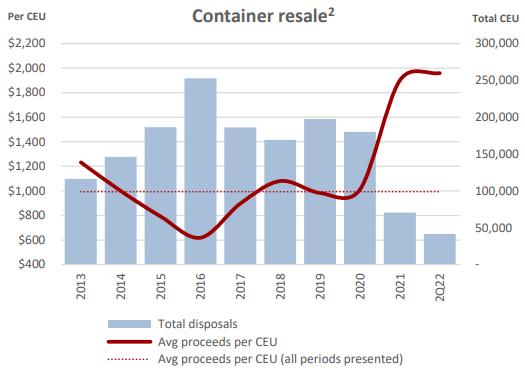
Source: TGH’s Q2 earnings presentation, slide 8.
Gains on sales have been significant, with some boxes sold for more than they were initially purchased for over a decade prior! However, going forward, I expect gains on sales to normalize (thus exerting downward pressure on current profitability levels from legacy boxes). Though, increased volumes should offset part of this effect (i.e., pricing on a per box basis will be significantly lower, but volumes will increase noticeably, offsetting part of the effect).
However, core profitability is set to remain well above historical averages due to the growth which came online throughout 2021 and during early-2022. A significant portion of the growth secured throughout 2021 (as well as some legacy leases renegotiated throughout prevailing strength) cover the entire life of the boxes, underpinning long-term returns, extending into the early-2030s.
Financial Profile
Container box lessors carry heavily indebted balance sheets; however, this is not a major concern given the amount of fixed-rate and hedges they hold. In the image below, we can see the profile of TGH’s indebtedness. 91% of it is either fixed or hedged, which will help isolate performance from interest rate gyrations. Interest costs will increase as floating rate debt has become much pricier, but the overall effect should remain contained and overall debt levels will come down over time.
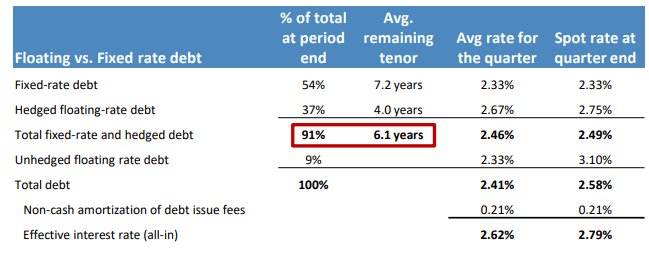
Source: TGH’s Q2 earnings presentation, slide 13.
TGH currently has a debt to assets (“D/A”) ratio of around 72%, whereas, as a rule of thumb, new boxes are initially leveraged at closer to 80%. TRTN is in a similar position, with its debt to assets sitting at 67%. The latter also carries a decent amount of fixed or hedged debt, with 86% of outstanding indebtedness (as of Q2-22) covered against interest rate increases.
Considering the amount of debt on both TGH’s and TRTN’s balance sheets, if they were unhedged, they would be an obvious avoid (or even short) amidst current market conditions. However, both companies have done an outstanding job fixing their interest rate exposure, usually for period lengths similar to their fixed-rate rental periods, limiting volatility and locking-in long-term returns.
Interest costs will increase, that’s a given, but the near- as well as medium-term impact should be limited given the extensive fixed-rate debt and hedges. Regarding the impact interest rate increases will have on the company’s operations and returns, those should also be rather limited; new leases will have to be repriced higher (to account for the new interest rate environment), or else no new orders will be placed by TRTN and TGH.
TRTN does have a slight edge regarding interest rate margins, reporting an effective interest rate of 2.54% for Q2, whereas TGH’s effective interest rate came in at closer to 2.62%. Though, TGH does have slightly higher fixed-rate cover (as of Q2 end), which should provide a tailwind going forward.
Valuation Review
Both companies provide insightful commentary on their cash flow profile and on the potential avenues for future capital allocation. In the image below, we can see TRTN’s OCF profile (Q2 annualized). Even after spending $900M in replacement capex (which “approximates depreciation, NBV of disposals, and principal payments on finance leases”), the company is currently trading at a FCFe yield of 19.8% (the company is trading below the levels used to make the calculations below). And this is even after factoring in future replacement capex!
Source: TRTN’s Q2 earnings presentation, slide 10.
If we wanted to be a tad more conservative, and decided to increase run-rate interest expenses by $10M/qtr (a 18.2% increase over Q2 levels) and to reduce net gains on sales to closer to $5M/qtr (which seems on the very conservative side in the medium-term), cash flow before capex would decrease to around $1,450M, which would still represent a 15.3% FCFe yield after deducting replacement capex, which is a significant return from a firm with such long-term contracts.
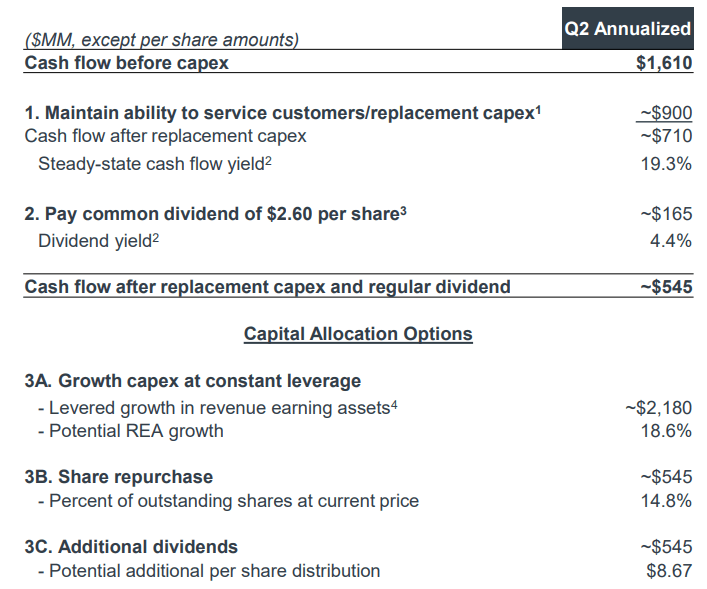
In the image below we can see a similar slide for TGH. Assuming the company spends the estimated $652M in replacement capex, which at an 80% D/A would imply a $130.4M equity outlay, FCFe would amount to $418M, for a 31.2% yield on current pricing.
Source: TGH’s Q2 earnings presentation, slide 14.
However, to be on the conservative side, we could increase quarterly interest expenses by around $7M from Q2 levels (15.7% increase), while also lowering gains on sales to $3M (which is very conservative given historical pricing and sales volumes). These changes would decrease net cash available for capital allocation (after debt service) by $108.8M, to $440.6M, which after replacement capex, would ultimately lead to a FCFe yield of around 23.1%.
TGH does seem to be trading at a higher FCF yield after replacement capex, but TRTN has a slight edge regarding interest rate costs and ROE, while also being the market leader (which should lead to a slight premium). Regarding stated ROEs, TRTN has been consistently able to generate a higher ROE than TGH; annualizing Q2 results, TRTN generated a 29.8% return on equity, relative to TGH’s 20%.
However, this is already accounted for by the market considering TRTN is trading at a hefty premium to book value, whereas TGH is trading at a discount. As of Q2-22, TRTN had a book equity value of $3.3B, including $730M in preferred stock, for a net common shareholder equity value of closer to $2.57B, which compares to the company’s current market cap of $3.59B (P/B of 1.40x). However, TGH had, as of Q2-22, total equity of $1.926M, including $300M in preferred equity, for a net common shareholder equity value of $1.626M, relative to the company’s current market cap of $1.34B, for a P/B of 0.82x.
High ROEs tend to lead to higher long-term returns as cash can be reinvested at higher returns, but the discount to book value on TGH offsets this effect. When taking into consideration book values, the market is assigning TRTN an implied ROE of 21.3%, while valuing TGH at closer to 24.4% (20% ROE / 0.82 P/B for TGH and 29.8% ROE / 1.4 P/B for TRTN).
Catalysts: Share Repurchases and Dividend Increases
TGH and TRTN have been consistently deploying part of their FCF towards share repurchases. Throughout the first half of the year, TGH repurchased $81.4M worth of shares ($36.3M in Q1 and $45.1M in Q2). The concrete number of shares repurchased throughout H1-22 is 2.38M, amounting to slightly below 5% of the outstanding. Since the inception of the program in Q3-19, TGH has repurchased 22% of their outstanding shares!
The most interesting tidbit is that repurchases throughout 2021 were well below normalized potential due to the huge capex TGH (as well as TRTN) underwent. As spending normalizes, share repurchase spending should continue to increase, accreting shareholder value. Interestingly, the amount spent on repurchases increased by around 24% on a q/q basis from Q1 to Q2, and spending should continue to trend higher going forward.
TRTN has also been active with its share repurchase authorization program, buying back 3.09M shares during the first half of the year (and an additional 850k shares from July 1st to July 26th). During H1-22 (to make it comparable to TGH’s numbers), TRTN repurchased 4.6% of the outstanding, and I also expect to see an increase in repurchases going forward (repurchases throughout July provided a glimpse of what I expect going forward).
Share repurchases are not the only vehicle these companies use for shareholder returns, as both entities also distribute dividends on a quarterly basis. TRTN is more generous in that regard, currently distributing $0.65/sh per quarter, which yields around 4.5%; the dividend was raised last October by 15%, and I expect to see a similar raise this year.
TGH’s dividend currently amounts to $0.25/sh per quarter and represents a 3.5% yield at prevailing pricing. TGH reinstated its dividend policy alongside Q3-21 results, and I expect a sizable dividend increase alongside the upcoming quarterly results. A doubling of the dividend would be certainly welcome, but I expect them to ultimately go for a range of between $0.30-$0.40/sh. The company could easily afford a higher payout, but repurchasing shares at prevailing pricing is also immensely attractive, so it’s not easy to balance the two (whereas management tends to be on the conservative side, which is not a bad thing either).
I expect both TRTN and TGH to boost their dividends soon, although TGH’s boost should be larger than TRTN’s. Additionally, I also expect share repurchases to continue humming along, accreting significant value given the discounted valuation both companies trade at.
Conclusion: Both TGH and TRTN Seem Attractive
Both TGH and TRTN are trading at attractive prices relative to their FCF generation capabilities, especially the former. TRTN is the larger entity and does have a small interest rate advantage (which could be viewed as a competitive advantage in the leasing industry). However, TGH is trading at a sizable discount to book and has higher per-share expected free cash flow, offsetting this effect.
Both companies underwent a comprehensive growth program throughout 2021 which set a solid foundation for longer-term returns going forward. Accelerated growth spending is now coming to an end, which should lead to higher spending on share repurchases going forward. Furthermore, I also expect TRTN and, especially, TGH to announce substantial dividend raises over the coming years.
TGH and TRTN have done an outstanding job managing their indebtedness, taking advantage of the low interest rate environment after the pandemic to secure long-term fixed-rate debt at very attractive terms. When coupled with outstanding hedges, the impact of higher interest rates should remain limited in the near- to medium-term.
Part of the current earnings boom is attributable to extremely high disposal pricing for older boxes; however, even after sales pricing normalizes, both entities will still have a large charterbook, resulting in solid returns over the medium- and longer-term, whereas gains on sales should remain supported by higher volumes.
I believe both TRTN and TGH are a buy at current pricing, providing a solid foundation for long-term returns. At the moment, TGH is trading at a more attractive valuation (implied ROE and FCFe), but TRTN has historically traded at a premium (which otherwise makes sense given the latter being the industry leader). These two entities are the closest it gets to potential “long-term” holds in the shipping industry.
Be the first to comment