

artisteer/iStock via Getty Images
Investment Thesis
Texas Instruments (NASDAQ:TXN) delivered a massive $560M beat in FQ2’22 revenues, partly due to its prudent guidance impacted by China’s Zero Covid Policy then. Despite the fears of recession and demand destruction, TXN proved Mr. Market wrong with tremendous growth across most markets, especially in the automotive, industrial, and enterprise segments. Notably, the first two segments form 62% of its revenues in FY2021, recording a notable increase of 5 percentage points YoY and 42 points from FY2013 levels.
These two segments would prove to be TXN’s revenue driver moving forward, assuming a successful pivot on its production side. The global demand from data center and EV automotive markets remain robust, with the projected market size of $517.17B and $823.75b by 2030, while growing at an excellent CAGR of 10.5% and 18.2%, respectively. Therefore, it is evident that the recent semi-market reaction was overblown post PC destruction, since the overall global semiconductor market is also expected to grow from $527.8B in 2021 to $1.38T in 2029 at a remarkable CAGR of 12.2%.
TXN Is Showing Massive Resilience Due To Its Broad Exposure In Multiple Segments
S&P Capital IQ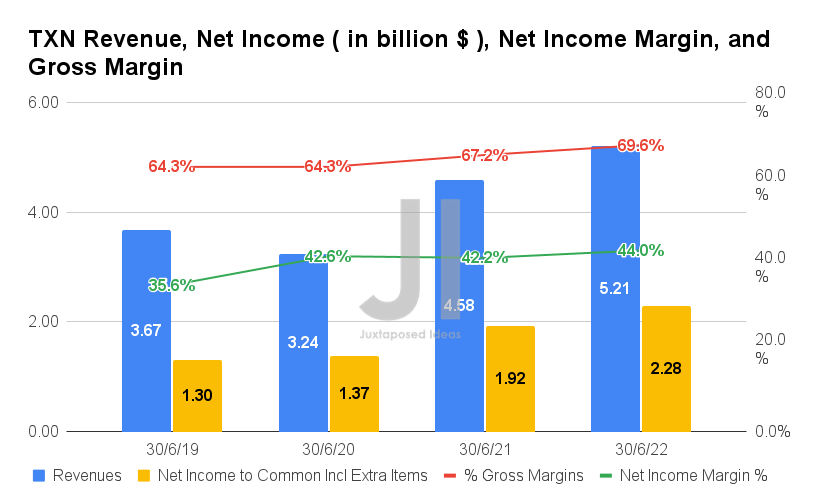
In FQ2’22, TXN reported revenues of $5.21B and gross margins of 69.6%, representing YoY growth of 13.7% and 2.4 percentage points, respectively, despite the rising inflation and global supply chain issues. In addition, the company reported excellent profitability, with net incomes of $2.28B and net income margins of 44% in FQ2’22, representing an increase of 18.7% and 1.8 percentage points YoY, respectively.
S&P Capital IQ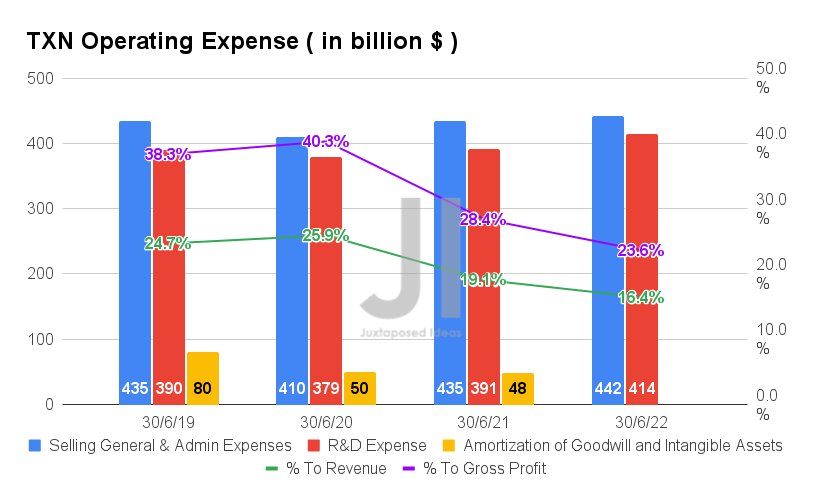
In addition, TXN has shown competent cost management, given the continuous decline in its operating margins thus far. By FQ2’22, the company reported $856M of operating expenses, representing a notable decrease of 2% YoY despite inflationary pressures. Compared to its growing sales, the ratio to its revenues has continued to moderate to 16.4%, and the ratio to its gross profits to 23.6% by FQ2’22. It represented massive improvements compared to 19.1%/ 28.4% in FQ2’21 and 24.7%/ 38.3% in FQ2’19, respectively. Therefore, it is no wonder that TXN has reported sustained growth in its profitability thus far.
S&P Capital IQ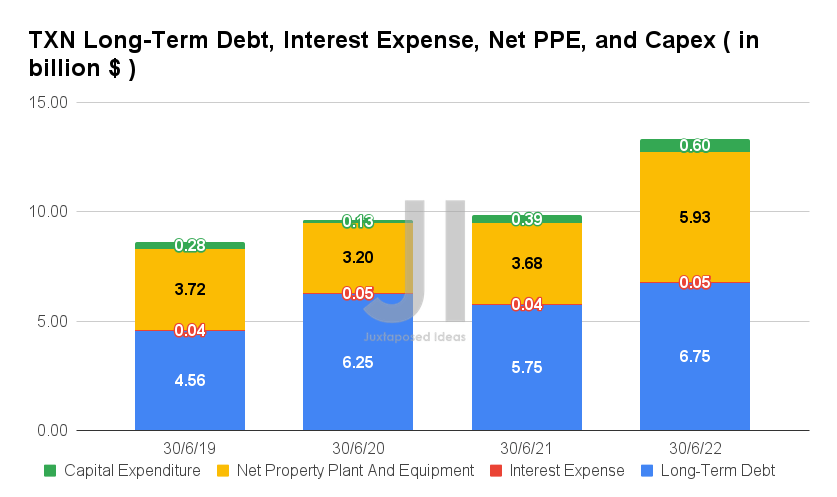
Given the massive and robust demand in the global data center and automotive markets, TXN continues to invest accordingly to ensure its competitiveness and sufficient production capacity in the future. By FQ2’22, the company reported R&D expenses of $0.41B, capital expenditure of $0.6B, and net PPE assets of $5.93B, representing a massive increase of 5.8%, 53.8%, and 61.1% YoY, respectively. The latter two were mainly attributed to the ramp-up of its production capacity in Richardson Texas by FQ3’22, Utah by 2023, and Sherman Texas by 2025.
TXN Long-Term Debt Maturities
S&P Capital IQ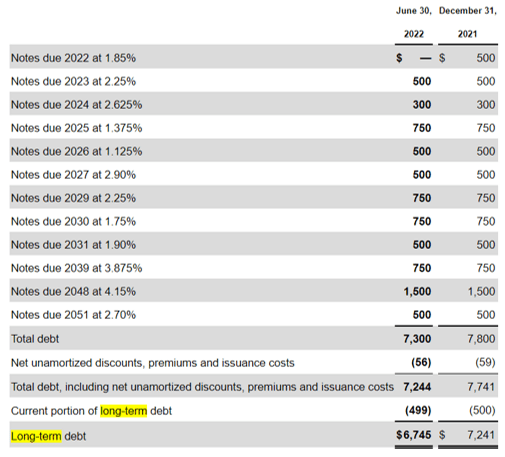
In contrast, TXN has displayed its competence through a minimal increase in long-term debts by 17.3% YoY to $6.75B in FQ2’22. This has resulted in a minimal increase in interest expenses to $0.05B in the latest quarter, thereby safeguarding the company’s liquidity in the long term. The company continued to raise more capital in August 2022 for debt maturities in 2032 and 2052. A cleverly staggered schedule also gives TXN a total debt maturity of just $800M by FY2024, which is of minimal concern due to its impressive cash and equivalents.
S&P Capital IQ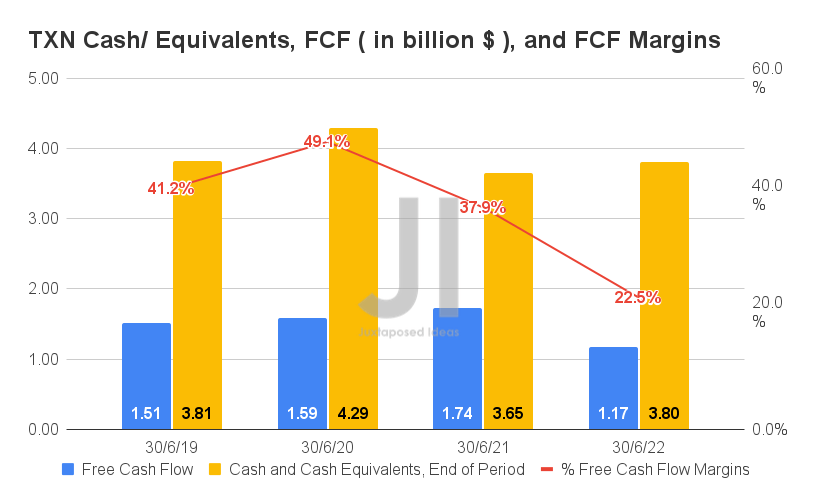
By FQ2’22, TXN reported $1.17B of Free Cash Flow (FCF) and an FCF margin of 22.5%, representing a notable decline of -32.7% and -15.4 percentage points YoY, respectively. However, investors should not be concerned, since most of it is attributed to its increased capital expenditure spending, which would prove to be top and bottom line accretive in the long-term. In the meantime, TXN’s cash and equivalents of $3.8B on its balance sheet remain robust for now.
S&P Capital IQ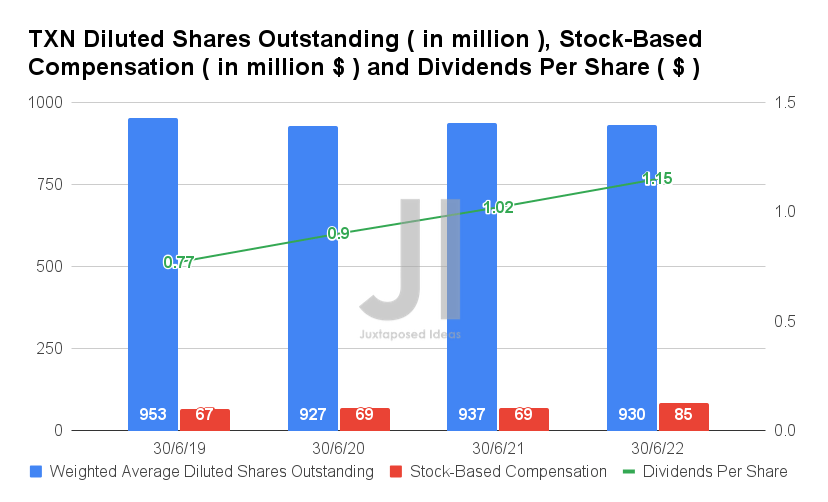
Long-term TXN investors should also be glad to see a continued increase in its dividend payouts at a CAGR of 14.31% in the past three years, with a satisfactory dividend yield of 2.71%. Despite the sudden jump in its Stock-Based Compensation (SBC) from $69M in FQ2’21 to $85M in FQ2’22, it is essential to note that its diluted shares outstanding remain stable at 930M at the same time. Therefore, quelling investors’ fear about share dilution for now.
S&P Capital IQ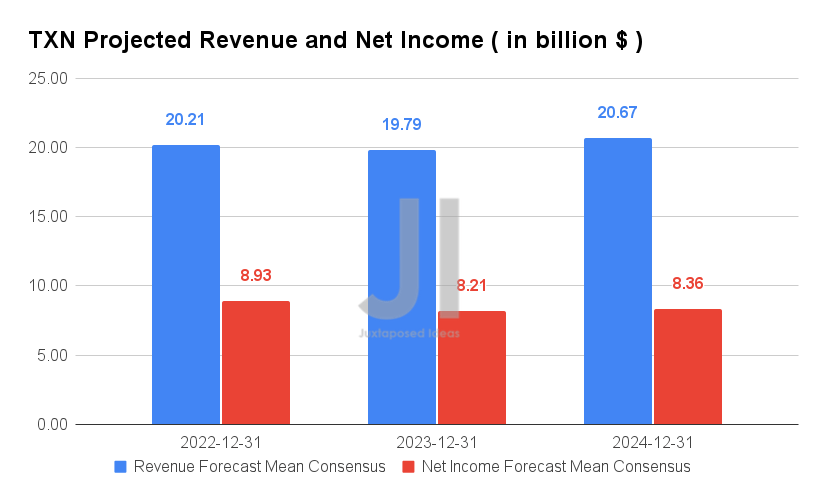
Over the next three years, TXN is expected to report a relatively inline revenue and net income growth, post-pandemic and reopening cadence. Thereby, pointing to the massive pulled-forward growth in FY2021 and FY2022 at a projected CAGR of 18.22%, compared to the minimal CAGR of 1.96% between FY2016 and FY2020. Nonetheless, consensus estimates remain highly optimistic about TXN’s profitability, given the projected growth in its net income margins from 34.9% in FY2019 to 40.4% in FY2024.
For FY2022, TXN is expected to report revenues of $20.21B and net incomes of $8.93B, representing YoY growth of 10.1% and 15%, respectively. Otherwise, a tremendous increase of 40.5% and 78.2% from FY2019 levels, respectively. In the meantime, the company had released exemplary FQ3’22 revenue guidance of up to $5.3B and EPS of up to $2.51, against consensus estimates of $4.65B and $2.15, respectively. Impressive indeed, thereby, leading to the stock’s rally of 15.2% to $185.40 in the two weeks post-earnings call.
Nonetheless, it remains to be seen if the TXN stock could sustain these levels, given the worsening macroeconomics and the Fed’s potentially drastic interest hike in September.
So, Is TXN Stock A Buy, Sell, or Hold?
TXN 5Y EV/Revenue and P/E Valuations
S&P Capital IQ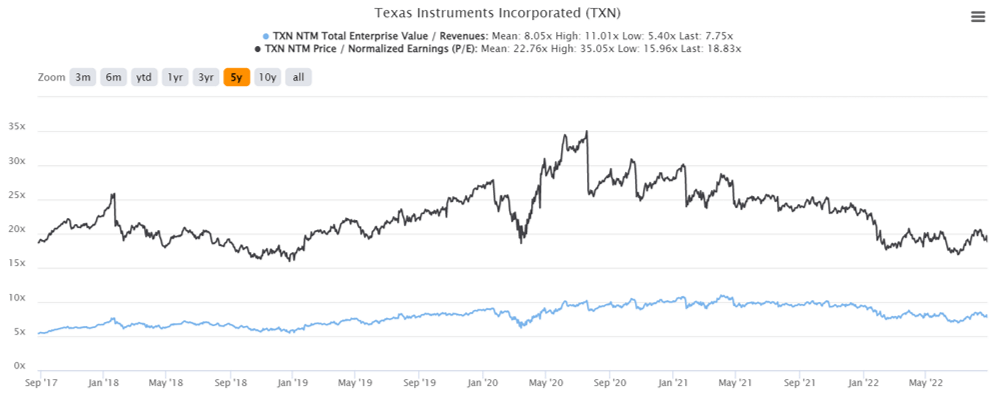
TXN is currently trading at an EV/NTM Revenue of 7.75x and NTM P/E of 18.83x, lower than its 5Y mean of 8.05x and 22.76x, respectively. The stock is also trading at $169.49, down 16.2% from its 52 weeks high of $202.26, though at a premium of 17.3% from its 52 weeks low of $144.46.
TXN 5Y Stock Price
S&P Capital IQ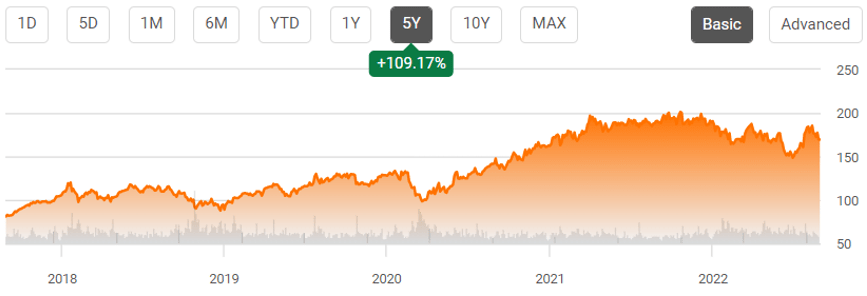
Nonetheless, consensus estimates are slightly more pessimistic about TXN’s prospects, given their price target of $179.28 and a minimal 5.78% upside from current prices. These are probably due to the recently perceived semi-stock destruction involving the PC segments, as reported by Intel (INTC), Nvidia (NVDA), and Advanced Micro Devices (AMD).
However, since TXN is a foundry with massive unmet demand globally, similarly to Taiwan Semiconductor Manufacturing Company Limited (NYSE:TSM), we are not concerned about the perceived growth deceleration since these are singular to the PC market. TSM’s revenue growth was recently upgraded by 2.4% to a CAGR of 16.92% through FY2025, with notable improvements in its projected profitability, from net income margins of 32.3% in FY2019, to 37.6% in FY2021, and finally to a projected 39.9% by FY2025.
Nonetheless, we are starting to see signs of weakness ahead, due to the Fed’s recent commentary on potentially aggressive interest hikes in order to “forcefully bring demand and supply into better balance.” Thereby, triggering retracement over the next few weeks before the Fed’s upcoming meeting in September. As a result, we prefer to advise patience and recommend adding this stellar stock once it nears the previous support level at $140s or even lower, depending on the situation.
Therefore, we rate TXN stock as a Hold for now.
Be the first to comment