

Key Talking Points:
- DAX 30 buyers attempt to hold the index above 15,200
- Momentum indicators show a mixed picture

Recommended by Daniela Sabin Hathorn
Get Your Free Equities Forecast
After a strong start to the week last Monday and a subsequent reversal on Tuesday, the DAX 30 wasn’t able to consolidate any momentum during the rest of last week. The German index has held still around the 15,225 area, which has allowed the ascending trendline support to catch up with current prices, putting the bullish trend under pressure.
The long-term forecast continues to show positive momentum but the current set-up is signaling that buyers are struggling to overcome selling pressure and we may see downside correction before buyers are in control again. This pause in movement over the last few sessions has allowed the overbought conditions on the Stochastic oscillator and RSI to subdue, but the MACD has now ventured into negative territory, which would support this notion of a bearish correction before further upside momentum is achieved.
Fundamentally, the current weakness is attributed to the concerns over tougher restrictions in Germany, rising inflation expectations and bond yields, and already high price levels, which is making new buyers a little afraid of heights. Investors may also be waiting for the US earnings season to begin later this week to gauge overall market sentiment.
Discover what kind of forex trader you are

DAX 30 Levels
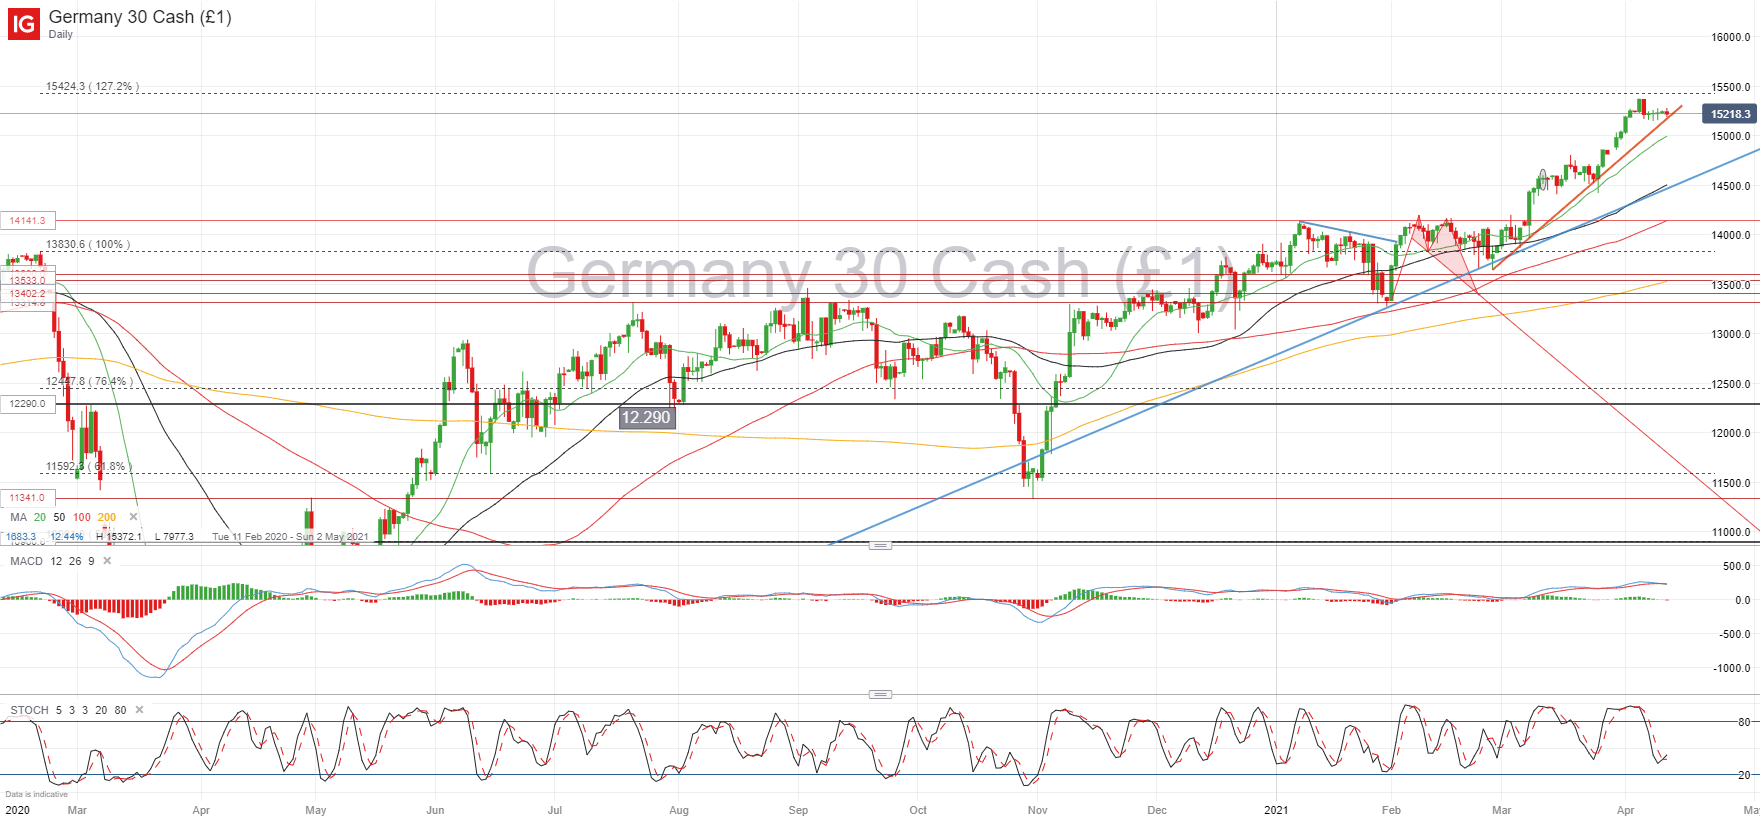
The rapid surge in the DAX 30 during the month of March has seen price pierce through significant psychological levels like the 14,500 and 15,000 marks without a second thought. This strong uptrend had marked an ascending trendline which is now being used as immediate support at 15,190, so we could see selling pressure accelerate if this area is invalidated.
The 15,000 mark, where the 20-day SMA is now converging could be a reasonable area where new buyers come into the market, although further retracement towards the longer-term trend (14,515) may take place.
On the upside, the 127.2% Fibonacci projection is the next area to beat for further bullish momentum. Last week’s all-time high at 15,372 and the psychological 15,500 area are likely to be the lower and upper boundaries of a resistance area given their proximity to the 127.2% Fibonacci projection.
DAX 30 Daily chart
| Change in | Longs | Shorts | OI |
| Daily | 39% | 9% | 16% |
| Weekly | 115% | -6% | 12% |
Learn more about the stock market basics here or download our free trading guides.
— Written by Daniela Sabin Hathorn, Market Analyst
Follow Daniela on Twitter @HathornSabin
Be the first to comment