

Alberto Gagliardi/iStock via Getty Images
Thesis and Background
Tesla (NASDAQ:TSLA) essentially took a stress test in the past two quarters. And to investors’ relief, it passed the test. Although we look more closely (which we will in the next section), there are still some lingering issues in its scorecard. But overall, its June-quarter results topped expectations despite the multitude of challenges it faced in the first half of the year, including limited production and shutdowns at its factory in Shanghai for most of the quarter, ongoing supply-chain disruptions, and rising labor and raw materials cost. Despite all these challenges, revenues for the June quarter went up 42% YoY and the total deliveries reached almost 255K (a 27% increase YoY). Looking forward, management is targeting record production in the second half of the year.
At the same time, TSLA has also demonstrated its pricing muscle amid soaring inflation. Later in the article, you will see that the average unit sale price went up by almost 10% compared to the previous quarter and by more than 16% compared to the 4th quarter of 2021. Yet, customers are still flocking to buy its cars as quickly as it can make them.
Such pricing and the resilience of its integrated production system form a powerful combination. Moreover, its production has clearly passed the pivot point of the critical scale. As the Gigafactories in Austin and Berlin continue to ramp up, I expect it to recoup its fixed cost at an even faster pace and benefit from the scale of production to a further degree as elaborated on next immediately.
TSLA’s stress test
The following chart illustrates the nature of the stress test that Tesla just took in the past two quarters. This chart shows the average CFO (cash from operations) per vehicle and also the average unit price per vehicle since 2015. To set the background, you can see very clearly that Tesla has passed the pivot point of critical scale around 2018. Since 2015, it was able to make an improving profit per vehicle while the unit price (i.e., the price tag on each vehicle) has actually been DECLINING. The average price tag for a TSLA vehicle was around $80.9K back in 2015 (when one of my friends joked that it was like driving a piece of jewelry with limited range). The average price declined to $57.5K in 2021, while the net profits soared during the same period, as you can see. And the net profit turned positive in 2018, a clear indicator of passing the breakeven point.
Then came the stress test in 2022. Due to all of the above-mentioned challenges, the business had to increase the unit price from an average of $57.5K per vehicle in 2021 to $66.5K in Q2 of 2022, a price increase of 15.6%. It is undoubtedly good news that the business has the pricing power to increase the price at such a substantial magnitude. However, the bad news is that the price increase itself is not sufficient to overcome the inflation cost, raw materials, et al. As a result, the net profit per vehicle actually decreased as seen. The average CFO per vehicle reached a peak of $12.2K in 2021 and declined to $9.23K in Q2 2022, a decline of more than 25%.
So overall, it turned in a good scorecard with some lingering issues, and we will examine these issues more next.
Author based on Seeking Alpha data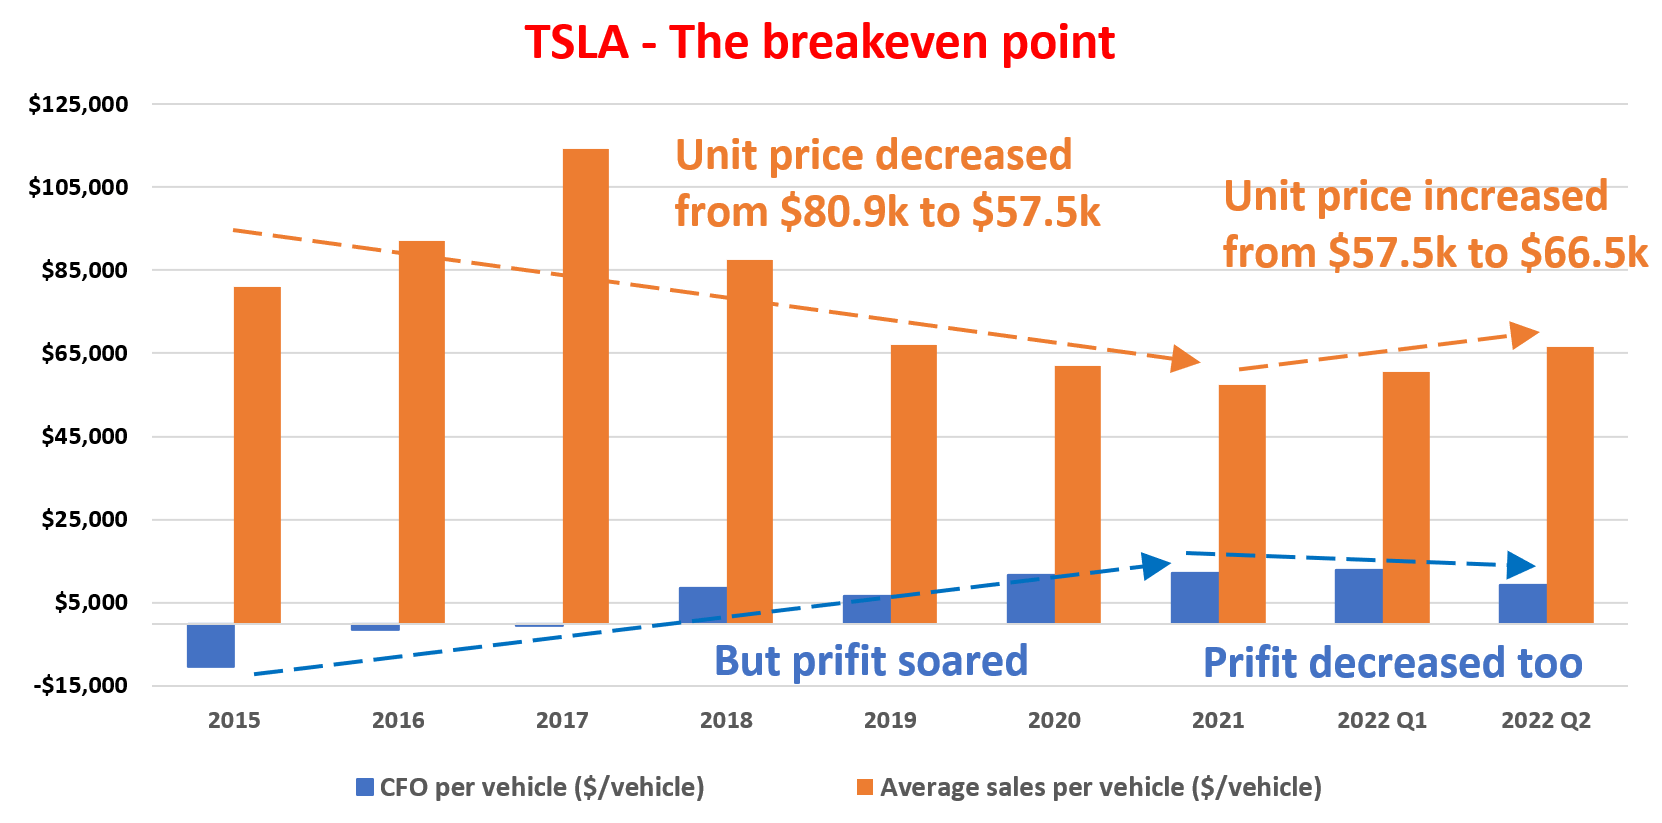
TSLA’s fixed cost and variable cost
For a production business like TSLA, the basic economics are well-understood and shown in the following chart taken from A Modern Approach to Graham and Dodd Investing by Thomas P. Au. As also explained in the book,
Profit is a function of volume, price, and cost, as shown in the next figure. Costs come in two varieties, fixed costs and the variable cost (shown as F and M * V in the figure, where M is the marginal cost of producing an additional unit and V is the production volume). Fix costs include things like plant and equipment (especially the depreciation thereon) and also most capital costs (such as interest expenses). Fixed costs were incurred upfront and do not vary with the level of output. A production business has to first pass the breakeven point to make a profit. After it breaks the critical volume of sales, the fixed costs are spread out on more and more units and profit margins will improve.
A Modern Approach to Graham and Dodd Investing by Thomas P. Au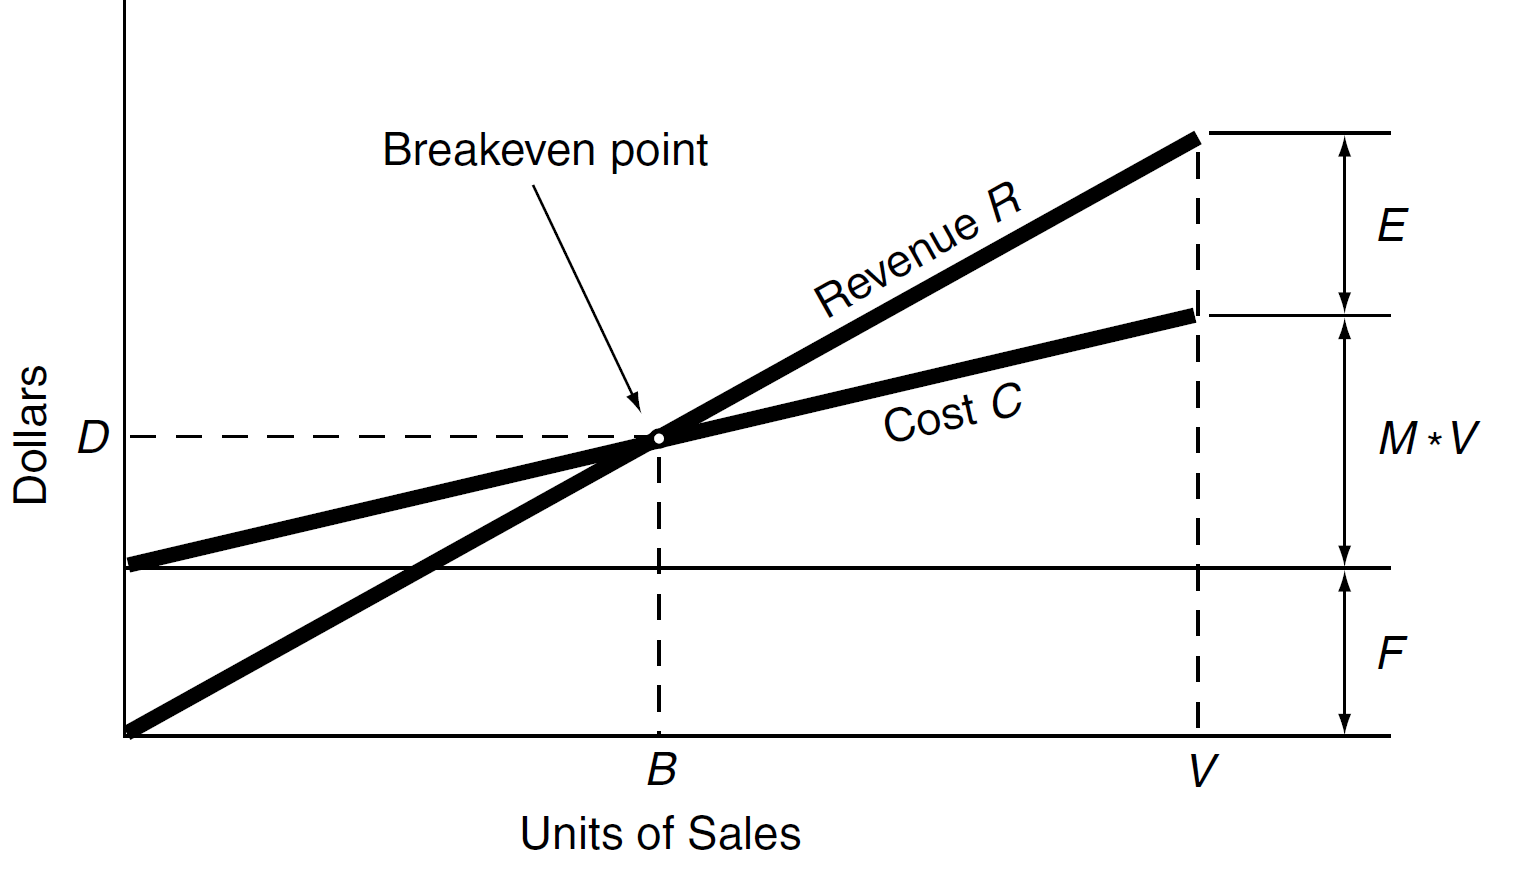
The next chart shows how these dynamics are playing out at TSLA. The chart shows my estimates of TSLA’s fixed cost and variable costs. The plot is made in double-logarithmic scales. The blue line shows its total revenue and the orange line shows my best fit to the model above based on its actual data.
You can see again that the break-even point occurred somewhere close to 100K vehicles (where the blue line and orange intersect). And in reality, its total vehicle deliveries exceeded 100K for the first time in 2017, corroborating the validity of the fit. By calculating the slope of the orange line, we can also determine the variable cost to be about $42,000 per vehicle for TSLA. By extrapolating the orange line to the left, you could see that the fixed cost is about $2 billion. Moreover, by extrapolating the orange line all the way to 1M vehicle delivery (which it aims to reach this year), we can project the fixed cost, the variable cost, and also the profit (i.e., the difference between the blue and orange lines).
Under a double-log scale, the difference is hard to see. So, in the next section, I will tabulate these numbers and project them into the next few years also.
Author
TSLA Stock’s profit and return projections
This next table repeats the same information that I obtained from the fitting (especially, the average fixed cost, variable cost, and net profit per vehicle) shown in the chart above. Except it is presented in a tabular form this time.
Based on these parameters, we can also make projections about the TSLA’s revenues and profits going forward. To summarize, the key parameters are: A) the variable cost per vehicle is $42,000; and B) a fixed cost of $2B. Finally, I also made the assumption that: A) the operating expenses are 13% of total sales, which is consistent with its current levels; B) it can maintain the current average vehicle price tag of $66,000; and C) its annual production would grow at 30% CAGR.
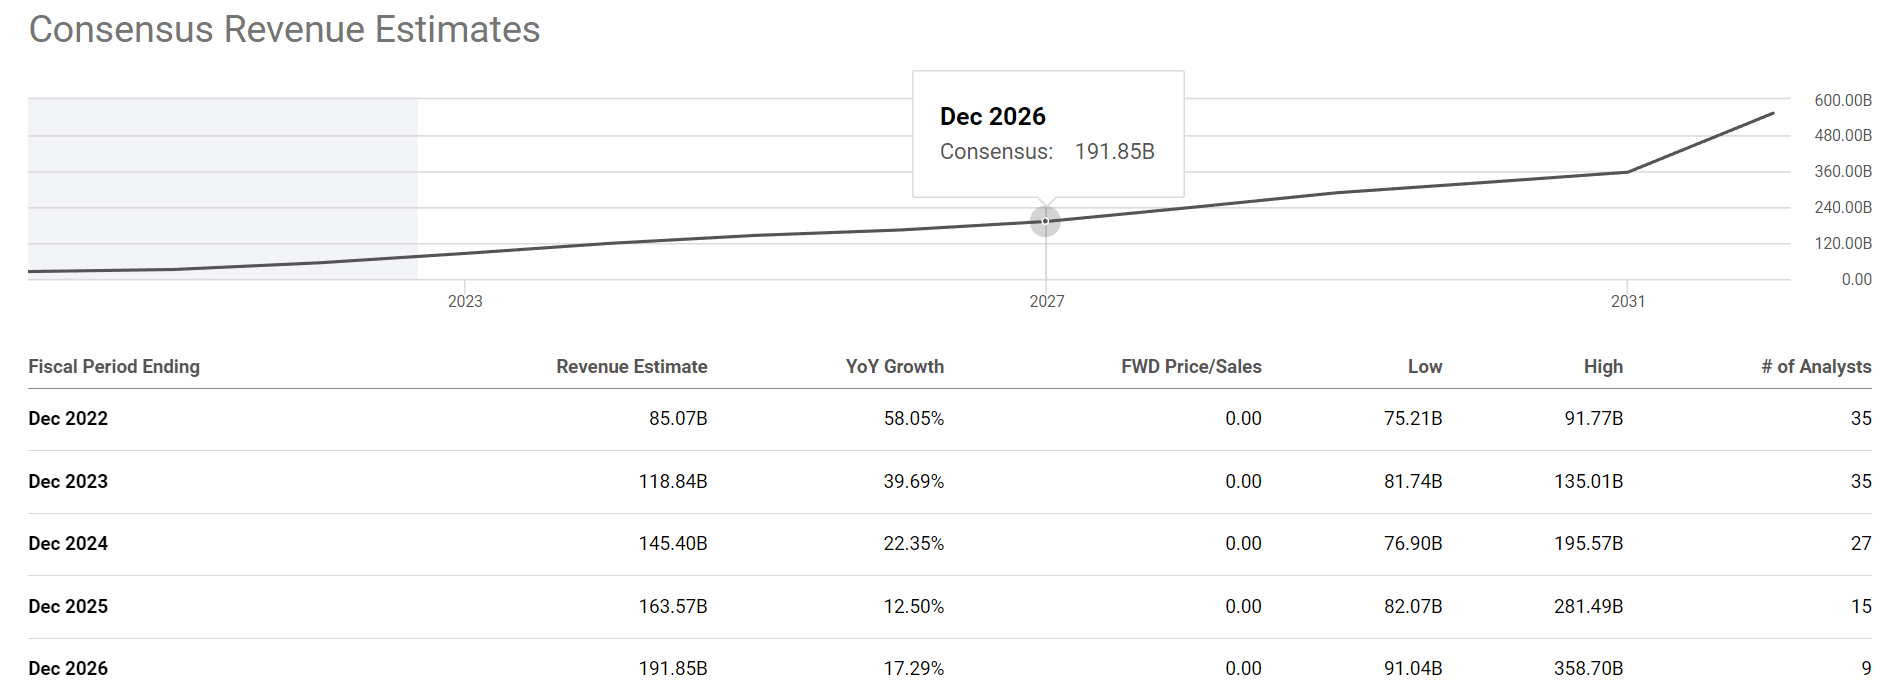
As can be seen, based on these projections. Its total revenues are projected to reach about $188B. The projection is quite close to the consensus estimate of $191B in 2026 as shown below. Assuming the consensus estimates are reached by other independent methods, such agreement serves as another good sign of the validity of the above model and fitting. And a fundamental understanding of its variable cost and fixed cost can provide us with powerful insights into its profit drivers and understand future returns.
For example, right now, there is no doubt that the business is expensively valued. However, with the above fixed cost and variable cost, the table shows that it can benefit from the scale of production to a further degree going forward. Total revenues are projected to reach $188B in 2026 and EBITDA earnings are projected to reach $45B by 2026. Under the current price, price to sales ratio would be about 5.1x in 2026, the EV/sales ratio about 5.2x, and the EV/EBITDA ratio about 21x. The P/S and EV/S ratios would not be that different from the overall market by then.
Author: TSLA’s profit and return projections Seeking Alpha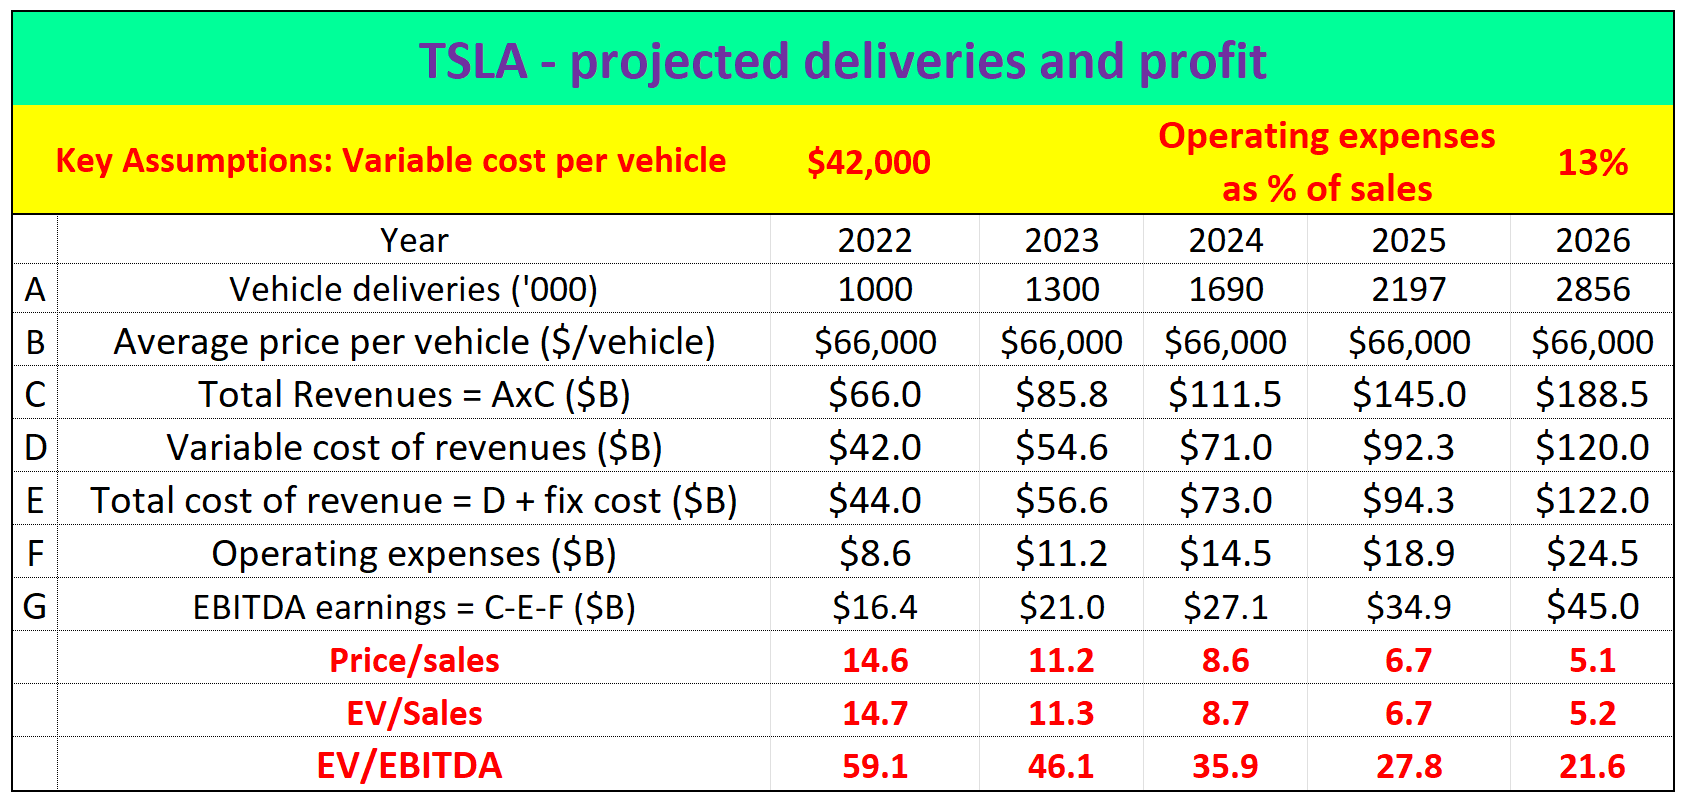
Final thoughts and risks
To recap, I see the past two quarters as a stress test on Tesla and I further see it passed the test. There should no longer be any doubt about its profitability, production resilience, and pricing power after this test. Going forward, a few catalysts could further boost its profitability in the near future. As the Shanghai Gigafactory resumes operation and factories in Austin and Berlin continue to ramp up, I expect it to recoup its fixed cost at an even faster pace and benefit from the scale of production to a further degree. Its recent advancements in full self-driving software add further optionality and upward potential for shareholders.
However, there are a few lingering issues on its scorecard. The price increase itself was not sufficient to overcome the rising costs. Profit per vehicle actually decreased by more than 25% despite an almost 16% increase in the average sales price tag per vehicle. Going forward, I see such cost control (raw materials, labor, and general inflation) challenges to persist. And finally, it is just in general difficult to predict things that grow at fast rates, which is an inherent risk with nonlinear stocks like TSLA. TSLA management repeatedly mentioned its goal and confidence of growing deliveries at 50% annual rates, while other sources’ estimates are all over the place. For example, Morning Star analysis assumes Tesla only delivers around 5.7 million vehicles by 2030, well below management’s target. While Cathie Wood believes (or believed) that Tesla can sell 20m vehicles a year by 2025. You can see such variance (and hence risks) by the huge difference in the low and high ends of the consensus estimates below. The variance is more than 2x by 2024, more than 3x by 2025, and almost 4x by 2026.
Seeking Alpha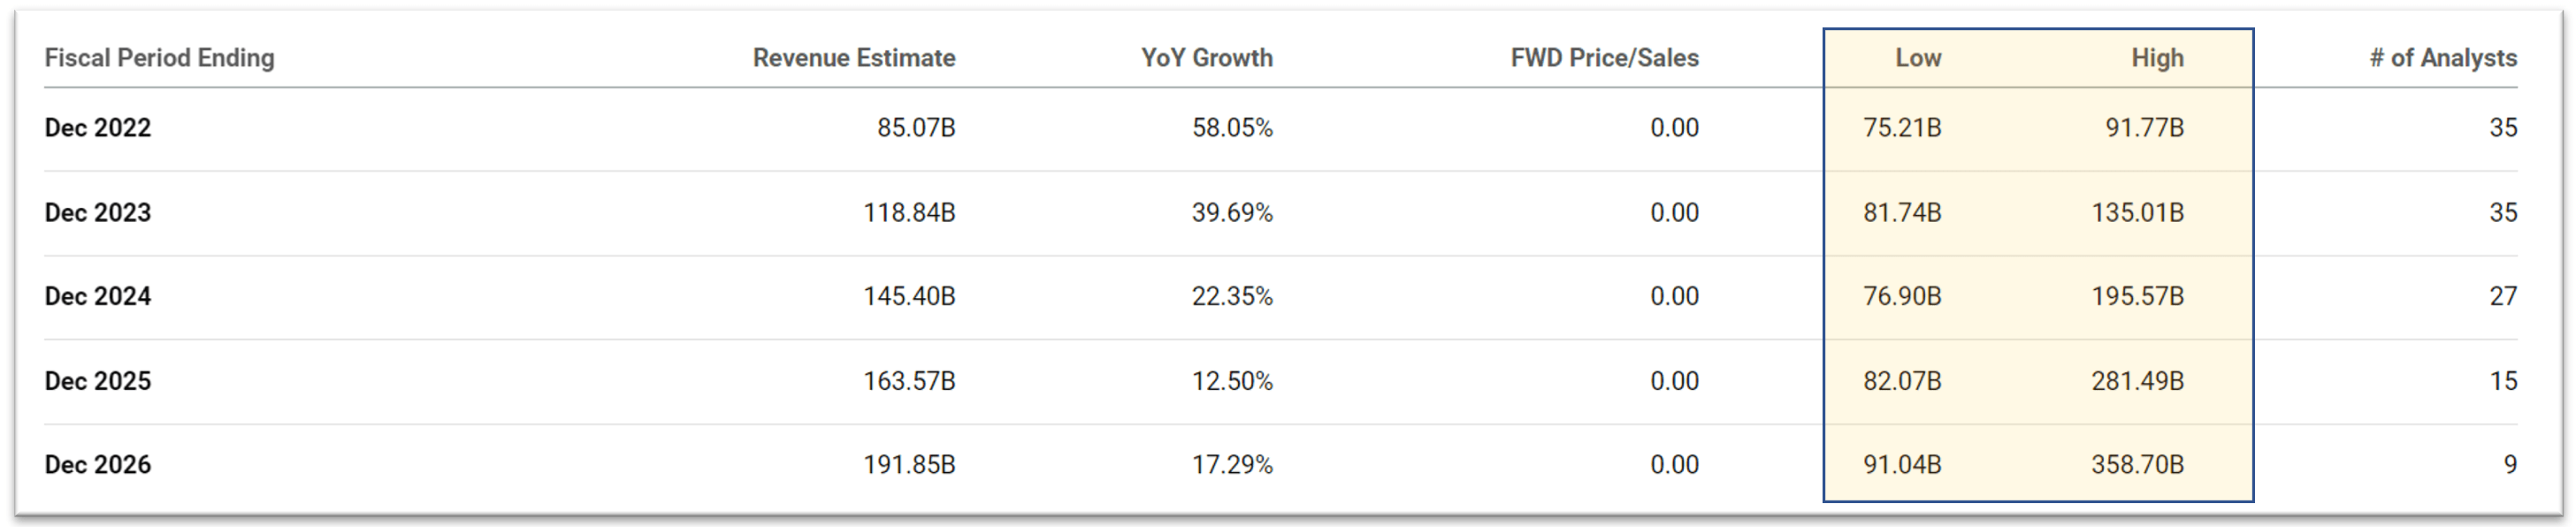
Be the first to comment