

metamorworks/iStock via Getty Images
As I showed in a previous article, Terreno Realty (NYSE:TRNO) is a bona fide FROG (Fast Rate of Growth REIT), with high double-digit revenue and cash flow, and a rock solid balance sheet. The company pursues a smart strategy of focusing on locations in six Tier 1 coastal markets (Seattle, San Francisco, Los Angeles, New York/New Jersey, Miami, and Washington DC), with:
- large and growing consumer populations,
- highly developed airport, seaport, and highway infrastructure for rapid distribution of goods, and
- significant physical and regulatory barriers to development of competing properties
Terreno Realty investor presentation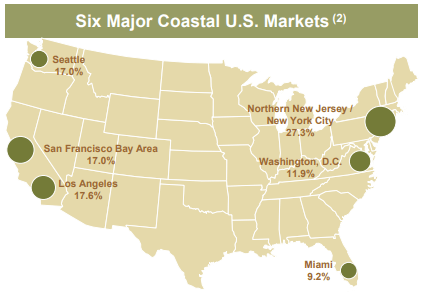
As of December 31, the portfolio included 253 buildings totaling about 15.1 million square feet, 36 improved land parcels consisting of about 139 acres, plus four properties under redevelopment. The tenant roster includes over 500 companies, with the top tenant (Amazon), accounting for just 4.9% of ABR (annual base rent). Leases range from 3 to 10 years.
Thanks to a nationwide shortage of warehouse space, and strong tailwinds from e-commerce, Industrial REITs are expected to outperform this year. Nevertheless, TRNO shares have sold off thus far this year, entering the year priced at $85.29, and currently selling for $70.75, a decline of 17.0%. Is the long-term bullish thesis on this FROG still intact?
Q4 and 2021 results
According to the company’s 10-K filed February 9, occupancy portfolio-wide at year’s end had fallen to 95.5%, down 230 basis points year-over-year (YoY). Four of the markets are experiencing 100% occupancy, but Seattle’s rate is only 78.1%, and occupancy in the LA market is a surprisingly low 90.5%, contrasted to the 99.1% enjoyed by Rexford Realty, a Southern-California-only REIT.
During 2021, Terreno acquired 34 industrial properties on 52.5 acres, totaling 1.9 msf (million square feet), for a total purchase price of approximately $657.3 million. That represents a 15% increase in the building count. The average stabilized cap rate on these acquisitions was a nondescript 4.0%. The company also has 4 properties under redevelopment, totaling 180,000 square feet, at estimated stabilized cap rates of 5.0%.
In November, the company issued 4.025 million shares at a price of $74.50 each, lower by $1 per share than the market price at that time. This was a 5.6% increase in the share count. The company can issue ATM (at-the-market) shares worth up to $300 million in 2022. Because TRNO shares trade at a 14.1% premium to NAV (net asset value), any such issuance would be accretive. The company is also authorized to buy back 3 million shares at will.
Terreno management calculates that two-thirds of its existing leases will expire in the next 5 years. This is advantageous, because of the double-digit leasing spreads that currently prevail in the industrial sector nationwide, but especially in the sizzling Tier 1 coastal markets where TRNO operates. The company reports a blended 28.4% spread in new and renewed leases YoY.
TCFO (total cash from operations) for Q4 came in at $34 million, resulting in a 2021 total of $132.2 million, a superb increase of 30.7% YoY. Q4 FFO (funds from operations) came in at $32.4 million, a sparkling increase of 31.5% YoY. Total FFO for the full year came in at $120.8 million, up 22.9% YoY. Q4 FFO per share was $0.44, up 22.2% YoY, while the full-year figure was $1.71, up 17.9%.
Adjusted EBITDA for Q4 2021 came in at $40.28 million, an increase of 24.1% YoY, and $149.1 million for the full year, an increase of 19.3%.
Q4 same store NOI came in at $35.7 million, a jump of 12.2% YoY, and the full year figure jumped 10.7%, as mentioned before. The table below summarizes this information.
| Metric | Q4 Growth YoY | Full Year 2021 Growth |
| TCFO | — | + 30.7% |
| FFO | + 31.5% | + 22.9% |
| FFO/share | + 22.2% | + 17.9% |
| Adjusted EBITDA | + 24.1% | + 19.3% |
| Same Store NOI | + 12.2% | + 10.7% |
Source: Terreno Realty 10-K
With sparkling numbers like this, all in double digits, it is safe to say that TRNO maintained its FROG-worthy pace on revenue and cash flow.
At the same time, it is noteworthy that capex (capital expenditures) was also sharply up. In Q4, Terreno incurred $17.7 million in cape, up 112% YoY. The full year total capex came in at $67.8 million, an increase of 75.7% over 2021. This reflects leasing acquired vacancy, redevelopment construction in progress, and renovation and expansion projects, the vast majority of which was expensed in Q4.
Balance sheet metrics
A quick look at the balance sheet shows it is still diamond hard, with extremely high Liquidity Ratio, and extremely low Debt Ratio and Debt/EBITDA. Terreno ended the year with $721 million in debt, all of it unsecured. Payments (on senior unsecured notes) of $50 million come due in 2022, $100 million in 2024, and $50 million in 2026, with no payments on any debt due in 2023 or 2025.
| Company | Liquidity Ratio | Debt Ratio | Debt/EBITDA | Bond Rating |
| TRNO | 3.38 | 10% | 3.9 | — |
Source: Hoya Capital Income Builder and TD Ameritrade
Coupled with its sizzling growth rates, the nationwide shortage of warehouse space driving internal growth, and this outstanding balance sheet, TRNO easily retains its designation as a FROG, likely to outperform in the long run.
More recent developments
There are a few mildly troubling developments, however, in addition to the surge in capex noted above.
Interest rates are listed by Terreno management as their primary risk. Rising rates affect the company’s debt service (some debt is held at variable rates), capex, and expansion and redevelopment costs. The weighted average interest rate on their variable rate debt was 1.2% as of December 31, 2021. A rate increase of just 0.25% would cut into future earnings and cash flows by approximately $0.3 million annually.
In early January Baird analyst David Rodgers downgraded Terreno to Neutral from Outperform, citing higher interest rates and lackluster cap rates on acquisitions.
The company has publicly reported just $86 million in acquisitions thus far in 2021, at a weighted average cap rate of 3.7%.
Dividend metrics
Industrial REITs are notoriously low-yielding. TRNO’s shares currently yield just 1.92%. However, this company is a champion when it comes to dividend growth. Shares purchased 3 years ago are yielding 3.31%, which is above the current REIT average of 2.93%. Shares purchased today would yield 2.53% three years from now, if the dividend growth rate remains the same.
| Company | Div. Yield | Div. Growth | Div. Score | Payout Ratio | Div. Safety |
| TRNO | 1.92% | 14.75% | 2.53% | 70% | B * |
Source: Hoya Capital Income Builder, Seeking Alpha Premium, and author’s calculations
* Estimated, based on grades for component factors supplied by Seeking Alpha Quant Ratings.
Valuation metrics
| Company | Div. Yield | Div. Growth | Div. Score | Price/FFO | Premium to NAV |
| TRNO | 1.92% | 14.75% | 2.53% | 40.0 | 16.8% |
Source: Hoya Capital Income Builder, Seeking Alpha Premium, and author’s calculations
Trading at a premium to NAV of 16.8%, the company can issue shares accretively through its ATM facility. I expect they will do just that, to the maximum of $300 million.
Shares of TRNO look pricey at 40.0, which is high even for an Industrial REIT. However, looks can be deceiving. Consider the table below.
| Ticker | Metric | 2018 | 2019 | 2020 | 2021 | 2022 |
| TRNO | FFO/Share, previous year | 1.09 | 1.30 | 1.38 | 1.44 | 1.72 |
| Opening Price Jan. 1 | $35.06 | $34.82 | $54.41 | $58.45 | $85.51 | |
| Price/FFO | 32.2 | 26.8 | 39.4 | 40.6 | — | |
| Price Gain % | (-0.7) | 56.3 | 7.4 | 46.3 | — | |
| Dividend Yield % | 2.6 | 2.7 | 2.1 | 2.2 | — | |
| Total Return % | 1.9 | 59.0 | 9.5 | 48.5 | — | |
| VNQ | Opening Price Jan. 1 | $83.04 | $73.56 | $93.19 | $85.20 | $116.21 |
| Price Gain % | (-10.13) | 24.43 | (-8.47) | 36.59 | — | |
| Dividend Yield % | 4.25 | 3.65 | 3.59 | 3.17 | — | |
| Total Return % | (-5.88) | 28.08 | (-4.88) | 39.76 | — |
Source: Hoya Capital Income Builder, MarketWatch, Seeking Alpha Premium, and author’s calculations
Focusing on the yellow lines, we see that TRNO has entered each of the last 4 years looking very pricey, with the average Price/FFO coming in at a frothy 34.8. So it was overpriced, right?
Well, by definition, if it was overpriced, it should have underperformed the market. Instead, it has scorched the market each of the past 4 years, by an average of 1271 basis points! (No, that is not a misprint, nor a miscalculation.) Talk about generating alpha! TRNO has been seriously underpriced, even at its high Price/FFO ratios, for at least 4 consecutive years now. High Price/FFO ratios are no reason to shy away from a FROG! Thanks to the recent sell-off, TRNO shares are priced about the same as they were at the start of 2020 and 2021.
Investor’s bottom line
If your investment horizon is less than 3 years, and you are mostly or only interested in Yield, this is not the company for you, and I’m surprised you have read this far (unless you are the type of person who eats dessert first.) But if your horizon is 3 – 5 years or more, and you are more interested in total return than in Yield, it’s a different story.
Terreno Realty is a supremely well-managed company and a bona fide FROG of at least 3 years’ standing. Its internal growth prospects are superb, but it is running into some cost headwinds. This looks like a good time to hit pause. If you were to Buy, I don’t think you would be embarrassed at all by the returns you will get over the next 3 – 5 years. Nevertheless, I rate this company a Hold, mainly because I think there are better plays among Industrials right now.
The Seeking Alpha Quant Ratings have a Hold on TRNO as usual, horrified by its Valuation, but the Wall Street analysts’ ratings average out to a Buy. Zacks rates it a Hold, as does Ford Equity Research, but The Street and TipRanks both rate it a Buy. Raymond James rates it a Strong Buy, with a $76 price target, while Stifel calls it a Buy with a target of $80.50. Absolutely nobody recommends selling it.
Be the first to comment