

JHVEPhoto
Investment thesis
Tempur Sealy International, Inc.’s (NYSE:TPX) performance is strongly linked to the Housing Starts. The Housing Starts is cyclical. As such, I think TPX is a cyclical company. Any analysis and valuation of TPX should be based on its performance over the cycle in my opinion.
On such a basis, TPX is fundamentally sound. However, there is no margin of safety at its current market price.
The thrust of my analysis
In my previous articles, I had alluded that TPX grew due to a combination of acquisitions, growth in the Housing Starts, and anti-dumping action. Refer to:
I will show that TPX performance is tied to the US Housing Starts. We know that Housing Starts are cyclical. As such TPX is a cyclical company and should be analyzed and valued on this basis.
Housing Starts have started on its downtrend and there are questions about the benefits of the anti-dumping action.
I am a long-term value investor with a holding period of 8 to 10 years. As such, there were 2 questions that I wanted answers for:
- Where TPX would be in 10 years business-wise?
- Is any margin of safety at the current price based on a cyclical perspective?
Fundamentally sound
TPX has two business segments – North America and International – with the former contributing about 85% of the group revenue. Over the past 20 years, TPX had grown its group revenue at a CAGR of 15%. You would think that this was a growth company.
Growth from the North America segment is about double that from the International segment.
I would rate TPX as fundamentally sound based on the following reasons.
Over the past 10 years, it had achieved an average annual Return on Capital of 17%. I used this metric rather than the ROE as its equity had been reduced significantly due to its share buyback program.
Secondly, over the past 20 years, it had been able to generate positive Cash Flow from Operations every year. During this period, it generated an average annual Cash Flow from Operation of USD 226 million per year compared to its average annual PAT of USD 166 million.
Thirdly, while it has not paid any Dividends over the past 20 years, it had spent most of its Cash Flow from Operations to buy back shares. This has indirectly boosted its share price.
At the same time, it meant that TPX had funded its acquisitions and CAPEX with Debt. But if you look at all the Debt issued and repaid over the past 20 years, it has only a net Debt of USD 55 million. Therefore, although it had a Total Debt of USD 3.3 billion currently, I would not worry given its ability to generate strong Cash Flow from Operations.
Drivers of growth
When I plotted the TPX North America segment revenue against the US Housing Starts for the past 20 years, you can see the link between them. Refer to Chart 1.
Chart 1: TPX North America segment revenue vs Housing Starts (Author)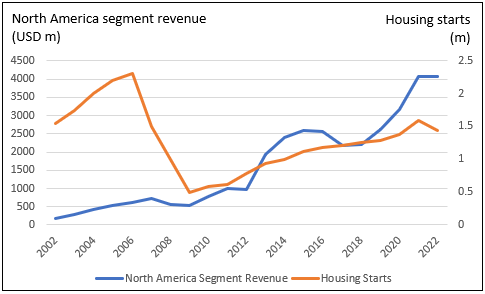
Note to Chart 1: TXP 2022 revenue was based on Sep 2022 LTM revenue
I would break down the past 20 years into 3 periods to correspond with the Housing Starts uptrend and downtrend patterns. Table 1 summarizes the correlation between TPX North America segment revenue and the Housing Starts for these periods.
I would conclude that since Housing Starts is cyclical, then TPX is a cyclical company.
Table 1: Correlation between TPX North America segment revenue and Housing Starts (Author)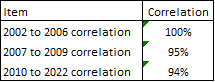
But the tailwinds from the Housing Starts do not provide the full picture of the growth. From 2010 to 2022, TPX North America segment revenue grew 14.9% CAGR. This was about double the CAGR of that for the Housing Starts.
The higher growth rate was due to the jumps in revenue resulting from the acquisitions of Sealy in 2013, and Sherwood Bedding and Innovative Mattress Solutions in 2020. If I wash out the acquisitions growth, I get a different picture. For example:
- Post the Sealy acquisition, from the end of 2013 to 2019, TPX only achieved revenue growth at 0.8% CAGR.
- Similarly, from 2021 to 2022 (based on Sept LTM) when there were no major acquisitions, TPX revenue grew at 3.3%.
Without these acquisitions, TPX is not a growth company. You should not be surprised as in my previous article I have shown that the US bedding sector only grew at 4.1% CAGR from 2013 to 2019.
Anti-dumping
In 2020, the US imposed anti-dumping duties on several countries that were exporting mattresses to the US. These included China, Turkey, and a few ASEAN countries. Collectively these countries in 2019 exported about USD 570 million in mattresses in 2019.
You would have thought that the curtailment of these imports will provide replacement opportunities for the US mattress companies. However, this is not the case.
“Total mattress imports for 2021 were USD 1.33 billion… down from nearly USD 1.5 billion in 2020, yet up from USD 1.17 billion and $1.21 billion in 2019 and 2018, respectively.” Source: Home News Now
As such I am more inclined to think that the anti-dumping measure will not provide significant long-term tailwinds to TPX. Rather the tailwinds would come from the Housing Starts and any further acquisitions.
Housing starts
The home building industry is cyclical where there is no growth in the long-term average annual Housing Starts of about 1.5 million to 1.6 million units. Refer to Chart 2.
Chart 2: US Housing Starts (Trading Economics)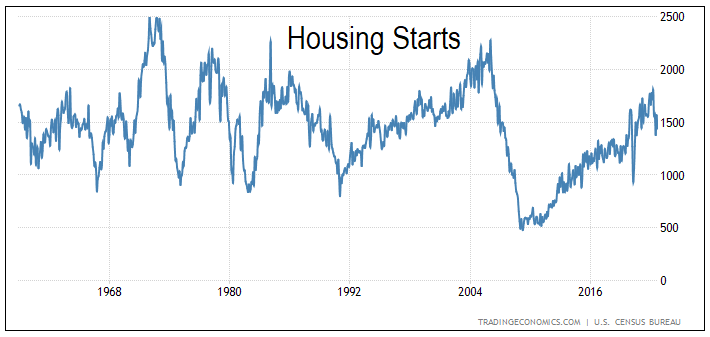
But the Housing Starts were based on physical units. While there is no long-term growth in volume, there was still growth in prices. The House Price Index had increased at a 4.6% CAGR from 1992 till Aug 2022. But this growth rate is not much different from the US long-term GDP growth rate.
Valuation of cyclical companies
According to Professor Damodaran, the value of a cyclical company is more dependent on a macro variable rather than firm-specific characteristics. In valuing a cyclical company, we have to “normalize” the performance over the cycle. Damodaran has one suggestion to do this:
“In effect, we can average profit margins over time, instead of net profits, and apply the average profit margin to revenues in the most recent period to estimate normalized earnings.”
Then the challenge for TPX is determining what represents the cycle. This is because the current TPX operations are after the 2020 acquisitions. There is not enough historical data to determine the full cycle performance. I thus assumed the following:
- The 2021 revenue represents the long-term average cycle revenue. This was because I equate the 2021 Housing Starts of 1.6 million units as equivalent to the long-term annual average Housing Starts.
- The average values for the 2014 (post-Sealy) to 2022 period represent the full cycle average values.
Valuation of TPX
To estimate the Intrinsic Value of TPX, I used a single-stage Free Cash Flow to the Firm (FCFF) model of:
Value of the Firm = FCFF X (1+g) / (WACC – g).
FCFF = EBIT X (1 – tax) X (1 – Reinvestment rate).
EBIT = Revenue X (Gross Profit margin – SGA margin).
g = growth = Reinvestment rate X Return. I assumed this to be based on the long-term GDP growth rate of 4%.
Given g, we can estimate the Reinvestment rate = g / Return.
Return = EBIT X (1 – tax) / Total Capital Employed or TCE.
I estimated the TCE by determining the TCE/Revenue ratio X Projected Revenue.
WACC = weighted average cost of capital obtained from the first page of a Google search of the term “TPX WACC”. Refer to Table 2.
Value of Equity = Value of Firm + Non-Operating Assets – Minority Interests – Debt.
Table 2: Estimating the WACC (Author from various sources)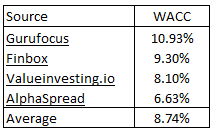
The key variables here are the Gross Profit margin, SGA margin, TCE/revenue, and Tax. These were derived based on the respective 2014 to 2022 averages as per Table 3. Note that for the average Tax rate, I ignored the one-off unusual tax in 2015 of USD 60.1 million.
Based on my model, I estimated that Intrinsic Value of TPX to be USD 18 per share compared to its market price as of 30 Dec 2022 of USD 34 per share. There is no margin of safety at the current market price in my view, therefore.
Table 3: Estimating the Intrinsic Value (Author)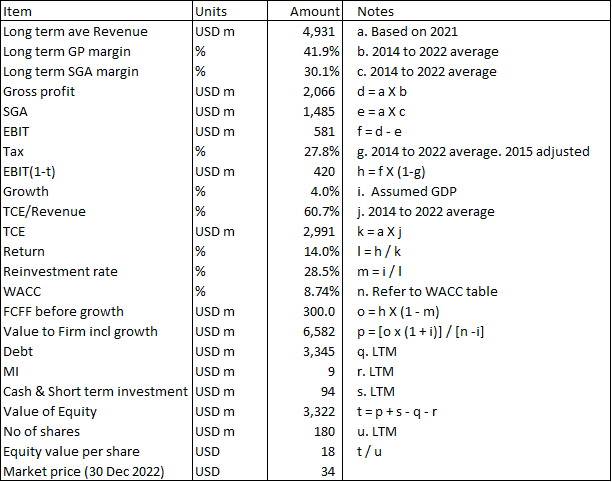
Risks and limitations
In looking at the estimated Intrinsic Value, you have to bear the following in mind:
- Using the North American performance to represent the whole company.
- Using 2014 to 2022 to represent the cycle.
- Using the current WACC to represent the discount rate over the cycle.
I have shown that the North America segment revenue is strongly correlated to the US Housing Starts. But it is not so for the International segment revenue. Nevertheless, in my model, I have assumed it to be so. In mitigation, the North America segment accounted for about 85% of the group revenue and historically had double the growth rate.
It is better to carry out a sum-of-parts valuation with the International segment driven by different factors. But given that the USD 18 per share equity value is significantly below the USD 34 per share market price, there would still be no margin of safety with a sum-of-parts valuation.
Looking at Chart 2, a more appropriate representative period of the cycle would be 2010 to 2022. However, in 2013, TPX acquired Sealy, and including 2010 to 2013, values would not be an accurate representation of the operations. So my assumed 2014 to 2022 values have not accounted for parts of the low points in the cycle. In other words, the estimated Intrinsic Value is a bit on the high side.
In my model, the WACC was assumed to be 8.74%. In deriving these, many of the sources used the current risk-free rate. I am looking at the 2014 to 2022 period to determine the cyclical values for the various valuation parameters. For consistency, I should also l use the WACC over the same period.
Furthermore, the average risk-free rate over the 2014 to 2022 period would be lower than the current rate. At the same time, instead of using the current risk premium, we should also use the risk premium over the cycle. My point is that the WACC used is probably on the high side. If I factor this in, my current estimate of the Intrinsic Value is on the low side.
The current gap between the Intrinsic Value (USD 18 per share) and market price (USD 34 per share) is very large. As such I am not sure whether accounting for the above would change the conclusion that there is no margin of safety.
Conclusion
There is no dispute that TPX is a fundamentally sound company. The issue is whether it is a good investment at the current price. As a long-term value investor, this will depend on the margin of safety.
My analysis showed that there is no margin of safety at the current price. My thesis is based on the view that TPX is a cyclical company. In a cyclical company, the revenue and the corresponding margins and ratios would vary with where it is in the cycle. The appropriate values to use are the average over the cycle.
I made certain assumptions to derive the average values over the cycle and my conclusion reflects them.
On the other hand, if you do not believe that TPX performance is cyclical, you would value it based on the current performance. Just for comparison, I carried out such an analysis using the 2020 to 2022 values to represent the current values.
Based on these, the estimated Equity value is USD 40 per share using the same model but with values as shown in Table 4. On such a basis there is a margin of safety. This is a completely different conclusion as that viewing TPX as cyclical.
Table 4: Cyclical vs Non-cyclical assumptions and valuation (Author)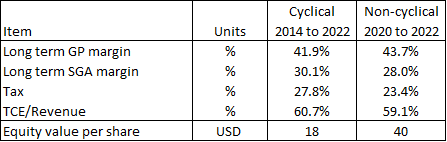
You can see that the Intrinsic Value is dependent on what you assumed. I hoped that I have made a case that we should view TPX as cyclical and that the current market price does not reflect TPX’s Intrinsic Value over the cycle. I would say that the market is viewing TPX as a non-cyclical company.
Be the first to comment