

bloodua/iStock via Getty Images
Recently, I wrote a positive article on Nordic American Tankers Limited (NAT). One of my readers commented that Teekay Tankers Ltd. (NYSE:TNK) has the same positive attribute as NAT, namely, a fleet geared towards the spot market. In this article, I will be looking at TNK in more detail.
From my analysis below, TNK stands to benefit from the positive tanker rate dynamics that are currently playing out. I think investors can consider TNK as a speculative play as a rising tide lifts all boats, but my personal preference is on NAT due to its lower voyage expenses and thus higher operating profit at the same tanker rate.
Teekay Tankers Fleet
Teekay was founded in 1973 by Torben Karlshoej, whose initials adorn the company’s name. TNK currently has a fleet of 46 product and oil tankers, including 25 Suezmax, 11 Aframax and 1 VLCC oil tanker and 9 LR2 product tankers (Figure 1). VLCCs can carry 2 million barrels of oil, Suezmax 1 million, and Aframax 600k. According to TNK’s Q1/2022 release, 94% of the fleet is trading in the spot market.
Figure 1 – TNK fleet (Author created with information from Teekay Tankers website)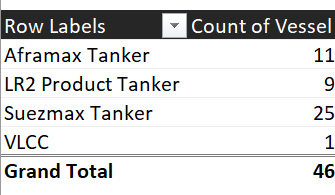
Tanker Rates Continue To Ratchet Up
Market Insights from Teekay Tankers continue to show tanker rates ratcheting up, with the latest weekly update showing spot Suezmax rates near $50,000 and Aframax rates near $55,000. LR2 rates are more subdued, trading at $40,000 recently. Figure 2, 3, and 4 show the trend in current tanker rates.
Figure 2 – Spot Suezmax rates (TNK market insights) Figure 3 – Spot Aframax rates (TNK market insights)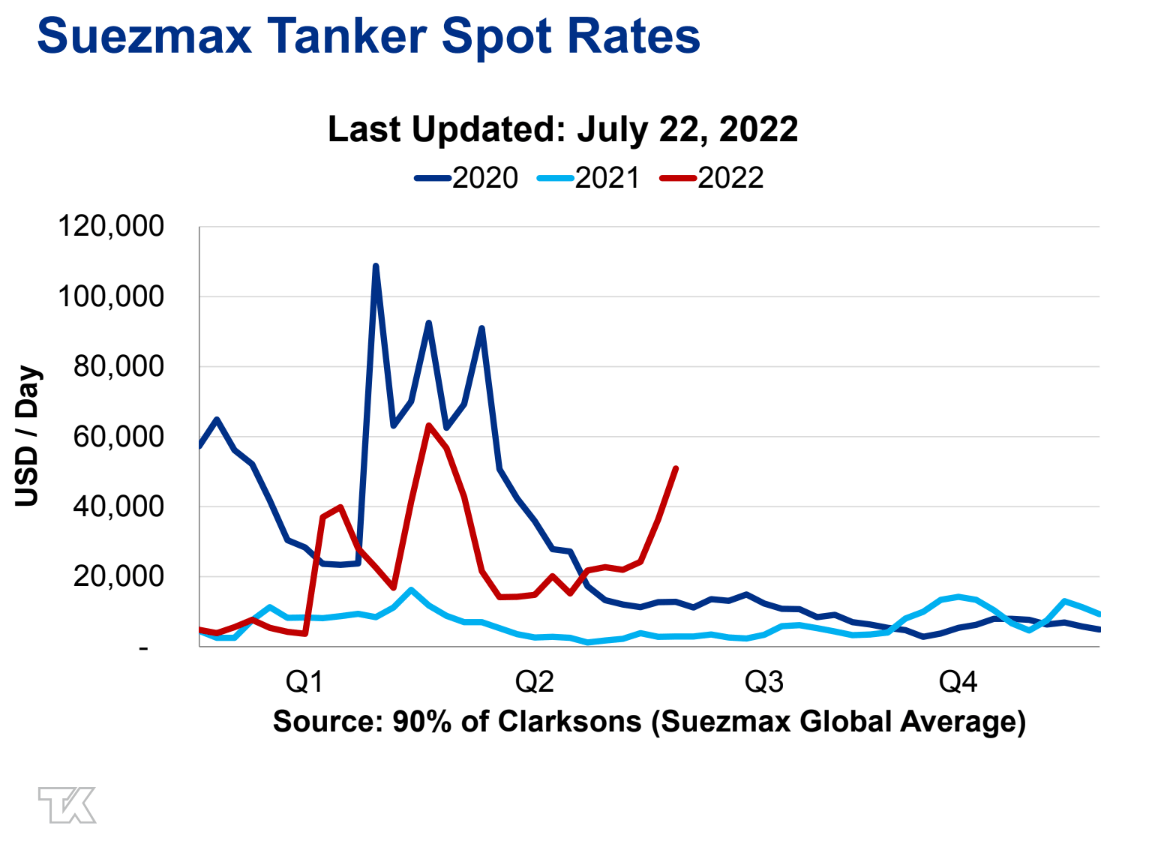
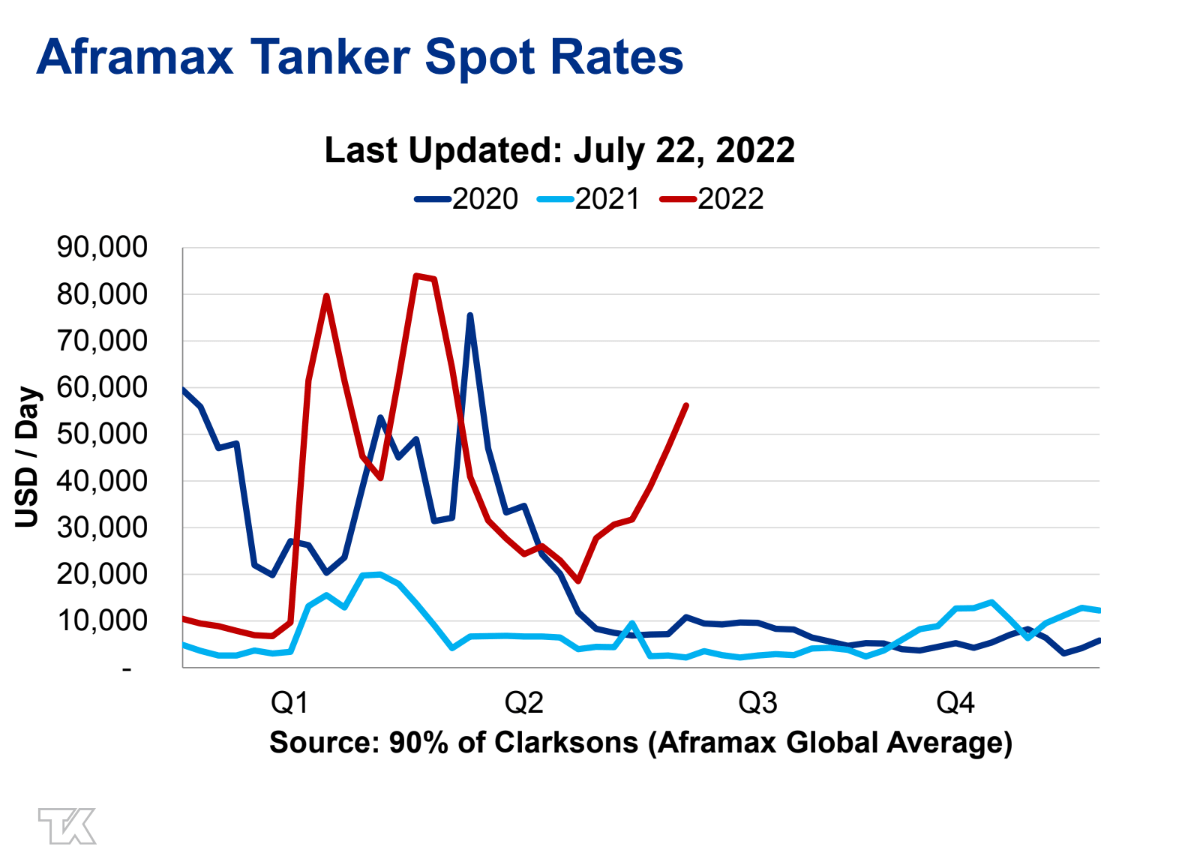
Figure 4 – Spot LR2 rates (TNK market insights)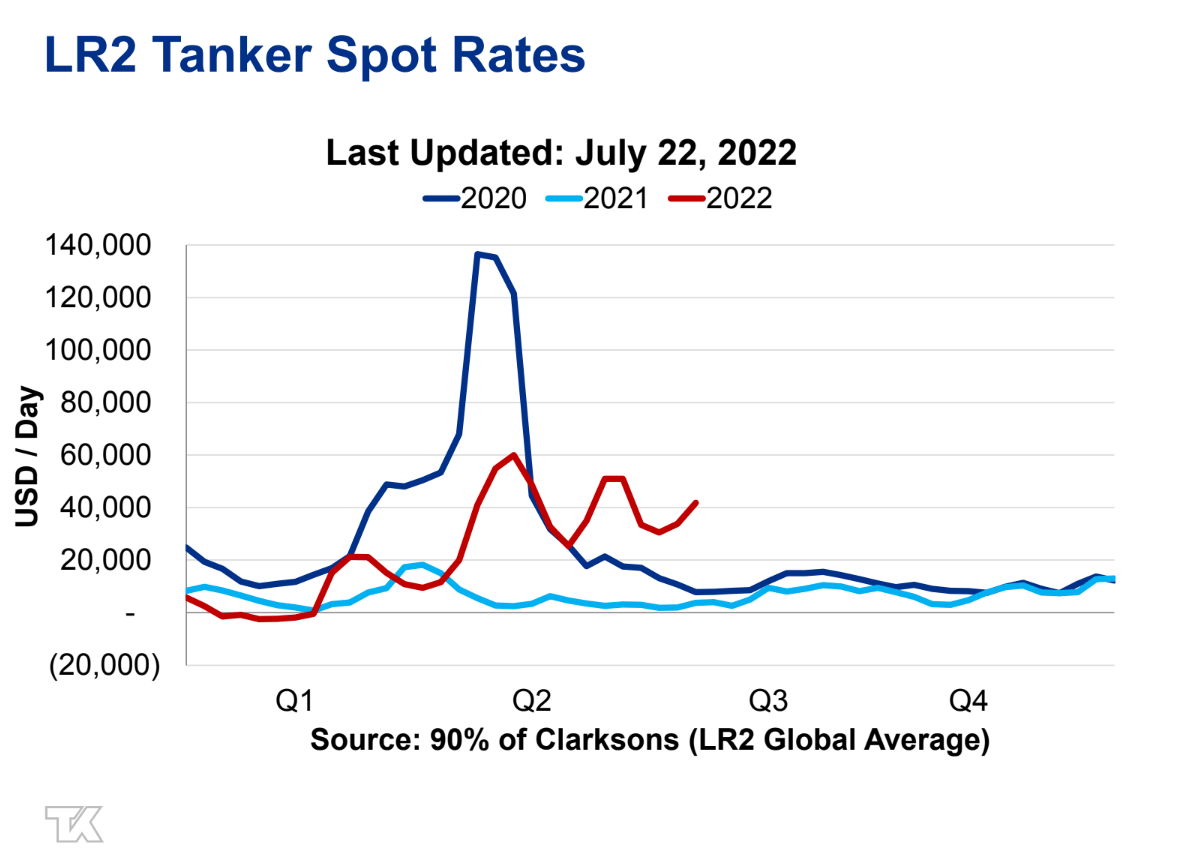
Bullish Thesis Recapped
To recap my bullish tanker rate thesis, below is an excerpt of what I wrote in my NAT article:
Recall Russia is the third largest oil exporter and exports over 7 million bbl/d of crude oil and products annually. Historically, Russian products were sent to nearby ports such as the Port of Rotterdam in the Netherlands, which processes 95 to 100 million metric tons of crude oil annually. However, as Russian oil was sanctioned, they had to be re-routed to faraway destinations such as India and China that ignored western sanctions and continued or increased their import of cheap Russian crude. In addition, refineries in Europe had to replace nearby Russian crude with oil from other countries such as the Middle East and Venezuela.
This essentially becomes a capacity utilization problem. Imagine the distance between St. Petersburg, one of Russia’s main oil exporting ports, and Rotterdam. The distance is 1,200 nautical miles or a 5 day voyage. On the other hand, the voyage from between St. Petersburg and Mundra, India (an Indian oil import hub) is 8,600 nautical miles or a 36 day voyage. Similarly, a voyage from Venezuela to Rotterdam is close to 6,000 nm and 25 days. So an original 10 day round-trip voyage between St. Petersburg and Rotterdam is now replaced with a 50 day round-trip between Venezuela and Rotterdam, and a 72 day round-trip between St. Petersburg and India. As tankers become committed to these much longer voyages, it is no surprise that the tanker rate market is rapidly tightening.
Teekay Tankers has an excellent slide in their Q1/2022 investor presentation that shows this dynamic, as reproduced in Figure 5 below. As we can see, Russian crude is increasingly shipped to the Far East (40%+), and U.S. Gulf crude exports to Europe are the highest since March 2020. It is predominantly carried by Aframax and Suezmax tankers, as these regions cannot be served by VLCCs (ports cannot handle the 300k+ dwt VLCCs).
Figure 5 – Bullish tanker thesis (TNK Q1/2022 investor presentation)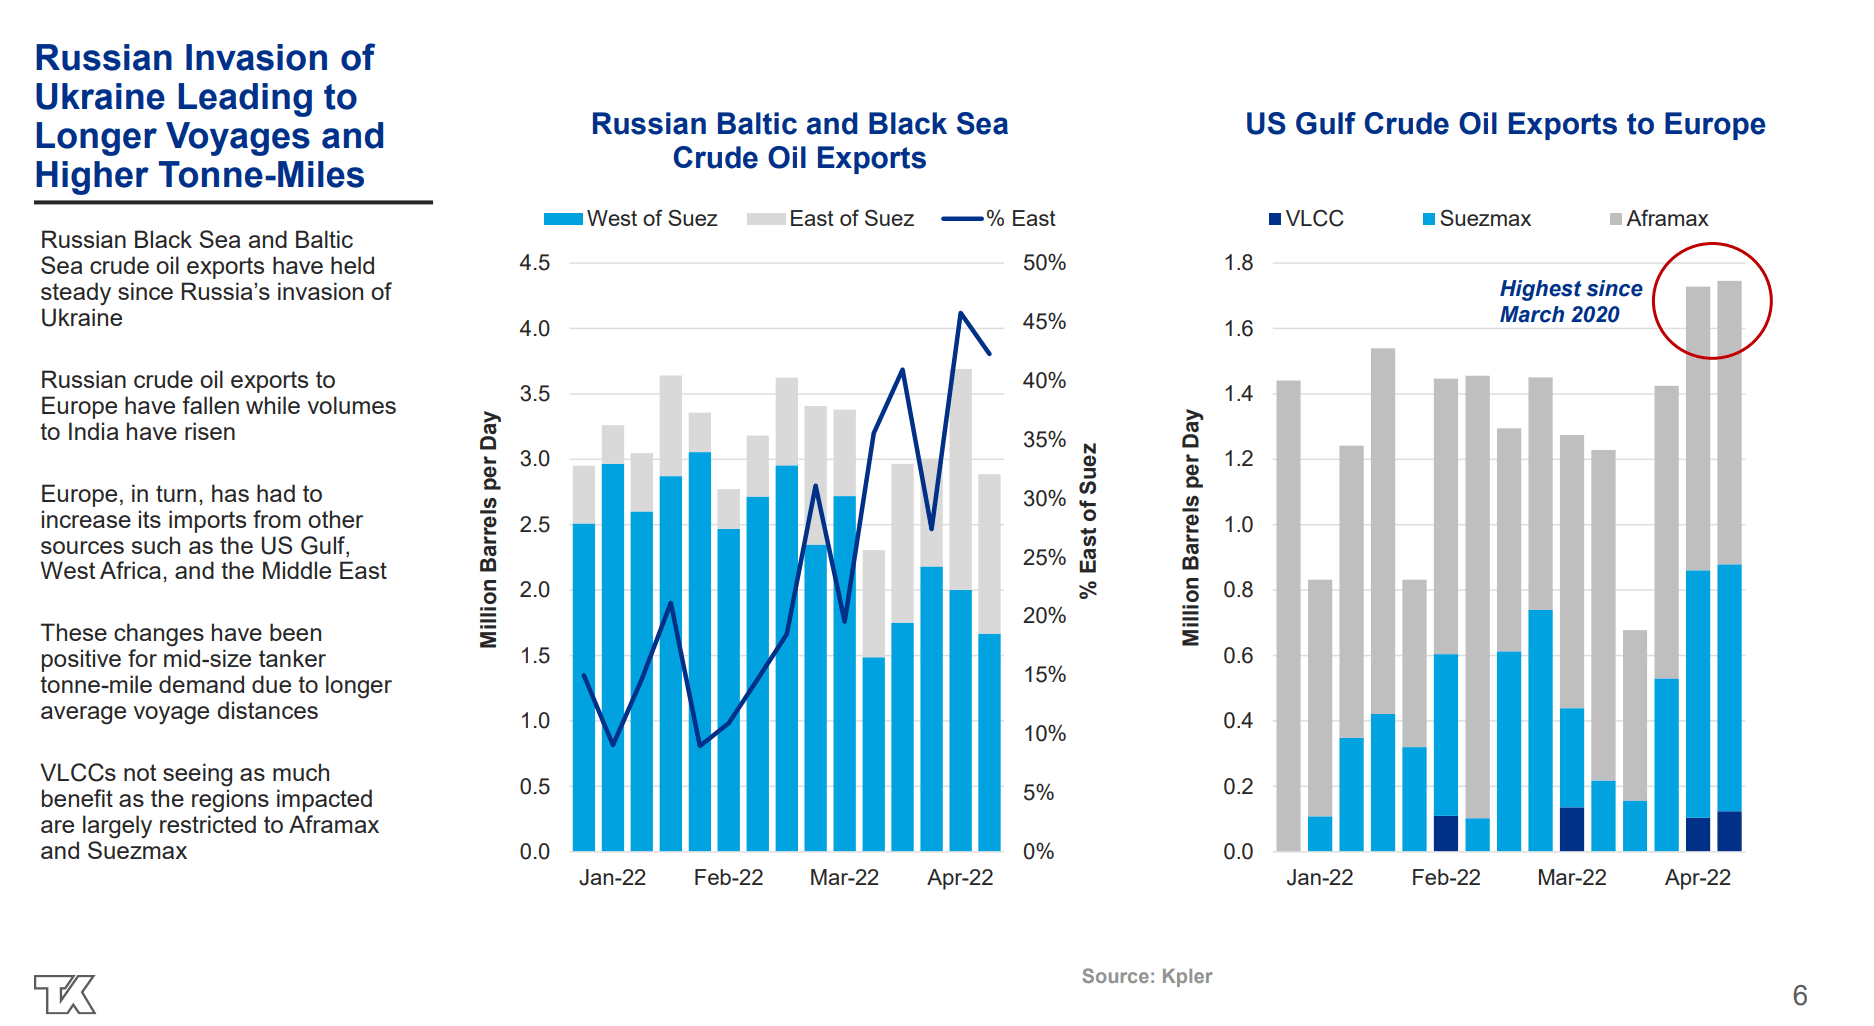
Tight Tanker Market Expected To Last Years
Tight tanker market conditions are expected to be longer-lasting for several reasons. First, in the most recent tanker rate spike in 2020, crude oil tankers were used as floating storage, as the COVID-19 pandemic temporarily destroyed oil demand while Saudi Arabia and Russia engaged in a price war. Today, we have a healthy crude market driven by strong consumption demand, and crude producers like OPEC simply cannot pump oil fast enough.
Secondly, due to the serious nature of Russia’s invasion of Ukraine, Western sanctions against Russian oil is unlikely to be lifted in the short to medium term, so these longer voyages are likely to become the norm and persist for years.
Finally, past tanker rate cycles always ended with shipowners placing too many newbuild orders and flooding the market with new capacity. This time around, tanker orderbooks are the lowest in years, and there is no shipyard capacity to build new tankers, with the earliest build dates stretching to 2025 (Figure 6).
Figure 6 – Low fleet supply set to drive tanker rates (TNK Q1/2022 investor presentation)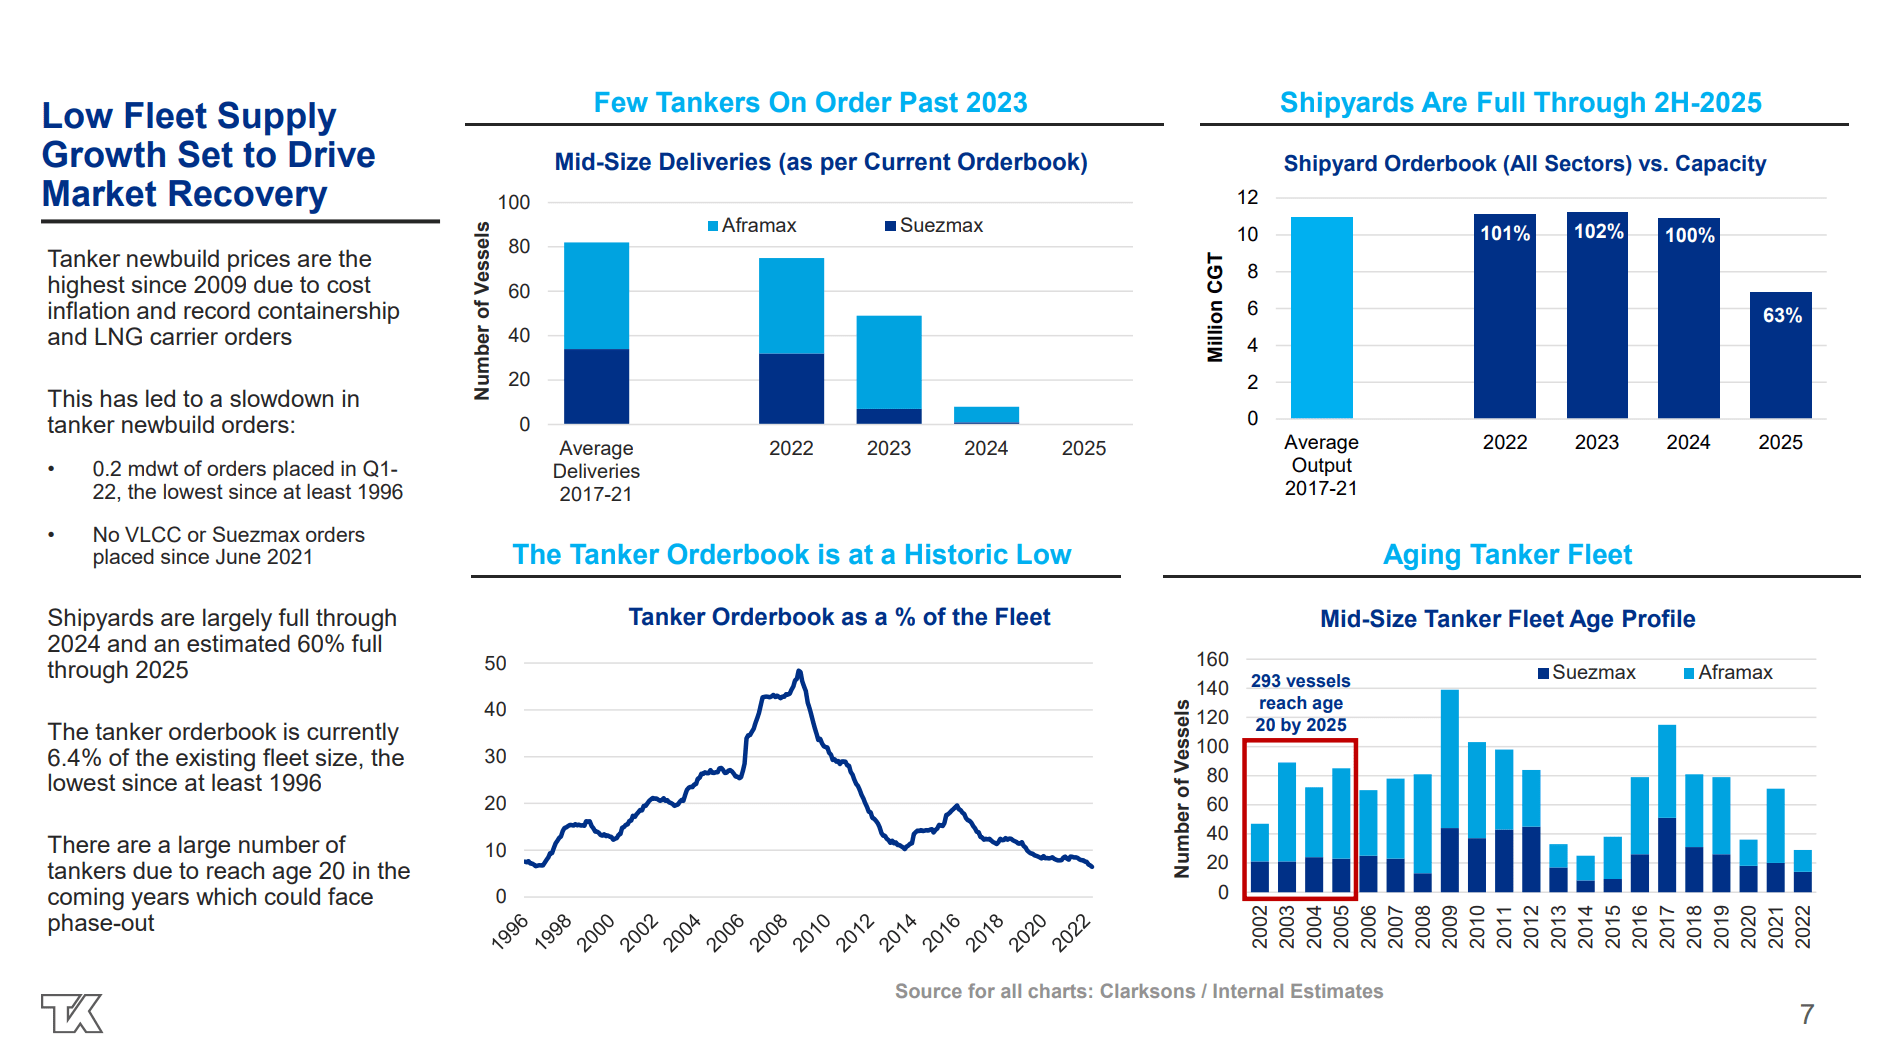
So, this creates a dynamic where tanker rates can stay higher for longer and create a tanker rate cycle that can potentially last multiple years.
Valuation
To build a model for TNK, we first need to figure out what the fleet’s voyage costs are. Luckily, there is some information in the company’s 20F. Figure 7 shows the fleet’s revenues and voyage expenses in 2021. From the figure, we can estimate TNK’s daily voyage expense for Suezmax, Aframax, and LR2 tankers as approximately $20k, $18.5k and $19.7k respectively. As the company’s VLCC is owned in a 50/50 JV and is accounted using the Equity method, I ignore it for this analysis.
Figure 7 – tanker rev and expenses by category (TNK 2021 20F report)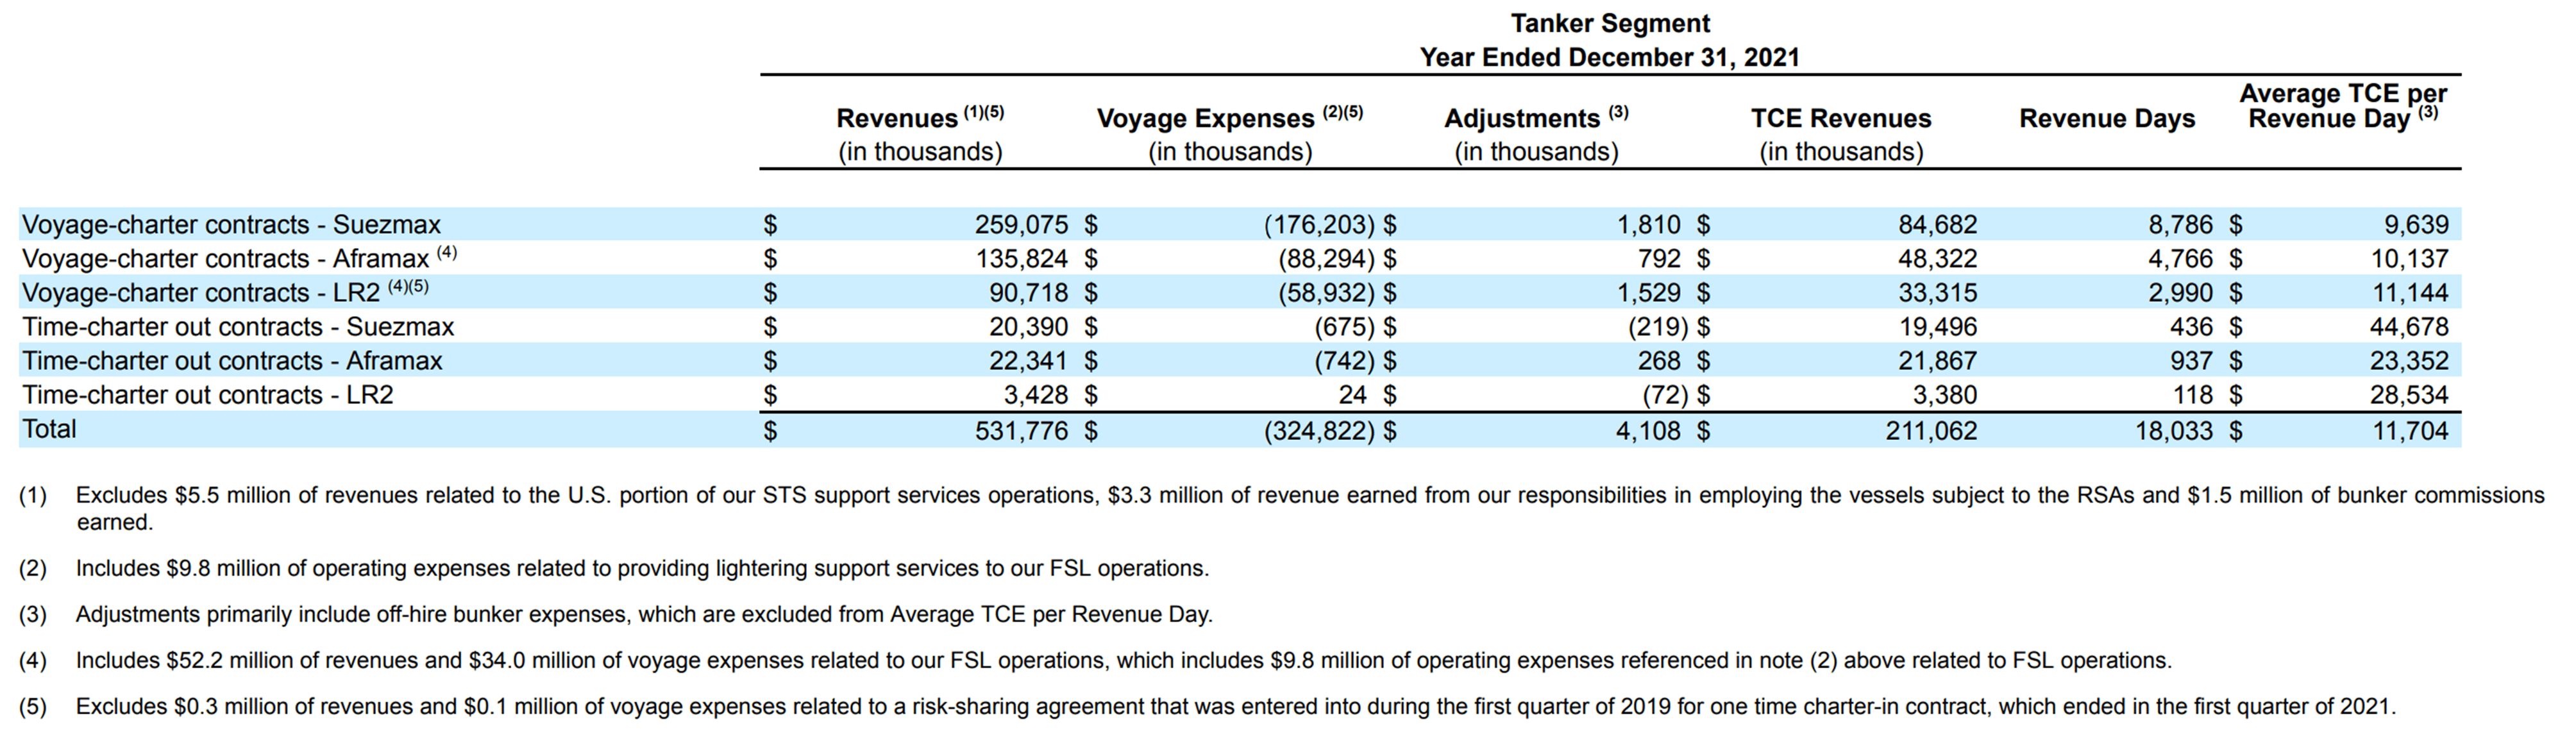
Using the cost figures above, I build out my simple revenue model using assumptions very similar to those in my NAT article (Figure 8). I assume 95% of the ship-days are hired. I annualize Q1/2022 operating expenses, depreciation, and general and admin expenses. I also keep the 3 Aframax currently on time-charter separate from the spot fleet. From my model, TNK achieves breakeven with $45k Suezmax and Aframax rates and $40k LR2 rates.
Figure 8 – Simplified TNK model (Author created)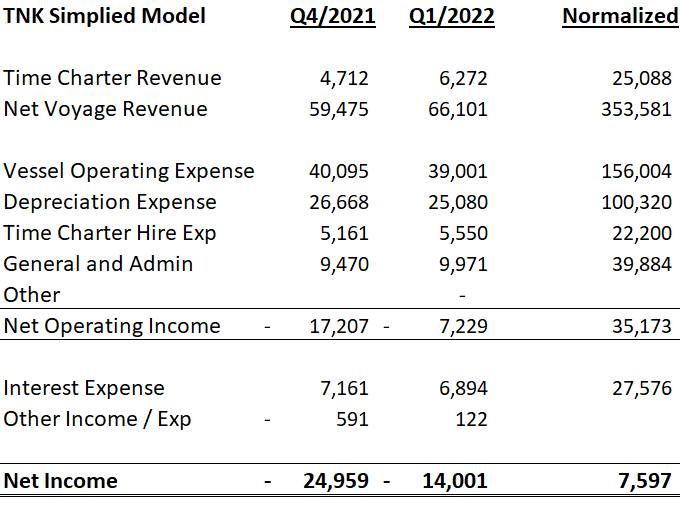
As a sanity check, I compared my model with what TNK achieved in 2020 and 2021 (Figure 9). In 2020, TNK achieved $139 million in operating profit on $582 million of net revenue (with significant time charter revenue embedded). Adjusting for a larger fleet in 2020 (19,714 revenue days in 2020 vs. 18,033 revenue days in 2021), my simple model is certainly in the right ballpark.
Figure 9 – TNK’s 2021 operating summary (TNK 2021 20F report)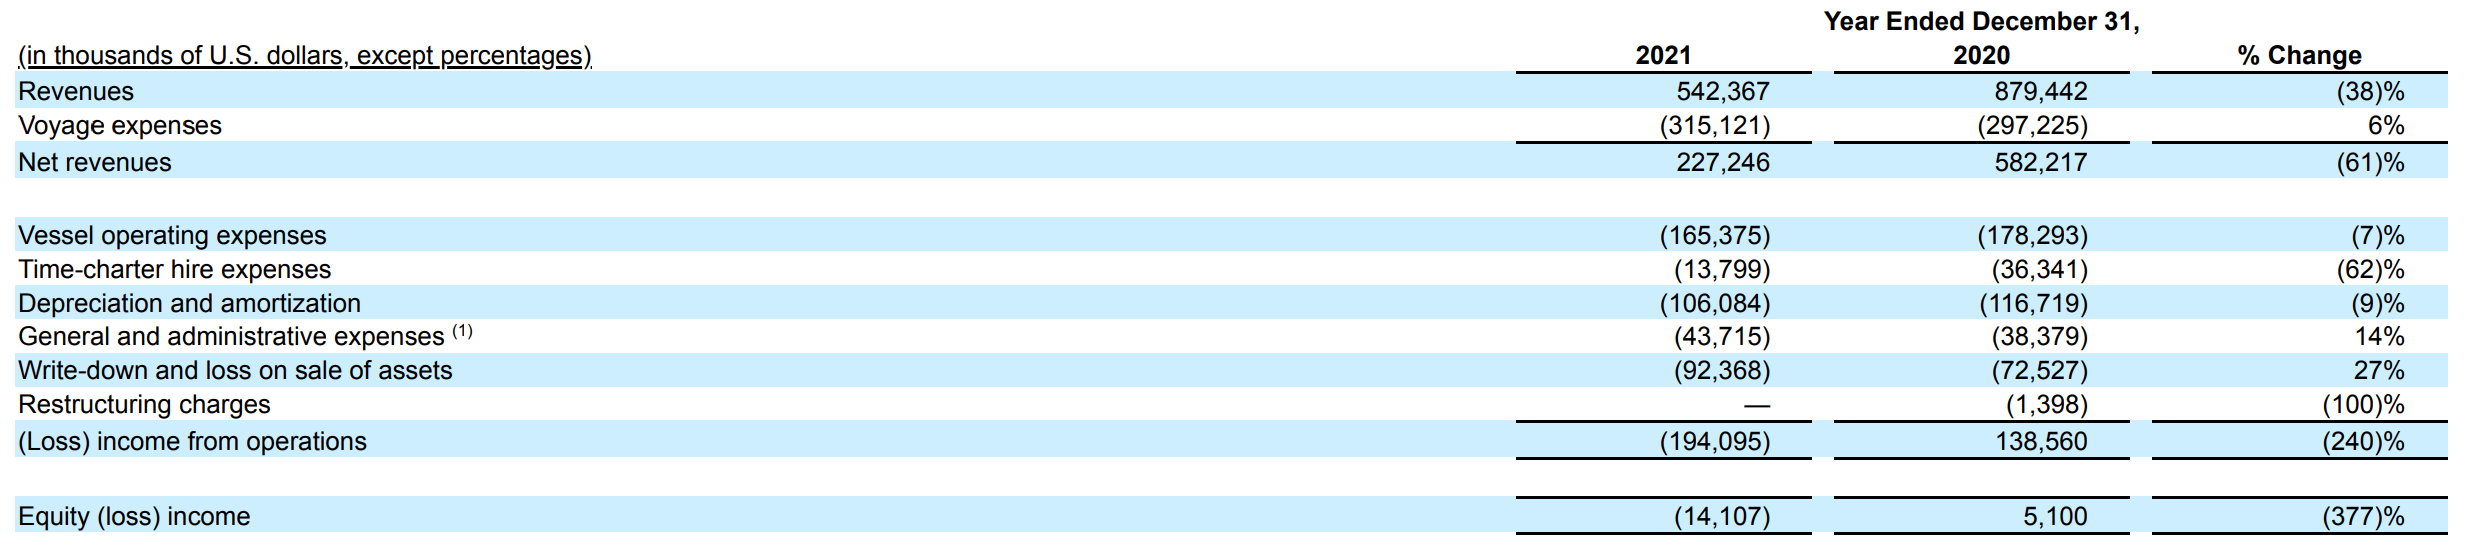
What immediately jumps out at me from the analysis above is the higher breakeven tanker rates required for TNK, versus my NAT model. In my NAT model, NAT achieves breakeven at $31,500 Suezmax spot rates. The main difference is that TNK’s voyage expenses are much higher than NAT. Recall from my NAT article, NAT’s voyage expenses are approximately $7,500 to $8,000 per day, whereas TNK’s voyage expenses are more than double that.
This discrepancy does not appear to be a one-off, either, as my calculation for TNK 2020 daily voyage expenses are $19.2k, $18.3k and $17.3k for Suezmax, Aframax, and LR2 respectively. At the moment, I am at a loss for an explanation, except to conclude NAT has a much lower daily voyage expense.
Figure 10 shows a sensitivity varying the Suezmax tanker rates vs. the Aframax rates. Note that TNK is more sensitive to Suezmax rates, as Suezmax is more than half the fleet.
Figure 10 – Net Income sensitivity to Suezmax and Aframax tanker rates. (Author created)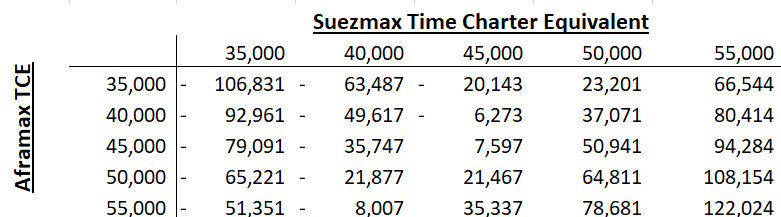
Using current tanker rates of $50k Suezmax, $55k Aframax, and $40k LR2, my model expects TNK to generate run-rate earnings of $79 million, or $2.30 per share. At a $20.70 stock price, this translates into 9x P/E, a fair price to pay. Note that this model assumes no taxes, as tanker companies are typically domiciled in low tax jurisdictions and have lots of operating losses, I believe this is a fair assumption.
Risks To Owning TNK
A large risk to owning Teekay Tankers is, obviously, tanker rates. However, for the reasons I listed above, I think the current trend of higher tanker rates should last for a few years.
Another risk to TNK is its high debt. As of Q1/2022, TNK has $612 million in debt and finance leases, or $13.3 million per vessel. High debt can restrict the operating flexibility of the company and / or cause the company to go into financial distress if the debt cannot be refinanced at maturity.
Technical Analysis
Technically, TNK has a large cup and handle pattern that could take it back to 2020 highs at $27 (Figure 11). It is currently carving out the handle pattern with resistance at $22.
Figure 11 – TNK cup and handle pattern (Author created with price chart from stockcharts.com)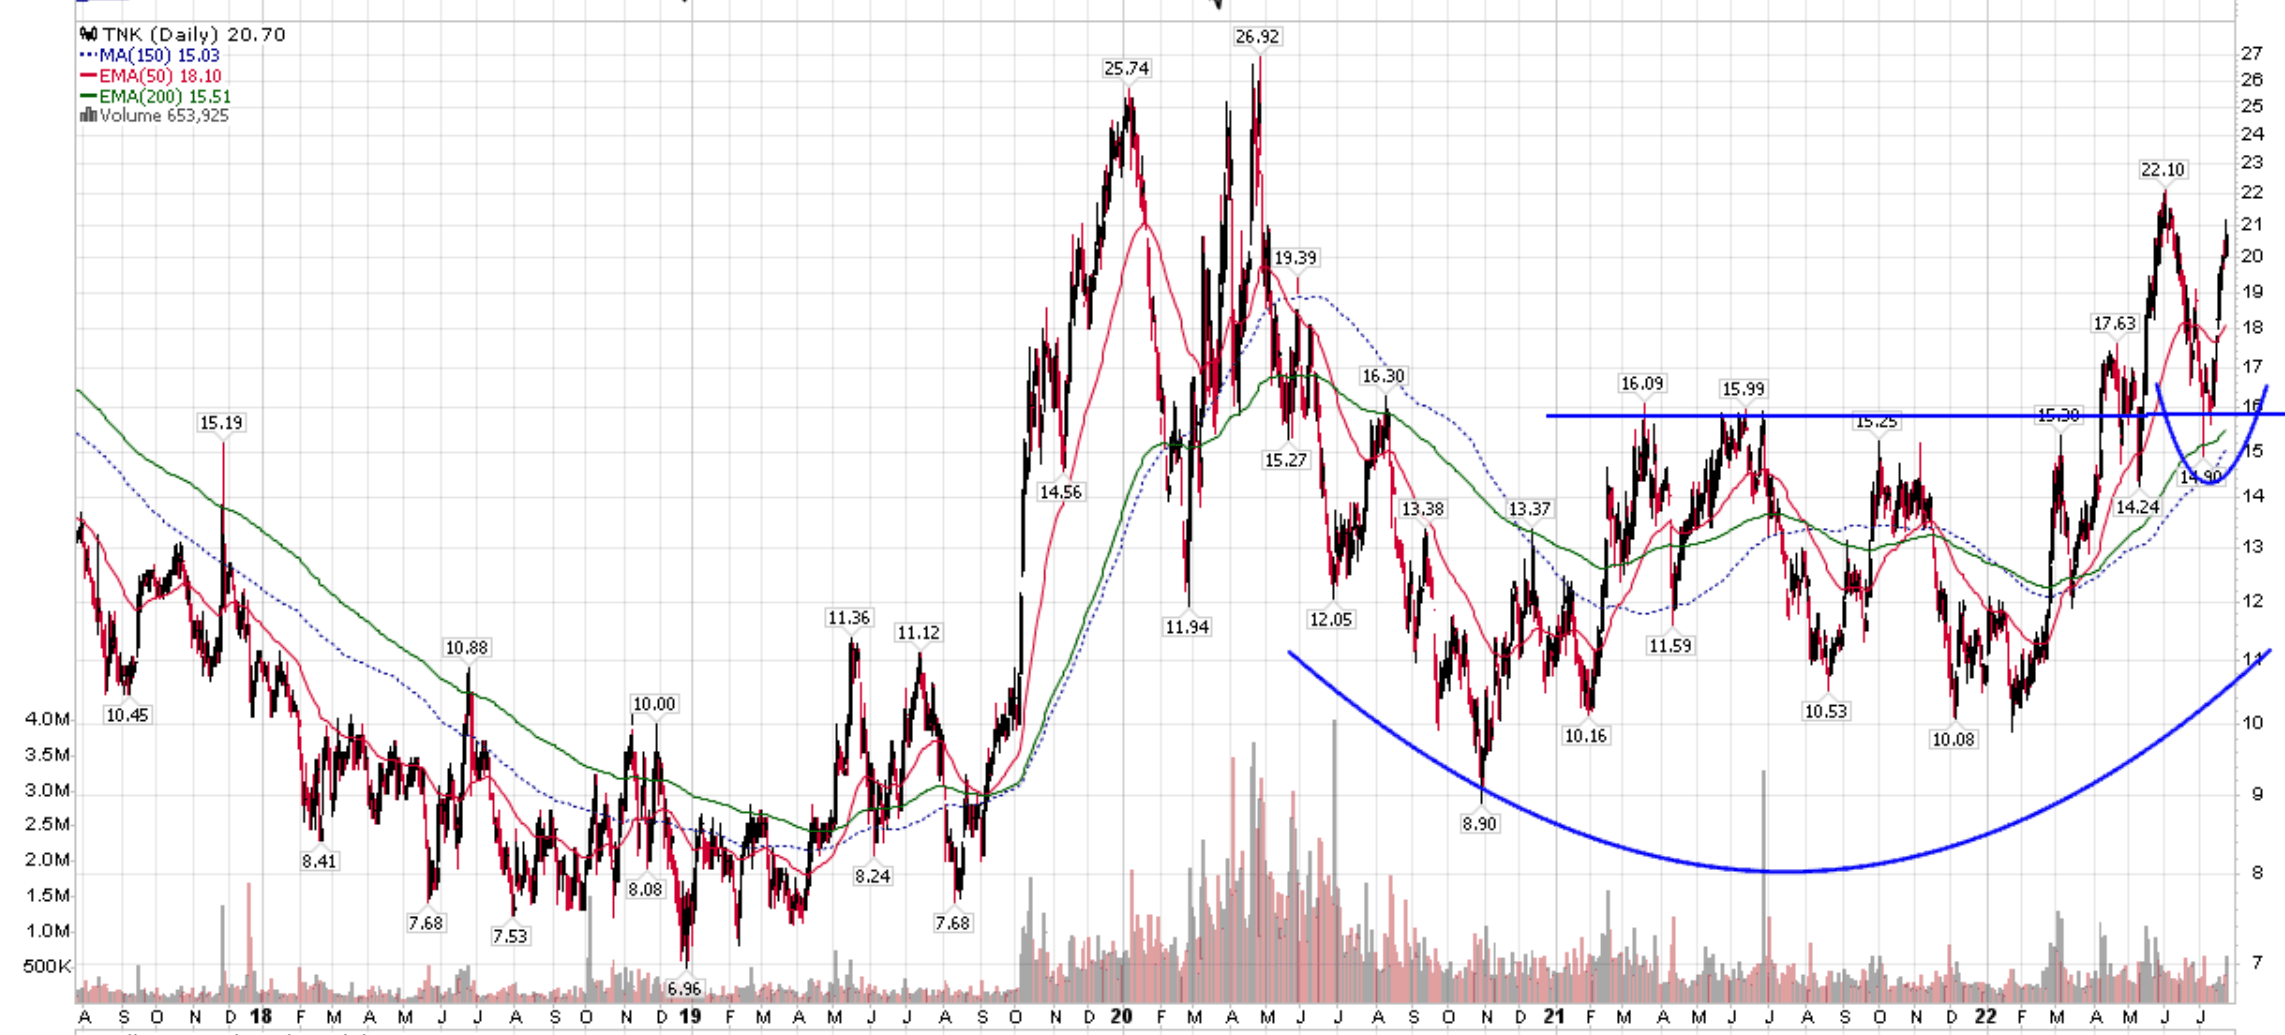
Conclusion
With strengthening tanker rates, TNK should benefit greatly with 94% of its fleet trading on the spot market. At current Suezmax/Aframax rates of $50k/55k, I expect TNK to be in positive earnings territory. However, I personally prefer NAT, as Nordic American has a much lower daily voyage expense, leading to higher earnings per level of tanker rate.
Be the first to comment