

whyframestudio
This dividend ETF (exchange-traded fund) article series aims at evaluating products regarding the relative past performance of their strategies and quality metrics of their current portfolios. As holdings and weights change over time, I post updated reviews when necessary.
TDV strategy and portfolio
The ProShares S&P Technology Dividend Aristocrats ETF (BATS:TDV) has been tracking the S&P Technology Dividend Aristocrats Index since 11/05/2019. It has 40 holdings, a 30-day SEC yield of 1.56%, and a total expense ratio of 0.45%. Distributions are paid quarterly.
As described by S&P Dow Jones Indices, to be eligible in the index, a company must be in the GICS Information Technology sector or in one of three Internet industries classified in the Communication Services sector. It must also have increased dividends every year for at least seven consecutive years and have a 6-month median daily volume above $1 million. The number of years of dividend increase may be reduced if less than 25 companies are eligible. The index is reconstituted annually and rebalanced quarterly with constituents in equal weight
The fund invests exclusively in U.S. companies of all sizes: about 58% of asset value is in large companies, 22% in mid-caps and 20% in small and micro-caps.
The top 3 industries are IT services (27.4%), semiconductors (24.5%) and electronic equipment (20.8%). Other industries weigh no more than 10% individually and 27% in aggregate. Compared with the S&P Technology Select Sector Index (XLK), TDV massively overweights electronic equipment, and it underweights software and hardware by a wide margin.
TDV industries (chart: author; data: Fidelity)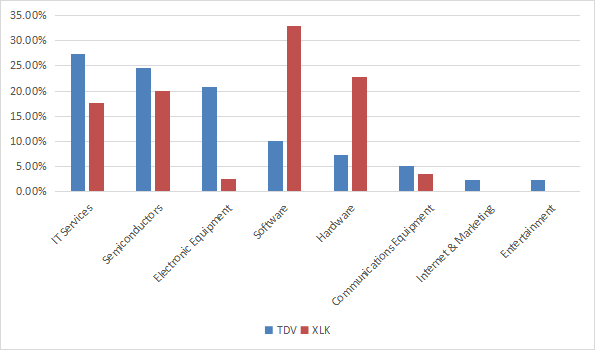
The top 10 holdings, listed in the next table with fundamental ratios, represent 28.3% of asset value. The largest holding weighs 3.3%, so risks related to individual stocks are moderate.
|
Ticker |
Name |
Weight% |
EPS growth %TTM |
P/E TTM |
P/E fwd |
Yield% |
|
KLA Corp. |
3.29% |
25.34 |
18.97 |
17.03 |
1.24 |
|
|
Broadcom, Inc. |
2.92% |
74.74 |
22.09 |
14.23 |
3.18 |
|
|
Lam Research Corp. |
2.89% |
17.75 |
13.58 |
13.70 |
1.46 |
|
|
Power Integrations, Inc. |
2.81% |
29.59 |
25.78 |
25.23 |
0.88 |
|
|
Oracle Corp. |
2.80% |
-6.99 |
27.85 |
18.24 |
1.44 |
|
|
Mastercard, Inc. |
2.75% |
23.12 |
37.51 |
35.65 |
0.61 |
|
|
Microchip Technology, Inc. |
2.75% |
185.92 |
22.85 |
12.62 |
1.75 |
|
|
Skyworks Solutions, Inc. |
2.71% |
-13.12 |
13.04 |
10.40 |
2.44 |
|
|
Cass Information Systems, Inc. |
2.68% |
27.03 |
20.28 |
18.98 |
2.38 |
|
|
CDW Corp. |
2.67% |
6.93 |
25.61 |
19.91 |
1.21 |
Historical performance
Price history is short: the underlying index was launched in October 2019 and the ETF about one month later. S&P Dow Jones Indices provides historical data from 1/31/2014. The next chart compares TDV underlying index (in red) with those of SPY (in green) and XLK (in blue) in the last 5 years.
TDV, SPY and XLK underlying indexes, last 5 years (chart: author; data: S&P Dow Jones Indices)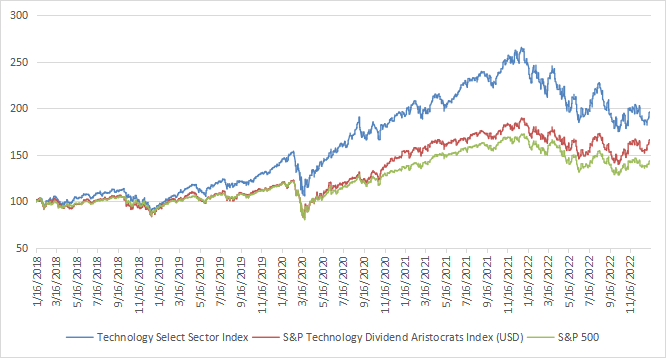
Based on underlying indexes since 2018, TDV strategy (simulated) lags the sector benchmark and outperforms the broad index.
The next table compares real ETF performance and risk metrics since TDV inception. It includes another “dividend aristocrat” fund: the ProShares S&P 500 Dividend Aristocrats ETF (NOBL). The difference between TDV and XLK is not really significant (27 bps in annualized return). They both outperform SPY and NOBL by about 20 percentage points in total return.
|
Total Return |
Annual Return |
Drawdown |
Sharpe ratio |
Volatility |
|
|
TDV |
54.85% |
14.75% |
-32.78% |
0.59 |
22.44% |
|
XLK |
56.02% |
15.02% |
-33.56% |
0.58 |
24.79% |
|
SPY |
35.95% |
10.14% |
-33.72% |
0.45 |
20.87% |
|
NOBL |
35.86% |
10.12% |
-35.43% |
0.47 |
20.06% |
Comparing TDV with a reference strategy
In previous articles, I have shown how three factors may help cut the risk in a dividend portfolio: Return on Assets, Piotroski F-score, Altman Z-score, Payout Ratio.
The next table compares TDV since inception with a subset of the S&P 500: stocks with an above-average dividend yield, an above-average ROA, a good Altman Z-score, a good Piotroski F-score and a sustainable payout ratio. The subset is rebalanced semi-annually to make it comparable to a passive index.
|
Total Return |
Annual Return |
Drawdown |
Sharpe ratio |
Volatility |
|
|
TDV |
54.85% |
14.75% |
-32.78% |
0.59 |
22.44% |
|
Dividend & quality subset |
57.58% |
15.38% |
-35.58% |
0.7 |
20.74% |
Past performance is not a guarantee of future returns. Data Source: Portfolio123.
My dividend quality benchmark is slightly ahead of TDV. It includes all sectors, so it is more relevant to compare it to SPY and NOBL. A note of caution: ETF performance is real and the subset is simulated. My core portfolio has been holding 14 stocks selected in this subset since October 2020 (more info at the end of this post).
TDV annual distributions have increased from $0.58 to $0.92 per share between 2020 and 2022. This is a whopping annualized dividend growth rate of 25.9%. However, data history is too short to consider it reliable. It is unlikely to represent the fund’s long-term dividend growth.
Value and Quality
TDV has a portfolio of 40 holdings. It is cheaper than the sector benchmark regarding the usual valuation ratios, as reported in the next table. The price/sales ratio is especially low.
|
TDV |
XLK |
|
|
Price / Earnings TTM |
20.3 |
23.98 |
|
Price / Book |
5.12 |
7.06 |
|
Price / Sales |
2.38 |
5.09 |
|
Price / Cash Flow |
18.08 |
17.86 |
I have scanned TDV holdings with the quality metrics described in the previous paragraph. In my ETF reviews, risky stocks are companies with at least 2 red flags among: bad Piotroski score, negative ROA, unsustainable payout ratio, bad or dubious Altman Z-score. With these assumptions, only one stock is risky here: PetMed Express, Inc (PETS), with a Piotroski score of 4 and a payout ratio of 155%. It weighs only 2% of the portfolio.
Based on my calculation of aggregate metrics (reported in the next table), TDV has a better Piotroski F-score than XLK, but a slightly lower return on assets. The difference in Altman Z-score is not significant. In conclusion, portfolio quality is close to the benchmark.
|
TDV |
XLK |
|
|
Atman Z-score |
6.42 |
6.6 |
|
Piotroski F-score |
6.05 |
5.64 |
|
ROA % TTM |
12.45 |
13.78 |
Takeaway
ProShares S&P Technology Dividend Aristocrats ETF is a dividend-growth ETF in technology with an equal-weight methodology. Relative to the sector benchmark XLK, it overweights IT services, semiconductors and electronic equipment, and underweights hardware and software.
TDV is cheaper than Technology Select Sector SPDR ETF regarding valuation metrics, and quality is similar. The underlying index has underperformed XLK in the last 5 years. TDV may be a candidate for long-term investment, but it is not a good trading instrument: trading volumes are low. Anyway, limit orders are always recommended.
For transparency, my equity investments are split between a passive ETF allocation (TDV is not part of it) and an actively managed stock portfolio, whose positions and trades are disclosed in Quantitative Risk & Value.
Be the first to comment