

sanfel/iStock Editorial via Getty Images
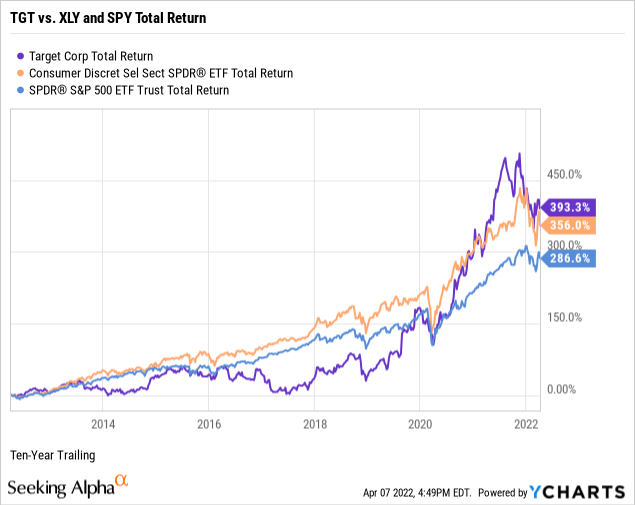
Inspired by its Millennials-driven value proposition, I first recommended the common shares of Target Corporation (NYSE:TGT) to Marketplace subscribers in February of 2019. The share price was flying at the time, while the stock appeared to be a bargain. TGT is up 238% since, outperforming the S&P 500 by 17,405 basis points, or 174 percentage points.
Nonetheless, as we enter the coronavirus endemic with high energy prices, the war in Ukraine, a seemingly overvalued stock market, and fears of recession, is the Bullseye still a bargain retailer for its stock price as well?
In my first public research report on Target, I put the company and its common shares through my market-beating, data-driven investment research checklist of the value proposition, shareholder yields, returns on management, valuation multiples, and downside risk.
The resulting investment thesis:
Target is a fundamentally strong retailer with a compelling value proposition and acceptable downside risk. However, its lack of an economic moat, fairly valued multiples, and reliance on local storefronts for 96% of its omnichannel sales fulfillment suggest an add for current shareholders with a low cost basis, or as a defensive buy for interested long-term shareholders who can stomach potential price volatilty from economic headwinds.
Unless noted, all data presented is sourced from Seeking Alpha and YCharts as of the market close on April 7, 2022; and intended for illustration only.
A complimentary Glossary of Investing Terms is provided in a linked Google Sheet for article brevity and quick reference. The glossary is exclusive to Seeking Alpha readers. It is recommended to open the sheet in a separate window or tab. For convenience, a link back to SA is provided.
Value Proposition
Target is a dividend-paying large-cap stock in the consumer discretionary sector’s multiline retail/general merchandise stores industry. The company operates approximately 2000 stores offering food assortments, including perishables, dry grocery, dairy, and frozen items; apparel, accessories, home décor products, electronics, toys, seasonal offerings, food, and other merchandise; and beauty and household essentials.
The chart below illustrates the TGT’s outperformance during the past ten years against the Consumer Discretionary Select Sector SPDR Fund ETF (NYSE:XLY) and the SPDR S&P 500 ETF Trust (NYSE:SPY). Ultimately, investing in individual common stocks should aim to beat the benchmark indices over time. For example, TGT outperformed its sector and market benchmarks over the last ten years, most notably during the 2020-22 COVID-19 pandemic.
My value proposition elevator pitch for Target:
Millennials’ favorite place to shop when offline. Of course, Target shoppers are buying online as well, albeit from the inventory of their local store. Nevertheless, the Bullseye continues as a comfort zone for the allegedly rare, millennial on-ground shopping spree.
Although its omnichannel offerings provided a haven during the pandemic, less than 20% of revenue originates digitally, with most online sales fulfilled at the local store level.
My value proposition rating for Target: Bullish for on-ground; Neutral for online.
Yields
As part of my due diligence, I average the total shareholder yields on earnings, free cash flow, and dividends to measure how a targeted stock compares to the prevailing yield on the 10-Year Treasury benchmark note. In other words, what is the equity bond rate of the common shares?
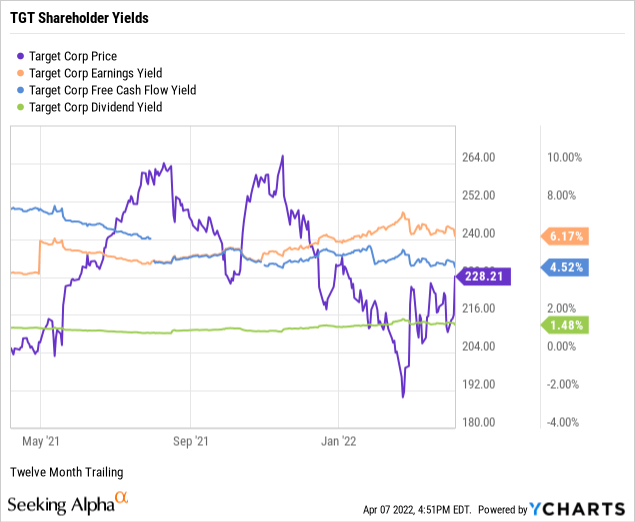
I target an earnings yield greater than 6 percent or the equivalent price to earnings multiple below 17 times, and as demonstrated in the chart below, at 6.17%, TGT slightly exceeded the floor.
I target a free cash flow yield of 7 percent and higher or the equivalent of fewer than 15 times the inverted price-to-free cash flow multiple. At 4.52%, TGT fell short of the threshold.
Although not a dividend investor by definition, I prefer dividend-paying stocks for compensation in the short term while waiting for capital gains to compound over time. Target had a modest dividend yield of 1.48%, supported by a conservative payout ratio of 23.32%, below my 60% payout ratio ceiling, indicating a safe, well-covered dividend.
Next, I take the average of the three shareholder yields to measure how the stock compares to the prevailing yield of 2.66% on the rising 10-Year Treasury benchmark note. The average shareholder yield for TGT was 4.06%, or 140 basis points above the 10-Year. Arguably, equities are deemed riskier than U.S. bonds. However, securities that reward shareholders at higher yields than the government benchmark, such as TGT, favor owning the stock instead of the bond.
Remember that earnings and free cash flow yields are inverses of valuation multiples and suggest TGT as an undervalued stock relative to earnings per share and overvalued relative to free cash flow. I’ll further explore valuation later in this report.
My shareholder yields rating for TGT: Bullish.
Fundamentals
Let’s explore the fundamentals of Target, uncovering the performance strength of its senior management.
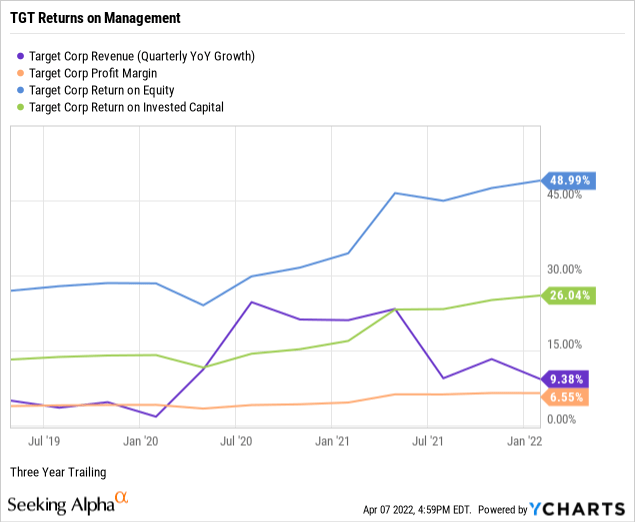
I am biased toward established growth instead of executive guidance and sell-side analyst projections when analyzing a business. For example, per the below chart, Target had three-year revenue growth of 9.38%, well below the consumer discretionary sector median of 25.88%, but reasonable for a multiline retailer.
Target had a trailing three-year pre-tax net profit margin of 6.55%, in-line with its sector peers. In general, I screen for profitable companies to avoid unnecessary speculation, as witnessed in the money-losing disruptive growth stocks of late. Philanthropically, since 1946, the company has donated 5 percent of its profits to the communities where it operates.
Return on equity or ROE reveals how much profit a company generates from shareholder investment in the stock. I target an ROE of 15 percent or higher to discover shareholder-friendly management. At 48.99%, Target was producing extraordinary trailing three-year returns on equity against a median of 17.20% for the sector.
I target a return on invested capital or ROIC above 12%. Target’s three-year trailing ROIC of 26.04% was more than double the threshold and triple the sector median of 7.71%, indicating that its senior executives are highly efficient capital allocators. Return on invested capital measures how well a company invests its resources to generate excess returns. On the contrary, returns stock market-wide appeared challenged during the pandemic.
ROIC needs to exceed the weighted average cost of capital or WACC by a comfortable margin, affirming management’s ability to outperform its capital costs. For example, Target had a trailing WACC of 7.90% (Source: GuruFocus). The spreads between ROIC and WACC combined with competitive net profit margins and compelling equity and capital returns for a retailer indicate extraordinary management performance.
My return on management rating for Target: Bullish.
Valuation
I rely on four valuation multiples to estimate the intrinsic value of a targeted quality enterprise’s stock price. The model reflects market sentiment proximate to the financial vertical of trailing sales, earnings, cash flow, and enterprise value.
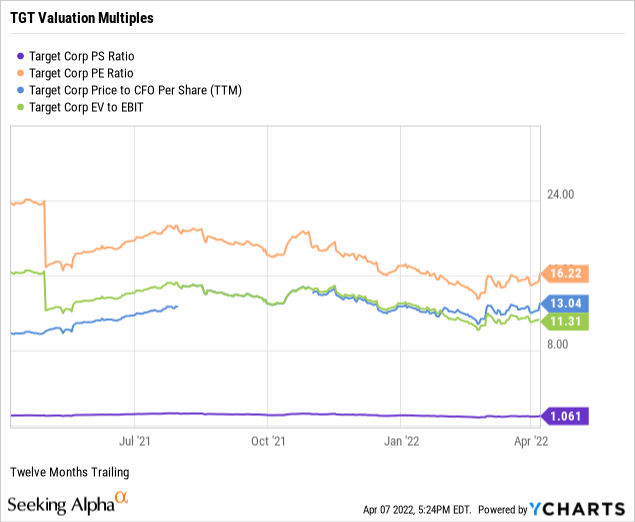
The price-to-sales ratio or P/S measures the stock price relative to revenues. I target fewer than 2.0 times, and TGT was trading at 1.06. The trailing median P/S ratio was 0.95 for the consumer discretionary sector and 2.98 for the S&P 500. Thus, the weighted sector plus market sentiment suggests that TGT is reasonably valued relative to the company’s topline.
Although often a hit or miss multiple, I target price-to-trailing earnings or P/E multiples fewer than 17 times or below the target stock’s industry and sector averages. TGT had a price-to-earnings multiple of 16.22 against a sector median P/E of 13.09. Further, the stock was trading at a discount to the S&P 500’s recent overall P/E of 25.57 (Source of S&P 500 P/E: Barron’s), indicating that investor sentiment fairly values the stock price to its sector while undervaluing it to the market relative to earnings per share.
I target single-digit price-to-operating cash flow multiples for the best value. At 13.04, TGT was trading above my ceiling, and the sector median of 10.49, indicating the market fairly values the stock price relative to current cash flows.
Enterprise value to operating earnings or EV/EBIT measures whether a stock is overbought, a bearish signal, or oversold, a bullish signal, by the market. I target an EV/EBIT of fewer than 15 times. Target was trading at 11.31 enterprise value to operating earnings. Based on the broader sector median of 12.29 times, TGT appears somewhat underbought by the market, a neutral to bullish signal.
The weighting of my preferred valuation multiples suggests that the market has reasonably valued Target’s stock price. Therefore, based on the fundamentals and valuation metrics uncovered in this report, risks and potential catalysts notwithstanding, I would call TGT the reasonably-priced stock of a quality multiline retail operator.
My valuation multiples rating for TGT: Neutral to the sector; Bullish to market.
Downside Risk
When assessing the downside risks of a company and its common shares, I focus on five metrics that, in my experience as an individual investor and market observer, often predict the potential risk/reward of the investment. Hence, I assign a downside risk-weighted rating of above average, average, below average, or low, biased toward below average and low-risk profiles.
Alpha-rich investors target companies with clear competitive advantages from their products or services. An investor or analyst can streamline the value proposition of an enterprise with an economic moat assignment of wide, narrow, or none.
Morningstar assigns Target a moat rating of none:
Despite Target’s iconic brand, we do not believe the company benefits from an economic moat, reflecting intense competition and the lack of switching costs in retail. While its efforts to boost its omnichannel presence are welcome and have put it on firmer footing in a fast-changing retail landscape, we do not believe Target has the procurement scale, differentiated business model, or online dominance of the moat-endowed retailers we cover.
– Zain Akbari, CFA, Equity Analyst, March 11, 2022
A favorite of the legendary value investor Benjamin Graham, long-term debt coverage demonstrates balance sheet liquidity or a company’s capacity to pay down debt in a crisis. Generally, at least one-and-a-half times current assets to long-term debt is ideal. As reported on its January 2022 financial statements, Target’s long-term debt coverage was above the threshold at 1.86.
Thus, Target has ample liquidity necessary to cover its longer-term leveraging needs. Moreover, in a further test of paydown capacity, the company’s long-term debt to equity was 105.63%, comfortably below my 200% ceiling. In other words, investors should become concerned only when a company’s debt is more than twice its equity.
Current liabilities coverage or current ratio measures the short-term liquidity of the balance sheet. I target higher than 1.00, and Target’s short-term debt coverage was 0.99, providing nearly 100% of the liquid assets to pay down its current liabilities such as accounts payable, accrued expenses, income taxes, and unearned revenue. Retailers tend to have current ratios below 1.00 because of the fast turnover of high inventories purchased by the business on credit but sold to the customer for cash, i.e., predominantly consumer credit from third-party issuers.
I use a two-year beta trend line and screen for stocks lower than 1.25 or no more than 125% volatility to the market. TGT’s 24-month trailing beta was 0.81, below the S&P 500 standard of 1.00. Thus, the stock appears to be a defensive holding.
The short interest percentage of the float for TGT was 3.09%, under my 10% ceiling; however, the few near-sighted bears may view the stock as vulnerable because of the recent price run-up countered by its lack of an economic moat.
Overall, Target is a fundamentally sound company with an acceptable risk profile; although, in my view, its lack of an economic moat prevents a below-average rating.
My downside risk rating for Target: Average.
Catalysts and Final Thoughts
Catalysts accelerating or contradicting my overall bullish investment thesis on Target Corporation and its common shares include, but are not limited to:
- The company leverages its solid fundamentals and preferred store status and continues to sustain growth and profitability despite the storefront-oriented omnichannel strategy.
- The stock price becomes rangebound as headwinds halt the stock’s multi-year run in an uncertain post-pandemic economy.
Target, the company, is a buy for its value proposition, fundamentals, and risk; however, TGT, the stock, is arguably a hold in the current economic environment following its recent run-up and no moat rating. Nonetheless, long-term TGT holders with a low-cost basis should find the stock worthy of adding shares at the current valuation, and interested new investors could argue a defensive buy for the long term.
Be the first to comment