

Gile68/iStock via Getty Images
Invesco Solar Portfolio ETF (NYSEARCA:TAN) peaked at $101.36 last November, capping a nice rally in solar energy stocks. It then sold off for most of the first half of this year, bottoming at $55.54 in mid-May. Since then, it has gone on a 50% rocket ride up to its current price in the low-to-mid-$80’s.
Seeking Alpha Premium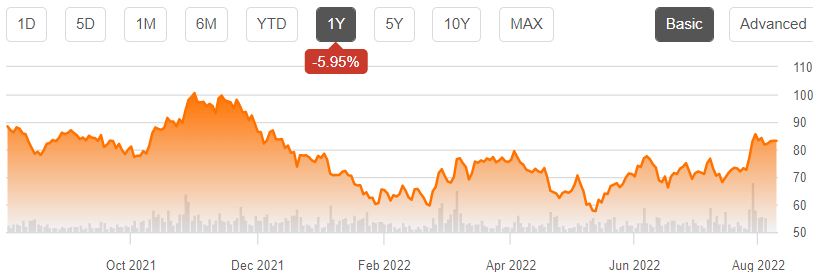
What is going on with this ETF, and where is it headed now?
Rudimentary Elliott Wave analysis
Elliott Wave analysis strongly suggests TAN’s price reached a major bottom at $55.54 in May of this year. My reasoning is as follows.
According to Elliott Wave theory, stock prices move impulsively in 5-wave patterns, with waves 1, 3, and 5 climbing, and waves 2 and 4 declining. To see where TAN stands today, we have to go all the way back to its all-time low of $12.60, set on November 16, 2012. Off that low, TAN shares rose in price to exactly $50.00 on April 23, 2015. In Elliott Wave terms, this completed wave 1 of its current cycle. This climb, known as the 1.0 extension, was $37.40.
TAN 10-year Price Chart (TD Ameritrade)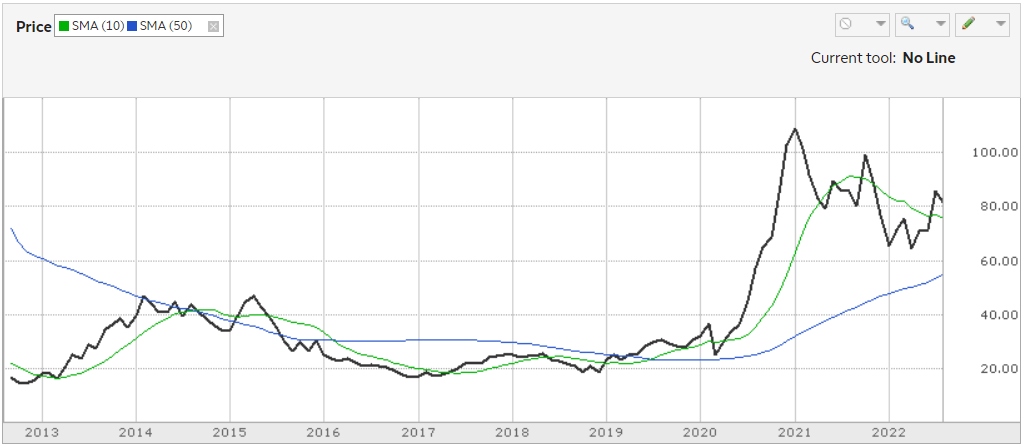
Next, TAN shares sold off to $16.45 on December 30, 2016. In Elliot Wave parlance, this is called a wave 2 retrace, and it was a deep one, at 89.7% of the move up.
Elliott Wave theory says the next thing that should happen is a Wave 3 much larger than Wave 1. And in fact, TAN shares rose massively to a peak of $125.98 on January 25, 2021, just shy of the 3.00 extension. This is much larger than the typical 3 wave, but it cannot be anything else.
Next, shares should sell off in a wave 4 retrace, and that retrace should have 3 waves of its own: a downward wave A, an upward wave B, and a downward wave C. Ideally, the length of wave A should equal the length of wave C. Let’s see what happened.
TAN 3-year Share Price Chart (TD Ameritrade)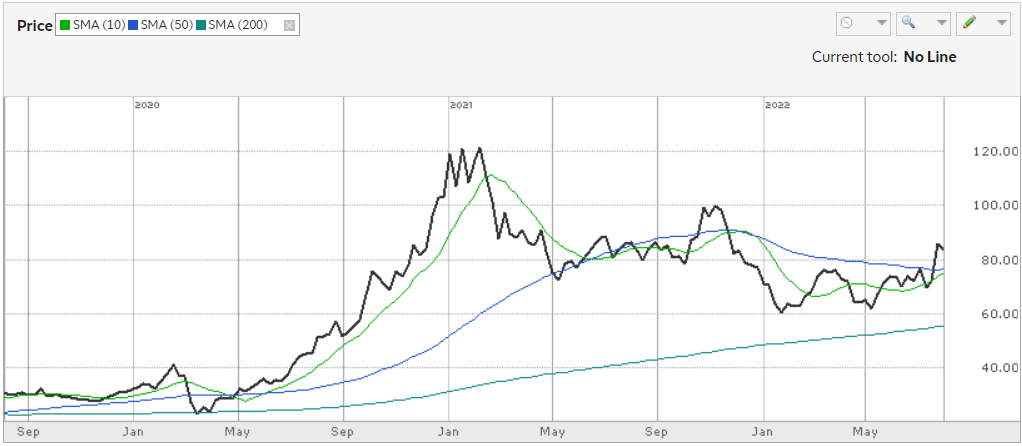
From the peak at $125.98, TAN shares sold off to $67.78 on May 13, 2021. So the A wave was $58.20 in length. So, wherever the B wave tops, we should be able to predict the C wave bottom by subtracting $58.20.
TAN shares then ran up to the aforementioned B wave peak of $101.36 on November 1, 2021. Elliott Wave math suggests we should see shares bottom at about $43.16.
In fact, TAN shares sold off until they reached $55.54 on May 12 of this year. Since then, price has moved upward sharply and insistently, making higher highs and consistently higher lows as well. I defer to more expert Elliott Wave analysts to say whether this is the start of an impulsive wave 5 to the high side, or a corrective 3-wave climb before a plunge to the $43.16 region.
TAN 6-month Share Price Chart (TD Ameritrade)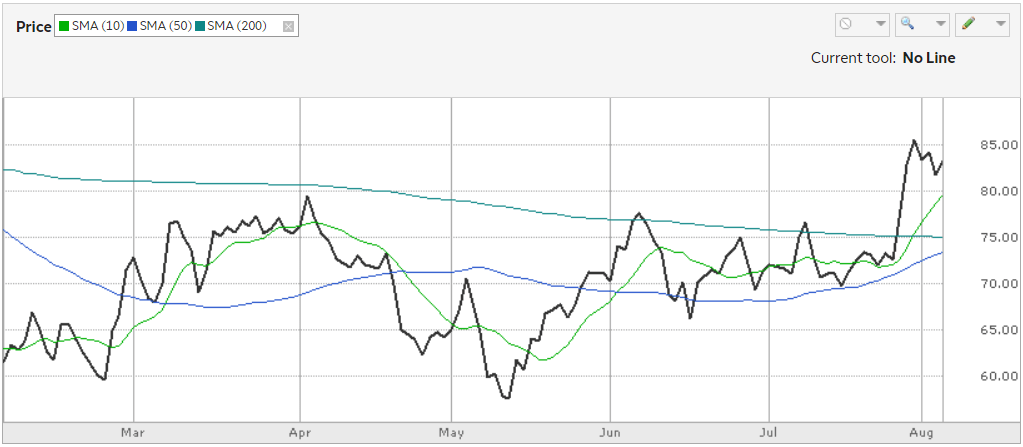
However, there are numerous signs of the former, as the price has risen above the 15-day, 50-day, and 200-day moving averages, and the 15-day crossed above the 50-day in early June. It has already run up 50% since its May low. The 50-day average has risen very near the 200-day, which is usually a classic indicator of the end of a bear market trend.
If this is an impulsive move to the upside, then the 1.0 extension at this smaller level of trend is $23.10 ($78.64 wave 1 high minus $55.54 bottom), and the wave 2 bottom established at $65.71 on June 16 should hold for quite some time. Under this scenario, wave 3 should top around $103.09, which would be the 1.618 extension off $65.71. Then after a wave 4 pullback, wave 5 at this smaller level of trend should top out around $111.91, which is the 2.00 extension. This would be an upward move of over 30% in the near term.
All of this would be just the beginning of the larger wave 5, to complete the cycle that began in 2012, peaking somewhere around $155, which would be about an 85% move up from its current price.
On the other hand, if this is not an impulsive move to the upside, our first clue will be a break of the $78.64 level. This would increase the likelihood of a plunge to the $43.16 neighborhood, particularly if price goes on to break below $65.71, but in my view would require the entire economy to plunge into recession (which is still possible, of course).
So from a technical standpoint, it appears we are drawing near a good time to go long in TAN, on the next major pullback. In fact, for long-term investors (3 years or more), that time is already here.
Geopolitical trends
Following the Russian invasion of Ukraine, the European Union has severely cut its purchases of Russian oil. In order to meet the resulting shortfall, the EU is heavily investing in solar and other renewable energy resources.
On May 18, EU headquarters in Brussels announced the REPowerEU Plan, whose goals are supported by 85% of Europeans. The sweeping plan calls for energy savings, diversification of energy supplies, and an accelerated roll-out of renewable energy to replace fossil fuels in homes, industry, and power generation. A first step in this direction was the creation of the EU Energy Platform, supported by regional task forces, to enable voluntary common purchases of gas, LNG and hydrogen by pooling demand, optimizing infrastructure use, and coordinating outreach to suppliers.
Meanwhile, in response to the huge drop-off in supply to the West, oil prices have spiked, making other energy sources relatively more attractive. The price of WTI crude went from $65.57 on December 1 to a high of $123.70 on March 8, a meteoric 3-month run-up of 88.7%, and remained as high as $122.11 as recently as June 9, before settling back to its current price in the high $80’s. The 9-month increase now stands at about 35%.
The U.S. government appears to be on the cusp of a major climate investment. Senate Majority Leader Chuck Schumer and West Virginia senator Joe Manchin recently announced agreement on a bill that would invest $370 in energy and climate needs, reduce the budget deficit by $300 billion, and bring down inflation. The new spending would be paid for by imposing a 15 percent corporate minimum tax, increasing IRS enforcement, reducing drug prices, and closing the so-called carried interest loophole.
With Senator Kyrsten Sinema announcing her support, the measure is likely to pass very soon, via budget reconciliation.
Investor’s bottom line
If humankind is to survive, solar and other renewable energy sources are vital. An investment in solar is an investment in our children’s and grandchildren’s quality of life. Happily, it appears from both technical indicators and recent geopolitical events that we are in the early stages of an upward trend that makes such an investment wildly profitable, as well as socially responsible.
Invesco
Be the first to comment