

KanawatTH
Leading asset manager T. Rowe Price Group, Inc. (NASDAQ:TROW) stock has underperformed the S&P 500 (SPX) (SP500) since we downgraded it, seeing that its near-term upside has likely been reflected. Accordingly, TROW posted a total return of -11.5% against SPX’s -3.7% return.
As such, we assessed that the entry levels for TROW look more attractive again, rewarding patient investors who didn’t chase its November momentum spike.
Some TROW investors could be surprised about its underperformance, even though the company reported a 4.7% MoM uptick in its AUM (preliminary) for November. We encouraged investors in our previous article to watch its price action closely, as we postulated the market had likely already anticipated a stronger performance moving ahead.
In addition, asset management industry analysts have continued to pare down their earnings estimates, likely seeing increased risks of a severe recession. However, we noted that analysts have gotten so pessimistic that the write-downs are significantly more than the SPX’s downward revisions.
As such, we deduce that T. Rowe’s forward estimates are unlikely to be revised markedly down, given the high level of pessimism. Hence, it should augur well for the company if our thesis of an October bottom for the SPX could continue to hold.
The recent rate decision by the Bank of Japan (BOJ) has not impacted TROW’s near-term bottoming momentum, even though strategists warned of outflows from risky assets. Notably, BOJ Governor Haruhiko Kuroda stunned global investors as “he’ll now allow Japan’s 10-year bond yields to rise to around 0.5%, double the previous upper limit of 0.25%.”
Hence, investors have been assessing the impact of the BOJ’s decision on whether it represents a regime change. However, it could still be too early to determine as the ex-head of research and fund manager at Rubicon Fund Management, Richard Cookson, articulated:
Quite how this would happen is unclear. It announced at the same time that the BOJ would increase purchases of so-called JGBs from 7.3 trillion yen ($55.2 billion) to 9 trillion yen, which would seem more likely to sap liquidity further. Still, I really don’t know what these numbers mean. After all, a central bank can’t simultaneously pursue price and quantity targets. – Bloomberg
Notwithstanding, it has likely contributed to the recent market volatility, as SPX continued to pull back from its post-November CPI release highs, as we cautioned in a recent article.
Cookson also warned investors that one of his key takeaways is “yields will rise, and risky assets will remain under pressure.” Bloomberg also noted in an update that it caused the yield curves to steepen, impacting longer-dated yields further and doubling down on the suggestion that “a strengthening yen may prompt more repatriation from Japanese investors, a persistent trend this year.”
Now, we wouldn’t be so quick to assess that we could expect more damage from the BOJ’s decisions on the SPX or asset managers like T. Rowe leading to more outflows in the medium term.
Why? As highlighted earlier, we assessed the earnings projections for T. Rowe had already reflected significant damage. And not just for the company but also for the whole industry. Price action is forward-looking, and markets anticipate. But why did TROW still pull back from its November highs, despite the improvement in MoM AUM metrics?
Investors watching the markets over the past two weeks should be keenly aware of the Fed’s hawkish stance through 2023. As such, its summary of economic projections reflects a narrowing path toward avoiding a recession. Despite that, the consensus view has already reflected a recession, although no one can concur on how mild or deep the recession could be.
Even Fed Chair Jerome Powell refused to be drawn to such a conclusion (smartly). But, despite that, the market needs to reflect worsening macro risks of a deeper recession, which was likely not contemplated at TROW’s November highs. Moreover, the IMF also downgraded its outlook, suggesting that the fight against global inflation has taken a significant toll on the world’s economies.
It’s also important to note that TROW surged nearly 45% from its October bottom to its November top. After such a massive uptick, coupled with topping price action signals, a pullback is more than welcome and also healthy in improving reward/risk for additional exposure.
So, the critical question is whether the pullback has been sufficient for investors to enter now?
TROW NTM earnings valuation trend (koyfin)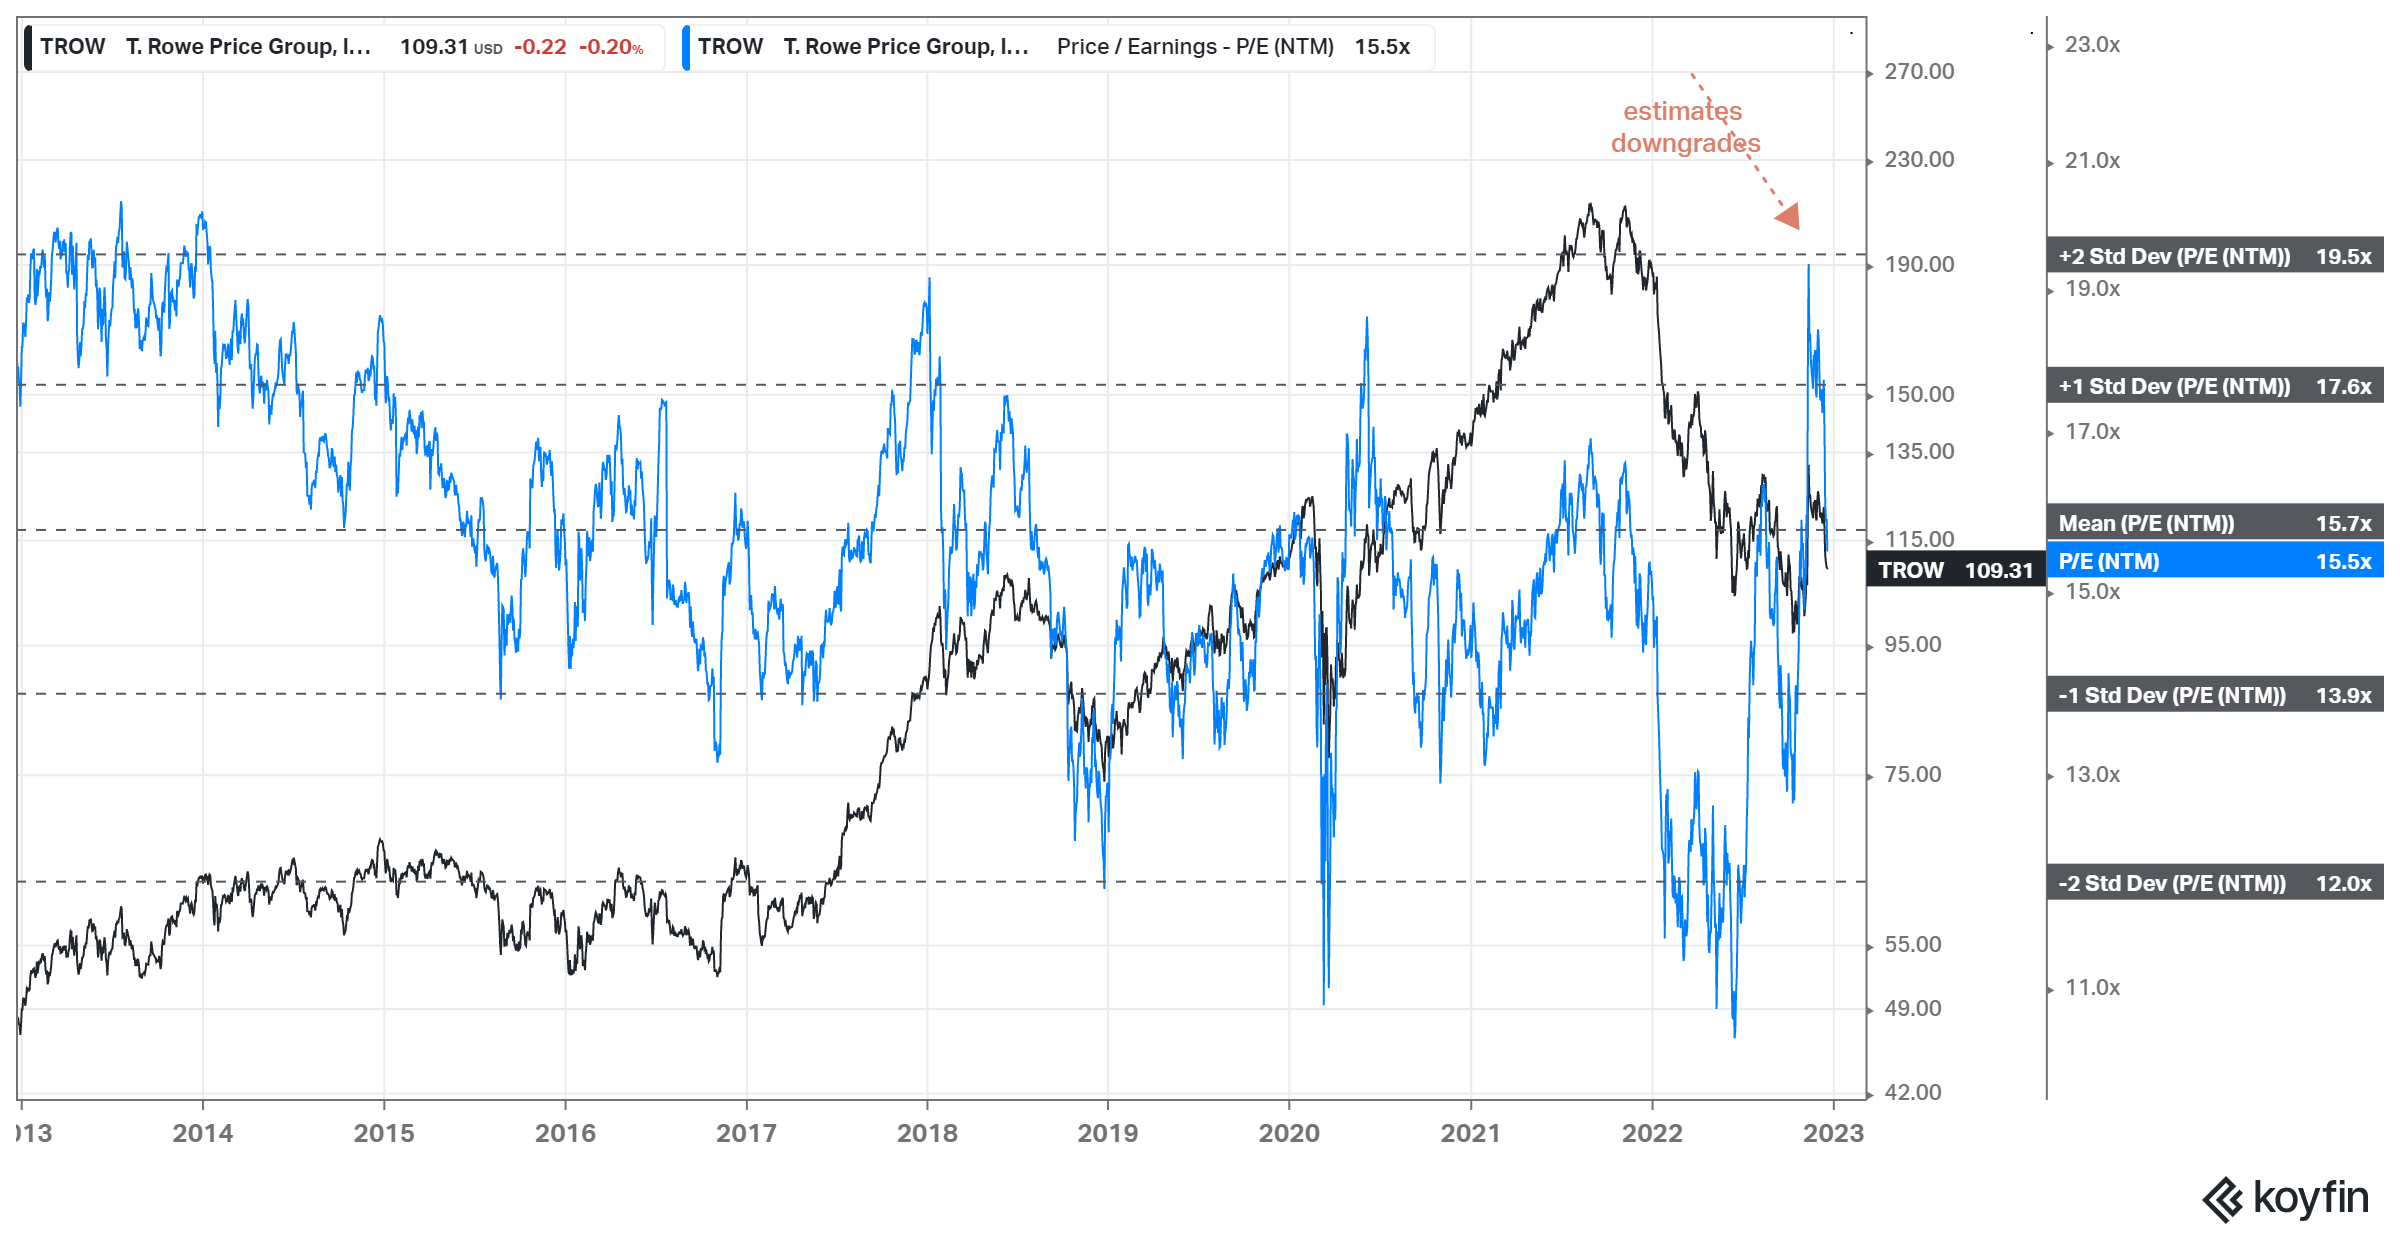
As seen above, analysts slashed TROW’s earnings estimates in November, which caused its earnings multiples to surge toward its two standard deviation zone above its 10Y average.
That’s a sign of extreme panic. Also, even though Wall Street panicked, savvy investors didn’t, as TROW recovered nearly 45% from its October lows.
Also, TROW’s NTM P/E multiple has fallen back to its 10Y average. Therefore, T. Rowe is still expected to post earnings recovery through 2023, in line with our expectations of a market bottom based on its October lows.
But is our observation consistent with TROW’s price action?
TROW price chart (weekly) (TradingView)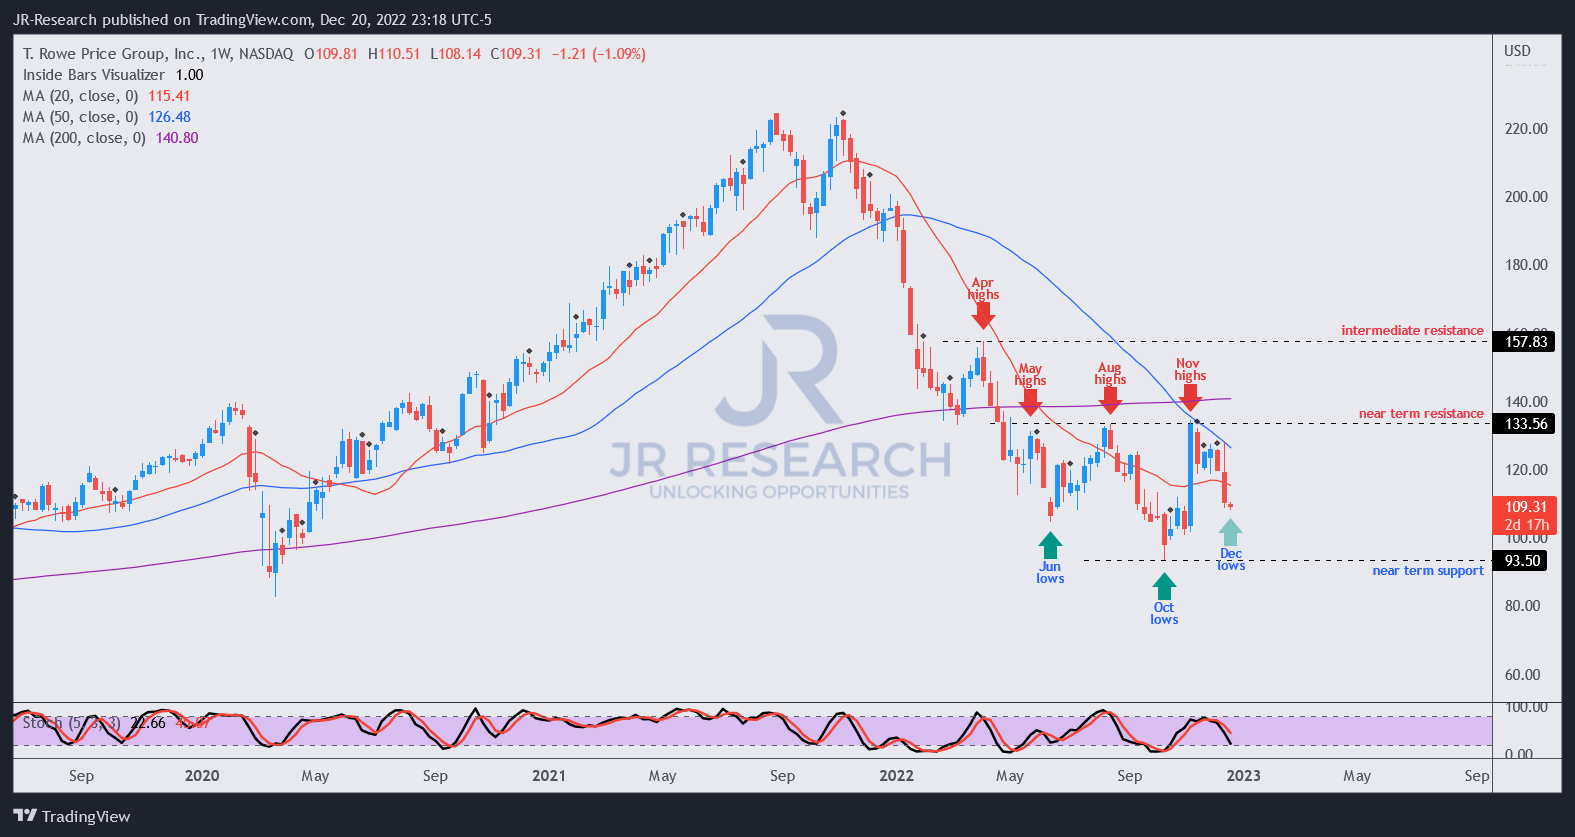
We gleaned a double-bottom bear trap in October, which led to the momentum spike forming its November highs.
The subsequent pullback has also forced TROW’s momentum into oversold zones. Therefore, we should expect to see long-term buyers returning to stanch further downside, as they anticipate that the market could have been over-pessimistic on T. Rowe and its peers through the recession.
Hence, we view TROW’s pullback constructively and assess that the current entry levels represent an attractive entry zone for investors who missed its October bottom.
However, downside volatility could persist in the near term, and therefore, we courage investors to consider layering in their exposure.
Revising from Hold to Buy.
Be the first to comment