

Sakorn Sukkasemsakorn/iStock via Getty Images
By Alex Brazier, Mark Hume, Vivek Paul, Laura Segafredo, Christopher Weber
Tracking the evolving outlook
Investors are constantly updating their views – be it on the likely path of interest rates, company earnings, or stock valuations. That list now needs to include the transition towards a decarbonized economy. We believe the transition has begun but, as with the future path of policy rates, the transition’s path from here is uncertain and evolving. Investors would do well to continually take a view on its progress and likely evolution. We believe, that the faster and more comprehensive it is, the bigger the opportunities could be for companies that are prepared for it and the bigger the risks for others (see pages 6-7).
The transition path will likely be determined by an intricate interplay of three key drivers:
• Technology (capital and operating costs of new and existing technology)
• Societal preferences (changing consumer and investor preferences, including for greener products and assets)
• Climate policy (climate-specific policies, and broader energy, industrial, infrastructure, and land use policies)
These three drivers are constantly in motion. Right now, enacted policies and available technology aren’t sufficient to achieve the goals of the Paris Agreement, namely “to limit global warming to well below 2°C, preferably to 1.5°C, compared to pre-industrial levels”. See the chart. Consensus estimates see current policy likely to only limit global warming to 2.5-3°C. Yet we believe there is a real possibility that these three drivers will ultimately combine to accelerate the transition from the path implied by current policy.
Why? First, technological progress is driving down the cost of switching from carbon-intensive to alternative energy sources. It is making low-carbon technology, especially solar power and batteries, cheaper – albeit with some recent reversal due to supply chain and labor costs. Plus, expected innovation in currently hard-to-abate sectors, like heavy industry and transport (steel, cement, shipping, aviation, etc.), could also help significantly reduce overall emissions in the years ahead. For example, the EU is investing heavily in green hydrogen.
Second, societal preferences could shift as physical damage from climate change – and its human and economic cost – becomes more evident. Damage from extreme weather events today is only a fraction of the likely economic disruption in the world we are currently tracking toward, according to the IPCC. In Managing the net-zero transition, we estimate the ultimate economic cost of climate-related damages if we stay on the current trajectory will outweigh the ultimate cost of the transition. This is particularly true in emerging markets, where expected climate damages are most severe.
Possible acceleration ahead
Illustrative net-zero transition scenarios, 2022
Forward-looking estimates may not come to pass. Notes: The diagram above serves as a general summary and should not be considered exhaustive nor construed as investment advice. The chart describes how quickly the economy could reach net zero. For illustrative purposes only (BlackRock Investment Institute, June 2022)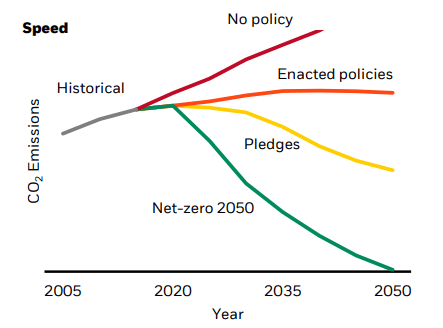
Another factor shifting the balance of societal preferences, notably in Europe, is the West’s decision to reduce its dependence on Russian energy following the invasion of Ukraine. Europe is now doubling down on its efforts to get to net zero, as reflected in the European Commission’s proposed RePowerEU plan. The desire to go green more rapidly reflects concerns about energy security: in 2020 roughly 40% of Europe’s gas supply came from Russia, according to Eurostat data. In the short term, affordability concerns could push societal preferences towards actions that increase emissions, such as recommissioning coal-fuelled power plants. Over the longer term, sustained high prices act as a sort of carbon tax on consumers. Elevated gas and power prices make alternatives more competitive and spur deployment, innovation, and learning in energy efficiency, heat pumps, electric vehicles, and green hydrogen – which regions beyond Europe can also benefit from.
The combination of technology, preferences and regional climate policy could, over time, translate into more ambitious climate policy elsewhere, by lowering the cost of switching to low carbon and encouraging other countries to follow suit through policies like carbon border adjustments. Overall, this makes it more likely that current pledges – consistent globally with limiting global warming to less than 2°C but not to 1.5°C – are met. In some cases, they may translate into more ambitious pledges. But a very significant increase in authorities’ ambition would be needed to move to a path consistent with achieving net zero globally by 2050 (see the chart).
Watching for bumps in the road
We see a real possibility of the global transition accelerating from the path implied by current policy. But we also expect supply shocks and regional differences in speed to make it a bumpy ride. As well as keeping track of the overall global transition, investors may benefit from maintaining a regional view and watching out for possible bumps in the road.
Take the invasion of Ukraine. Although it has provided further impetus to the transition in energy-importing regions like Europe (see page 3), it hasn’t so far provided the same impetus elsewhere. That could mean greater global divergence in the short run. We don’t think energy-producing countries like the U.S will feel the same push to hasten the transition due to the war. First, as energy producers, they are less concerned about finding new (green) energy sources to ensure the security of supply. And second, because the “carbon tax” of high fossil fuel prices is proportionally lower. In the U.S., current high energy prices will still hurt consumers, but to a lesser extent than in Europe. As the chart shows, the share of GDP the U.S. spends on energy is almost half that of the EU. Plus, U.S. oil and gas producers could benefit from helping fill the gap in fossil fuel supply as Europe reduces its reliance on Russian supply.
In addition to divergence across regions, investors should take a view on the prevalence of mismatches along the way between supply and demand for products that are currently carbon-intensive. Fundamentally, the transition is a handoff from carbon-emitting production methods to zero-carbon ones. If the supply of zero-carbon alternatives doesn’t increase at the same pace as carbon-intensive output declines, shortages could result, driving up prices and disrupting economic activity. The faster the transition, the more out of sync the handoff could be, increasing the possibility of supply shortages and higher prices for the carbon-intensive outputs that the economy can’t yet function without. In other words, a more rapid transition could mean a bumpier path – with the potential for economic pain driven by high prices, felt most acutely in emerging markets and by less wealthy cohorts.
When it comes to energy, such imbalances could be severe enough to shape the macroeconomic picture: further aggravating inflation and constraining growth at the broad economy level. Although the West’s sudden decision to wean itself off Russian energy was driven by geopolitical forces rather than the energy transition, its effects illustrate what happens when one energy source is withdrawn before others are immediately available. As we outline in Taking stock of the energy shock, the macroeconomic effects of that energy shock will likely be significant – pushing up on inflation and down on growth – particularly in Europe.
Europe’s energy conundrum
Energy burden as a share of GDP, 1970-2022
Notes: The chart shows the cost of oil, gas, and coal consumption in the European Union and the U.S. as a share of GDP. We use regional energy prices, converted to U.S dollars, and divide by GDP in U.S. dollars. Data for 2022 are based on IMF’s latest GDP forecasts and the year-to-date average of daily commodities prices (expressed in U.S. dollars). (BlackRock Investment Institute and BP Statistical Review of World Energy 2021, with data from Haver Analytics, June 2022)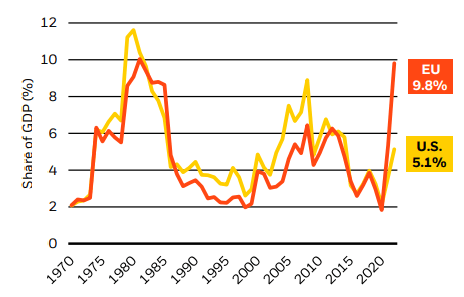
As the transition unfolds, demand and supply imbalances of this type could repeat in some form: policy and demand uncertainty make capital planning highly challenging for carbon-intensive and low-carbon companies alike, which can lead to underinvestment in both.
These imbalances will likely be the dominant driver of the inflationary consequences of the transition. Without them, the transition could be only modestly inflationary. We estimate consumer prices could rise by around 4% by the early 2030s. In a smooth and even transition, with limited supply shocks, that would translate into only around 0.4 percentage points on inflation each year. But in the event of a faster transition with more prevalent supply shocks, more volatility in inflation and economic activity is inevitable. Central banks will face a difficult choice of accepting higher and more volatile inflation or being more aggressive and accepting lower, more volatile output and employment.
The threat, or occurrence, of such volatility and higher energy prices, could slow the process of weaning off the Russian supply in the short term and limit societal preferences for accelerating the transition in the medium and long term.
Taking a view on transition pricing
As the economy rewires, both the expected value of, and uncertainty around, future company cash flows will change. Ahead of those changes actually happening, markets are repricing risks. As with other views on economic and company fundamentals, investors should consider the extent to which their view of the transition path is currently priced by markets. We don’t think the likely transition is fully priced yet – in other words, company valuations still need to adjust further to reflect how exposed companies are to, and how prepared they are for opportunities in, the transition.
Those companies that are better prepared and more able to benefit should be perceived as lower risk and could enjoy a lower cost of capital. Their future expected cash flows may be valued more highly. That would mean, all else equal, the prices of those assets should go up. That effect is reinforced as investor preferences shift towards greener assets. But the repricing process will take time. As it unfolds, owners of those assets could potentially earn higher returns than they would otherwise.
We posited in 2020 that this repricing would happen over time, based on the evidence that financial markets haven’t tended to immediately price in slow-moving trends. They have taken decades to fully reflect previous slow-moving structural shifts, even when that shift is well understood, like the post-war baby boom. The net-zero transition is a similarly large but slow-moving structural economic shift.
How much of the repricing has already happened? In Managing the net-zero transition, we outline a method we’ve developed to measure how, all else equal, a company’s exposure to the transition has already altered the way its future cash flows are valued. We use the emissions intensity of a company’s own operations as a proxy for transition exposure. While lower carbon intensity doesn’t benefit stocks at all times, we found that, over the past half-decade, the value placed on the future cash flows of low-carbon companies, and hence sectors like technology and healthcare, has increased. That effect was not evident in earlier periods. We estimated that the repricing still had more room to run. The latest empirical research suggests that, if anything, our original estimate of the ultimate scale of the repricing might even have been too conservative, reinforcing our conclusion.
We expect that, as greater consensus is reached on transition metrics and reporting improves, it will become clearer which other companies could be positioned to benefit from the transition – meaning they too could experience a similar boost to returns so far enjoyed by low-carbon companies. That includes carbon-intensive companies that have credible plans to shift their business models, or that supply the equipment, materials, and services needed for the transition.
Energy gains ≠ clean energy underperformance
Energy, metals, and clean energy performance vs global index
Past performance is no guarantee of future results. Indexes are unmanaged and do not account for fees. It is not possible to invest directly in an index. Note: The chart shows the performance of the MSCI World Energy Index, MSCI Metals and Mining Index, and the S&P Global Clean Energy Index versus the MSCI World Equity Index across different time horizons: year to date, the past 12 months and annualized for the past three, five and ten years. (BlackRock Investment Institute, with data from Refinitiv Datastream, June 2022)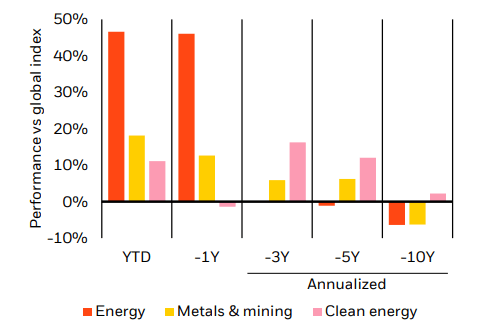
As available measures develop, our repricing analysis could be extended to assess the impact of other important drivers of how a company is positioned for the transition.
High-carbon energy has outperformed the broader market and clean energy this year. See the chart. Does that challenge our view that the cash flows of transition-ready companies will be valued more highly over time? We don’t think so, for two reasons.
First, the outperformance is due to higher expected earnings for these companies because of the post-pandemic activity restart putting pressure on capacity already weakened by low investment (see page 7) and because of the West seeking to replace Russian supply in tight markets (see page 4). Higher expected earnings for these companies aren’t a sign that the transition is expected to slow: there is no flipside underperformance of clean energy versus global equities in the same period. See the chart.
Second, stock prices of fossil fuel companies haven’t gone up in the last year by any more than their future expected earnings and expected oil prices imply they should: the MSCI U.S. oil and gas index rose by 66% between June 2021 and June 2022, despite analysts’ expected 2022 and 2023 earnings for the companies in that index rising in the same period by 167% and 124% respectively. So, in our view, the outperformance of fossil fuels likely reflects higher future cash flows, not a reversal of the five-year market trend to put less value on high-carbon cash flows.
Getting exposure to the transition
Having formed a view on the likely transition path from here – and the extent to which that is priced by markets – how can investors then position their portfolios to help maximize returns while managing risks?
Those who take the view that the transition could accelerate from here and that its risks and opportunities are not yet fully priced should consider gaining exposure to companies and sectors that are prepared for, and set to benefit from, the transition. They will likely take the view that these investments could create higher returns over time. Within a portfolio, that can be expressed at different levels and in different ways.
We pinpoint some of the implications at the asset class level in our climate-aware return assumptions, which provide long-term expectations of risk and return. Taking account of the transition leans our strategic (longer-term) investment preference towards technology and healthcare sectors, rather than sectors that face structural challenges in the transition, such as energy and some materials and utilities. At the asset class level, these sector views lean us towards developed market equities at the expense of high yield and some emerging market debt because of the sectoral composition of these indices.
Investors can also gain exposure to the transition at the individual company level within public and private asset classes. As we set out on page 5, low-carbon sectors and companies have received a return uplift over the past five years and we believe they will to continue to do so, especially if the transition accelerates.
Yet, we believe a portfolio that only gets exposure to the transition through low-carbon sectors and companies could miss important investment opportunities. A decarbonized economy will require the transformation of companies across all sectors, including those with a high carbon intensity today, like utilities, transportation, and cement. See the chart. And those industries will need immense investment to transform those operations: estimates from the International Energy Agency (IEA) suggest up to US$ 32 trillion by 2030 in a fast transition. That capex will in turn increase demand for the materials and inputs needed to retrofit and renew buildings, power, and transportation systems.
So, investors can gain exposure to the transition not only through “already-green” assets, but also through assets of carbon-intensive companies with a credible transition plan or that act as enablers of the transition by supplying needed materials, equipment, and services for capital investments. Commodities are a prime example: demand for some critical minerals is expected to grow quickly as the transition progresses.
Investment needed in high-carbon sectors
Capex needs by 2030 and carbon intensity, by sector
Forward-looking estimates may not come to pass. Note: The chart shows the estimated capex needed across sectors by 2030 to be on track for achieving net-zero emissions by 2050. Orange bars represent sectors with a Scope 1+2 carbon intensity higher than the weighted average of the MSCI ACWI index, yellow bars represent sectors with a Scope 1+2 carbon intensity lower than this average, based on MSCI GHG data. (BlackRock Investment Institute estimates based on IEA and MSCI data, June 2022)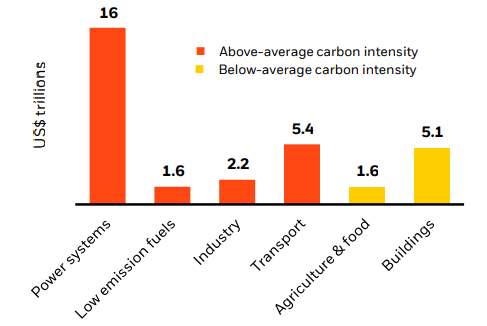
We believe companies well positioned to responsibly deliver these needed materials, while decarbonizing their processes, may be poised for robust returns.
As we discuss on page 5, it’s less clear today that carbon-intensive companies have been revalued according to how prepared they are for, and able to benefit from, the transition. As repricing progresses, we believe the return uplift our analysis revealed for “already-green” companies and sectors could broaden to these transitioning companies.
How can an investor judge if a carbon-intensive company is prepared for the transition? Currently, that’s still fairly difficult. Investors need forward-looking indicators like robust emissions targets and capex plans, as well as qualitative information on corporate strategy and governance. But a lack of disclosure and standardized reporting methods means investors do not have the data needed.
That is set to change. Investors and lenders are increasingly seeking this information to inform their decision-making. The growth of voluntary and mandatory reporting regimes around the world will provide more forward-looking data and metrics in the coming years, and BlackRock has consistently advocated for providing investors with high-quality, globally comparable, climate-related disclosures. We’re also investing in data and analytics to support client demand for transition insights.
Mitigating the impact of bumps
As explained in the preceding pages, we believe portfolios that include investments linked to the transition are likely to add returns over time as the transition accelerates and becomes more fully priced. Yet, as we’ve witnessed this past year, there are likely to be other periods when carbon-intensive sectors and assets outperform others, notably when there are mismatches between supply and demand. These mismatches could be a feature of the transition if high-carbon assets are reduced faster than low-carbon replacements are phased in (see page 4). So, during the transition, we believe a portfolio that excludes exposure to these sectors is unlikely to be as resilient to the expected “bumps in the road”.
Investing in companies that are carbon-intensive today can, in our view, be consistent with the transition. That can be because those companies have credible plans for decarbonization. These investments could help mitigate mismatches and provide exposure to the transition. For other companies, it could be because their outputs will still play a crucial role in the economy for some time, even on a very ambitious transition path. In the energy sector, for example, it would be nearly impossible to meet energy demand in the coming years without fossil fuels, absent dramatic tech innovation. And global energy demand is still increasing. The UN estimates the world’s population will rise by at least 20% by 2050. Even with improving energy efficiency in developed markets, global energy demand could rise significantly, especially if energy consumption in emerging markets jumps markedly as living standards improve. See the top chart.
Clean energy is expected to rise even faster: the IEA sees renewables growing by 3.5-5.7% to 2050 depending on transition speed (vs <1% annual growth in energy overall). Despite this rapid build-out, some investment will likely still be needed in new fossil fuel production capacity to meet energy demand: without capex, existing production generally declines. We believe the current investment is below what is needed to meet demand in the short run – largely because the oil and gas capex has dropped by nearly half since 2014. See the bottom chart.
Why this drop in investment? With high energy prices and strong cash flows, it’s not about access to finance. We believe it’s instead due to pandemic labor shortages, investor demand for fiscal discipline, and, most notably, concerns about demand. It’s clear that long-term demand for energy is robust, but long-term demand for fossil fuels is likely to decline as the transition progresses. If demand for fossil fuels erodes faster than expected, new carbon-intensive assets could be less profitable or even become stranded, i.e. prematurely stop earning an economic return. So, when getting exposure to carbon-intensive assets, investors need to balance the benefit of mitigating demand/supply mismatches in the transition against those return risks.
Global energy demand still growing
Change in energy consumption, 2020-2050
Forward-looking estimates may not come to pass. Notes: The chart shows IPCC and IEA scenarios for the average percentage change in global primary energy consumption between 2020 and 2050 under different transition speeds. Fast (orange bars) represents scenarios where global warming is limited to well below 2°C versus pre-industrial levels, medium-pace (yellow bars) represents where global warming is limited to around 2°C, consistent with current pledges. Slow (pink bars) represents expectations under current policies. (BlackRock Investment Institute, Intergovernmental Panel on Climate Change (IPCC) and International Energy Agency (IEA), June 2022)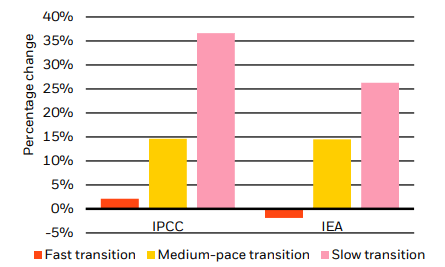
Oil and gas investment declining
Capex expenditure in oil and gas, 2010-2025
Forward-looking estimates may not come to pass. Notes: The chart shows capex expenditure in the oil and gas sector from 2010 to 2015 and from 2015-2020, as well as projected capex expenditure for the period 2020-2025. (BlackRock Investment Institute, Wood Mackenzie, June 2022)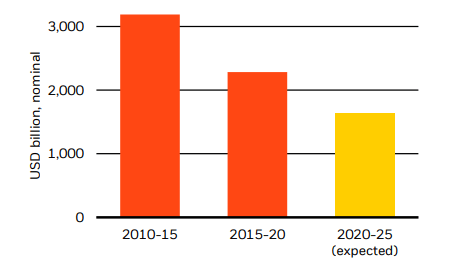
To stay ahead of these risks, particularly for long-term projects, investors need to maintain a continued dialog with companies. BlackRock does that on behalf of its clients. We take a long-term perspective in our engagement with companies and, where authorized by our clients, in shareholder voting. When it comes to carbon-intensive companies, we seek to understand how they are balancing short-term investment with a long-term outlook toward the energy transition, particularly where investments and capital allocation primarily increase dependence on fossil fuels. We also pay attention to how they are positioned for a low-carbon future, including the role they expect to play in contributing to the reliable, affordable supply of energy.
This post originally appeared on the iShares Market Insights
Editor’s Note: The summary bullets for this article were chosen by Seeking Alpha editors.
Be the first to comment