Nopadol Uengbunchoo/iStock via Getty Images
Adverse macroeconomic scenario, investor fear and a coming recession are the main reasons why T. Rowe Price Group, Inc. (NASDAQ:TROW) has plummeted 58% from its all-time high. However, the soundness of this company is beyond question, which is why after such a steep collapse I believe it is one of the best bargains around, especially for those interested in dividends.
Revenues growing over the long term
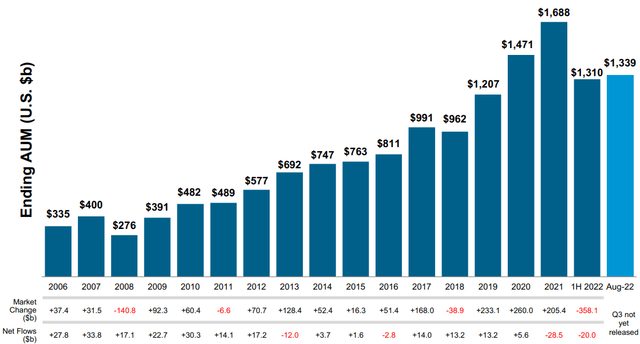
From an income perspective, it has been decades that T. Rowe Price has been steadily increasing its revenues, and it is possible because of the solid business model. This company earns fees calculated on AUM (Assets Under Management), which means that the more funds it manages, the more revenue it earns.
As we can see, AUM is rising sharply from a long-term perspective; however, it should be pointed out that in the short term there can be unusually positive or negative fluctuations. These unexpected short-term fluctuations in AUM depend mainly on what the sentiment is about the financial markets and the global economy. This means that when there is euphoria in the financial markets, T. Rowe Price will see a sharp increase in its AUM and consequently in its revenues. On the other hand, when there is negative sentiment about the global economy, AUM tends to decrease, as some clients fear losing money through their investments and prefer to stay liquid.
In the past, some examples of these atypical phenomena are the 2008 crisis and the post-pandemic speculative bubble. In the former case, there was a massive withdrawal of capital resulting in a sharp drop in AUM; in the latter, a sharp rise due to people’s willingness to ride one of the most remarkable bull markets in history. Although these are two opposite situations, there is one thing they have in common: after a phase of excessive pessimism/optimism there always follows one of normalization.
Having made this general observation based on examples from the past, it is necessary to contextualize what has been said to the present. Reflecting again on the previous image, it is clear that the first half of 2022 was definitely not an optimal period for AUM, although there is a slight sign of growth in the second half. War, inflation, supply chain, and tight monetary policy have conveyed negative sentiment related to global economic growth, and as has happened in the past during bearish phases, T. Rowe Price clients for multiple reasons are withdrawing their funds favoring liquidity.
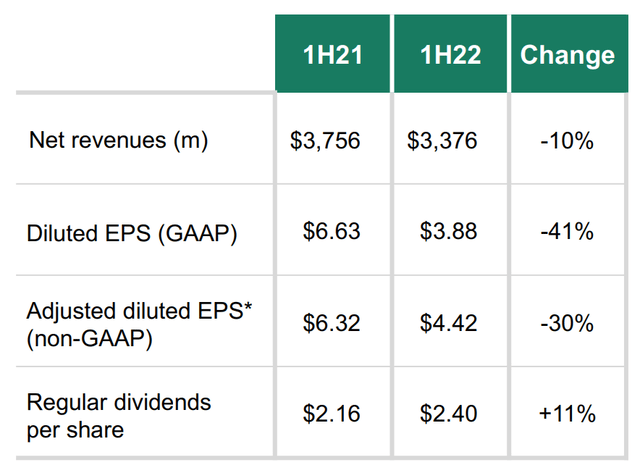
Lower AUM leads to worse earnings; in fact, compared to the first half of last year, revenues have decreased by 10% and EPS by as much as 41%. The current situation looks like a disaster, but then why am I not worried and still buying T. Rowe Price? I believe that in the long run the current economic instability may normalize as it did during all previous recessions experienced.
Anticipated TROW Q3 2022 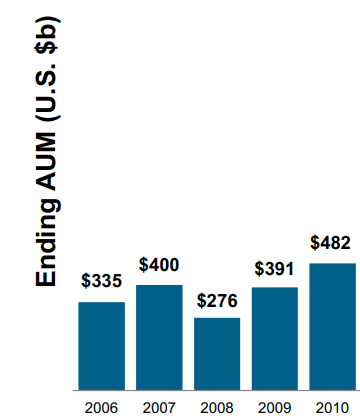
During the most severe financial crisis since 1929, T. Rowe Price’s AUM plummeted 31%, but just over 1 year later there was a full recovery. Currently (H1 22), since the 2021 high, AUM has experienced a 22.30% reduction. How much further AUM will fall (assuming it does fall) I can’t know, but I personally believe that the 31% threshold reached during the 2008 crisis may be very difficult to overcome. For those who believe that the current recession is even more severe than the 2008, then they might predict AUM estimates even more downward.
In any case, in addition to understanding how far AUM will collapse, it is crucial to understand when its recovery will begin. The collapse has already begun, but when will there be a recovery? In 2008 it took just over a year from the low; as of today, we may not have reached the low yet. However, this is no reason to be discouraged, and I will now show you why.
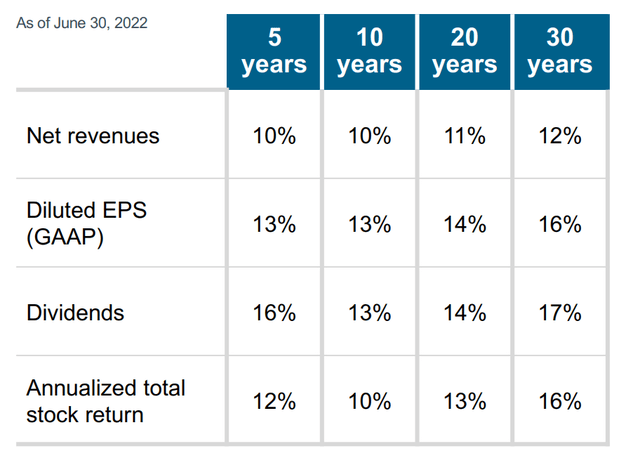
Over the long term, T. Rowe Price’s revenues and EPS have grown in double digits on any time frame from 5 years up to 30 years. The 2008 crisis was only a short-lived background noise, as annual growth over such large time frames remains high. As of today, I think a similar reasoning should be made: we are facing a momentary slowdown in revenues, but it will not affect T. Rowe Price’s future in 10 to 20 years. This company has been operating as an asset manager for decades, and the current recession is certainly neither the first nor the last one it has been through. The long-term trend suggests that AUM tends to increase, this also due to a generally longer duration of bullish markets than bearish ones.
Never been so undervalued since 2008
As discussed at length above, the revenues of this company depend mainly on how its AUM varies. Contrary to what one might think, the best time to buy T. Rowe Price is not during a bullish market, but during a bearish one. Buying this company when AUM is rising sharply may prove to be a mistake, because as solid as it is, it may no longer be at a discount at that point. During bearish phases, when AUM declines, the market often tends to discount an overly negative scenario, and that is exactly the right time to buy it. Notably, from 2006 to the present, every time T. Rowe Price’s AUM has declined, the company was at a deep discount. Except for the flash crash in 2020, this situation occurred only in 2008, 2018, and 2022.
- In 2008, AUM fell sharply, and T. Rowe Price hit the bottom after losing 71%. Back then, T. Rowe Price was not as financially sound as it is today, yet in the following 2 years it managed to recover what it lost in 2008 by achieving a performance of 250%.
- In 2018 AUM fell again, albeit by a small amount, and T. Rowe Price bottomed out after losing 34%. The recovery occurred in just over a year thanks to a 50% rise.
- In 2022, AUM plummeted rather sharply though not comparable to 2008, and T. Rowe Price plummeted 58%. I don’t have a crystal ball to know how this will turn out, but based on the past I have an idea.
My reasons for investing in this company, however, are not limited only to the considerations just made. The price multiples also support my bullish thesis as they are all at historical lows.
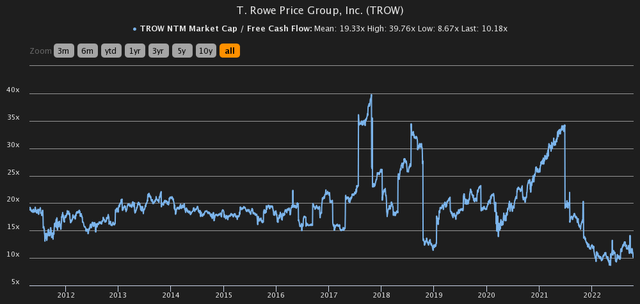
The NTM Market cap/ Free cash flow has reached levels not seen since 2012, testifying that the market is discounting an overly pessimistic scenario, even more than the downturn experienced in 2018.
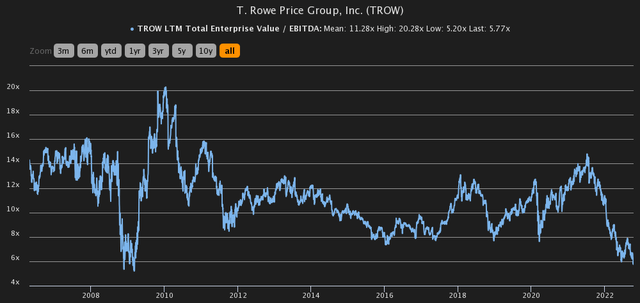
Looking at the current EV/EBITDA, it goes back to the great financial crisis such a low figure. This is not to say that it cannot continue to go down, but if we believe that T. Rowe Price can continue to grow as it has shown over the past decades, then this is an opportunity that may not come again anytime soon.
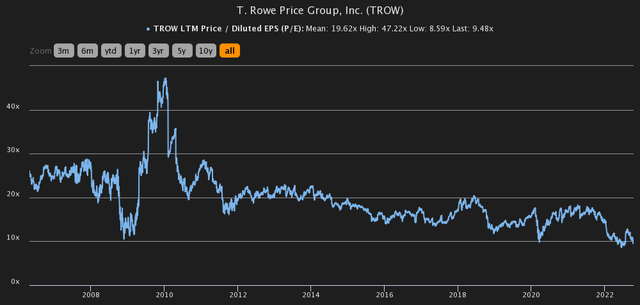
The P/E also shows a strong sign of undervaluation, and is even lower than it was in 2008. We are definitely in a phase of extreme pessimism, which is the best phase to buy solid companies like this.
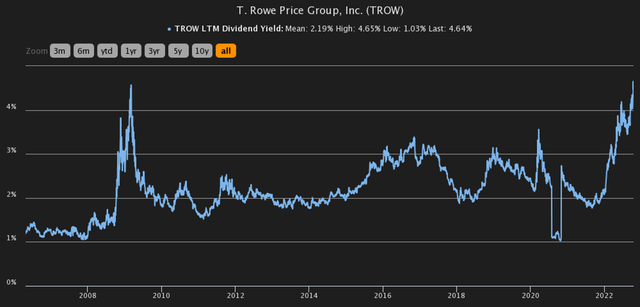
Finally, I want to show this graph to relate the current price and the dividend issued. Since 2006, the dividend yield has reached 4.64% only in 2008. All these valuation multiples have reached unjustifiable thresholds, since there is no reasonable argument to think that T. Rowe Price can stop growing in the future. The market is too pessimistic.
High and sustainable dividend
This section will discuss one of the main aspects of T. Rowe Price, its dividend. If you are a dividend-seeking investor, I recommend that you analyze this company in detail.
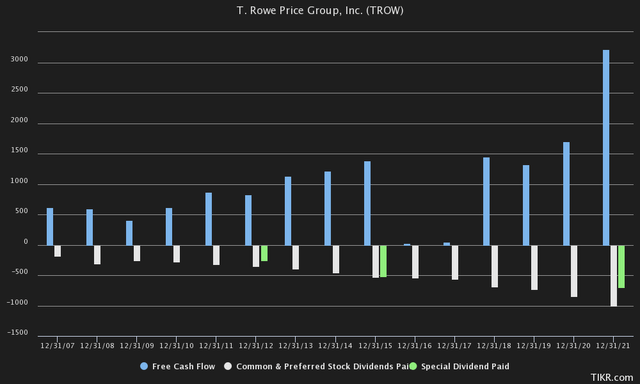
In this graph covering the 2007-2022 time frame, we find the relationship between free cash flow and dividends issued (ordinary and special), and we can draw some important conclusions:
- Free cash flow, just as we saw earlier with revenues, tends to increase rather quickly over the long run.
- The dividend issued, ordinary or special, is always largely covered by free cash flow.
- The dividend issued tends to grow steadily and rapidly. In the past 5 years it has seen an annual growth of 15.77%.
In light of these considerations, I cannot find a weakness in this dividend. It is broadly sustainable, exhibits rapid and steady growth. Moreover, as we have seen previously, the dividend yield is almost close to 5%, a figure seen only during the 2008 crisis. Often when we talk about dividends the first ones that come to mind are companies like Coca Cola (KO), Procter & Gamble (PG), or Pepsi (PEP), but I honestly wonder what T. Rowe Price has less than the latter in terms of dividend quality. With this I do not mean to disparage the companies mentioned, but I do want to point out that T. Rowe Price is unfairly underfollowed, and you can observe this even from the few followers here on Seeking Alpha.
Overall, my opinion in general about this company is more than positive, and currently my view is strongly bullish. I could be wrong, but I consider T. Rowe Price to be one of the best bargains around at this price. In this article I have covered only a few of the strengths concerning this company, but I assure you there are many more and I will make new articles about it in the future. This company is not only dividend and double-digit growth, but it has an LTM return on capital of 33.30%, an LTM free cash flow margin of 43%, negative net debt, and it continuously makes buybacks. For those who invest based on fundamental analysis, this company is a gem.


Be the first to comment