

J. Michael Jones
Earnings of Synovus Financial Corp (NYSE:SNV) will likely remain flattish this year before increasing next year. Higher provision expenses will likely drag earnings in 2022. On the other hand, management’s initiatives will drive loan growth, which will boost the bottom line. Earnings will also benefit from higher interest rates that will raise the margin. Overall, I’m expecting the company to report earnings of $4.86 per share for 2022, down by just 0.8% year-over-year. For 2023, I’m expecting earnings to grow by 4.3% to $5.07 per share. The year-end target price suggests a high upside from the current market price. Therefore, I am adopting a buy rating on Synovus Financial.
Initiatives to Act as a Catalyst for Loan Growth
Synovus Financial’s loan growth continued to remain strong in the second quarter of 2022, with loans increasing by 2.6%. The loan book has now grown at an annualized growth rate of over 8% consistently for the last three quarters.
A big catalyst for loan growth is the upcoming launch of Synovus’ Banking as a Service platform (“BaaS”) called Maast. (Side note: BaaS is a model that allows non-banks to offer financial services to their customers by integrating with banks.) As mentioned in the second quarter’s earnings presentation, the pilot for Maast is currently underway. The management hopes to launch this product in 2023.
Further, Synovus is planning to expand its team. As mentioned in the presentation, the company expects to hire 15 to 20 new corporate and investment banking team members by the end of 2022.
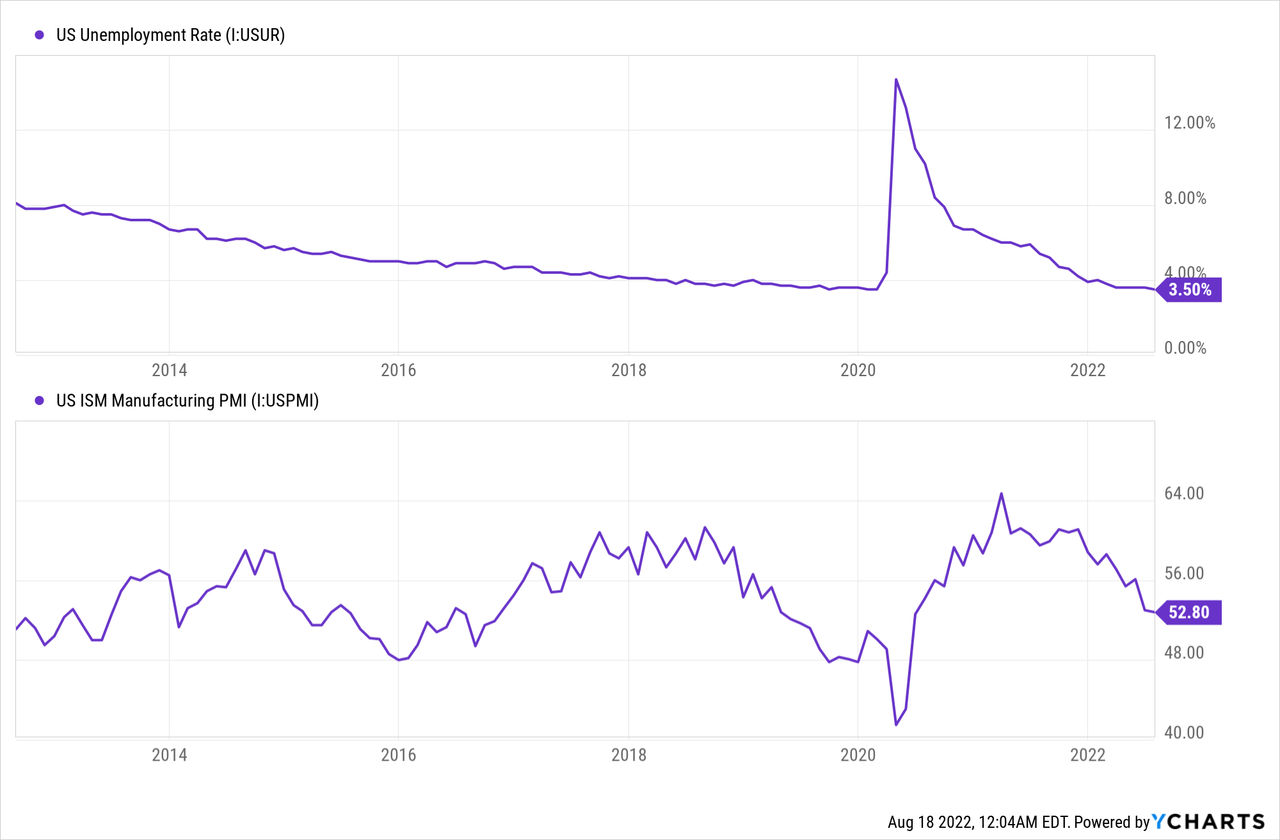
Strong job markets also bode well for loan growth. Additionally, despite recent declines, the purchasing managers’ index is still in expansionary territory (above 50).
The management mentioned in the second quarter’s conference call that it expects loan growth to be at or above the upper end of the previous guidance of 6% to 8%. Considering these factors, I’m expecting the loan book to grow by 4% in the second half of 2022, leading to full-year loan growth of 9%.
For 2023, I’m expecting loan growth to slow down from the 2022 levels. However, growth will likely remain above the historical average organic loan growth thanks to the upcoming BaaS platform.
Further Book Value Erosion Likely
Synovus has a substantial available-for-sale debt security portfolio, whose value has taken a hit from rising interest rates. Due to the accumulated unrealized losses on the portfolio, the equity book value has plunged this year. (Side note: unrealized losses on available-for-sale securities bypass the income statement and directly affect the equity account through other comprehensive income.) The tangible book value per share plunged to $24.52 per share by the end of June 2022 from $29.46 per share at the end of December 2021.
The equity book value will face further pressure in the third quarter because of the 75 basis points fed funds rate hike in July. Moreover, I’m expecting another 75 basis points hike in the remainder of the year before interest rates plateau. The following table shows my balance sheet estimates.
| FY18 | FY19 | FY20 | FY21 | FY22E | FY23E | |
| Financial Position | ||||||
| Net Loans | 25,696 | 36,881 | 37,647 | 38,884 | 42,445 | 45,050 |
| Growth of Net Loans | 4.7% | 43.5% | 2.1% | 3.3% | 9.2% | 6.1% |
| Other Earning Assets | 4,704 | 7,545 | 12,444 | 14,246 | 11,889 | 11,937 |
| Deposits | 26,720 | 38,406 | 46,692 | 49,427 | 50,020 | 52,051 |
| Borrowings and Sub-Debt | 2,545 | 4,073 | 1,438 | 1,468 | 2,474 | 2,575 |
| Common equity | 2,938 | 4,405 | 4,624 | 4,760 | 3,726 | 4,269 |
| Book Value Per Share ($) | 24.8 | 28.2 | 31.2 | 32.1 | 25.5 | 29.2 |
| Tangible BVPS ($) | 24.3 | 24.7 | 27.8 | 28.8 | 22.2 | 25.9 |
|
Source: SEC Filings, Author’s Estimates (In USD million unless otherwise specified) |
Highly Rate-Sensitive Loan Portfolio to Lift the Margin
A hefty 60% of the loan portfolio comprised of floating-rate loans at the end of June 2022, as mentioned in the earnings presentation. Therefore, the average earning-asset yield will remain highly responsive to interest rate hikes this year. Moreover, the deposit book is not very rate sensitive. In fact, Synovus’ total deposit beta was only 7% in June 2022, as mentioned in the presentation.
However, the margin will take a hit from the recent offering of 5.2% senior notes. According to my calculations, the offer will increase the average funding cost by around four basis points.
The results of the management’s interest rate sensitivity analysis given in the 10-Q filing show that a 200-basis point hike in interest rates could boost the net interest income by 11% over twelve months.
2Q 2022 10-Q Filing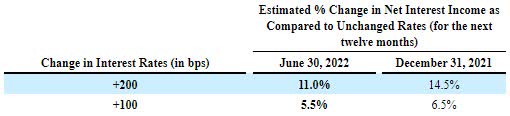
This model assumes an immediate increase in market rates. As the rate increase has been gradual in reality, the impact will be less than 11%.
Considering these factors, I’m expecting the margin to increase by 30 basis points in the second half of 2022 and by a further 10 basis points in early 2023. The margin expansion in 2023 will be attributed to a lagged effect of interest rate hikes in 2022. I’m not expecting the rising-rate cycle to extend beyond 2022.
Provisioning Normalization to Drag Earnings this Year
Synovus Financial released a large part of its loan loss reserves last year as the economy recovered faster than expected. The reserves are no longer excessive; therefore, provision reversals will likely remain at a normal level this year. Allowances made up 1.11% of total loans, while nonperforming loans made up 0.26% of total loans at the end of June 2022, as mentioned in the presentation. Therefore, the provisioning cover seems comfortable.
Overall, I’m expecting the net provision expense to make up around 0.25% of total loans (annualized) in the last two quarters of 2022 and full-year 2023. In comparison, the net provision expense averaged 0.24% of total loans from 2017 to 2019.
Expecting Flattish Earnings for 2022, Substantial Growth for 2023
Earnings will likely remain flattish in 2022 as higher provisioning will undermine loan growth. In 2023, however, earnings will likely trend upwards due to continued loan additions. Margin expansion will also play its part in boosting the bottom line. Overall, I’m expecting Synovus Financial to report earnings of $4.86 per share for 2022, down 0.8% year-over-year. For 2023, I’m expecting earnings to grow by 4% to $5.07 per share. The following table shows my income statement estimates.
| FY18 | FY19 | FY20 | FY21 | FY22E | FY23E | |
| Income Statement | ||||||
| Net interest income | 1,148 | 1,596 | 1,513 | 1,533 | 1,755 | 2,033 |
| Provision for loan losses | 52 | 88 | 355 | (106) | 80 | 112 |
| Non-interest income | 280 | 356 | 507 | 450 | 418 | 443 |
| Non-interest expense | 829 | 1,099 | 1,180 | 1,100 | 1,144 | 1,258 |
| Net income – Common Sh. | 410 | 541 | 341 | 727 | 711 | 741 |
| EPS – Diluted ($) | 3.47 | 3.47 | 2.30 | 4.90 | 4.86 | 5.07 |
|
Source: SEC Filings, Author’s Estimates (In USD million unless otherwise specified) |
Actual earnings may differ materially from estimates because of the risks and uncertainties related to inflation, and consequently the timing and magnitude of interest rate hikes. Further, a stronger or longer-than-anticipated recession can increase the provisioning for expected loan losses beyond my estimates.
High Total Expected Return Justifies a Buy Rating
Synovus Financial is offering a dividend yield of 3.1% at the current quarterly dividend rate of $0.34 per share. The earnings and dividend estimates suggest a payout ratio of 27% for 2023, which is below the five-year average of 35%. Although there is room for a dividend hike, I’m not assuming any change in the dividend level in 2023 to remain on the safe side.
I’m using the historical price-to-tangible book (“P/TB”) and price-to-earnings (“P/E”) multiples to value Synovus Financial. The stock has traded at an average P/TB ratio of 1.56 in the past, as shown below.
| FY17 | FY18 | FY19 | FY20 | FY21 | Average | |
| T. Book Value per Share ($) | 22.7 | 24.3 | 24.7 | 27.8 | 28.8 | |
| Average Market Price ($) | 43.6 | 48.0 | 36.0 | 24.9 | 44.6 | |
| Historical P/TB | 1.92x | 1.98x | 1.46x | 0.90x | 1.55x | 1.56x |
| Source: Company Financials, Yahoo Finance, Author’s Estimates | ||||||
Multiplying the average P/TB multiple with the forecast tangible book value per share of $22.2 gives a target price of $34.6 for the end of 2022. This price target implies a 20.6% downside from the August 17 closing price. The following table shows the sensitivity of the target price to the P/TB ratio.
| P/TB Multiple | 1.36x | 1.46x | 1.56x | 1.66x | 1.76x |
| TBVPS – Dec 2022 ($) | 22.2 | 22.2 | 22.2 | 22.2 | 22.2 |
| Target Price ($) | 30.2 | 32.4 | 34.6 | 36.8 | 39.0 |
| Market Price ($) | 43.6 | 43.6 | 43.6 | 43.6 | 43.6 |
| Upside/(Downside) | (30.8)% | (25.7)% | (20.6)% | (15.6)% | (10.5)% |
| Source: Author’s Estimates |
The stock has traded at an average P/E ratio of around 12.8x in the past, as shown below.
| FY17 | FY18 | FY19 | FY20 | FY21 | Average | |
| Earnings per Share ($) | 2.2 | 3.5 | 3.5 | 2.3 | 4.9 | |
| Average Market Price ($) | 43.6 | 48.0 | 36.0 | 24.9 | 44.6 | |
| Historical P/E | 20.1x | 13.8x | 10.4x | 10.8x | 9.1x | 12.8x |
| Source: Company Financials, Yahoo Finance, Author’s Estimates | ||||||
Multiplying the average P/E multiple with the forecast earnings per share of $4.86 gives a target price of $62.4 for the end of 2022. This price target implies a 43.2% upside from the August 17 closing price. The following table shows the sensitivity of the target price to the P/E ratio.
| P/E Multiple | 10.8x | 11.8x | 12.8x | 13.8x | 14.8x |
| EPS 2022 ($) | 4.86 | 4.86 | 4.86 | 4.86 | 4.86 |
| Target Price ($) | 52.7 | 57.6 | 62.4 | 67.3 | 72.1 |
| Market Price ($) | 43.6 | 43.6 | 43.6 | 43.6 | 43.6 |
| Upside/(Downside) | 20.9% | 32.0% | 43.2% | 54.3% | 65.5% |
| Source: Author’s Estimates |
Equally weighting the target prices from the two valuation methods gives a combined target price of $48.5, which implies an 11.3% upside from the current market price. Adding the forward dividend yield gives a total expected return of 14.4%. Hence, I’m adopting a buy rating on Synovus Financial.
Be the first to comment