

bymuratdeniz
Investment Summary
Nothing’s changed in my view for Syneos Health, Inc. (NASDAQ:NASDAQ:SYNH) following its Q3 numbers and my previous analysis, where I noted macro-headwinds, with valuations to be unsupportive looking ahead. The outlook remains damp, and in my estimation the market has reacted accordingly to the company’s narrowed FY22 guidance at the top and bottom lines last week.
This is a stock that did basically nothing for equity portfolios in the FY 2015–March FY 2020 period, before riding the back of the beta-related gains of the past 2–3 years, reaching all-time highs in FY21.
Following the broad market selloff in FY21, investors sold SYNH shares en masse, leading to a 65% loss this YTD. The stock has re-rated to trade at just 12.5x forward earnings. Whilst the (SPX) has bounced from a double-bottom in October, SYNH collapsed following its Q3 earnings miss. It now demonstrates substantial counter-weakness to the benchmark.
Alas, the SYNH share price has now broken its pandemic lows and trades in its deepest trench since listing in FY14′, as noted in Exhibit 1. Questions on whether this presents as a buying opportunity or not immediately arise, but in my estimation, there’s a lack of flesh to put on the skeleton here. With shares trading in-line with our $32 valuation, a lack of upside to capture and heightened systematic risk have us neutral on this name. Rate hold.
Exhibit 1. SYNH share price evolution: now busted through pandemic lows, trading at deepest point since listing
Data: Updata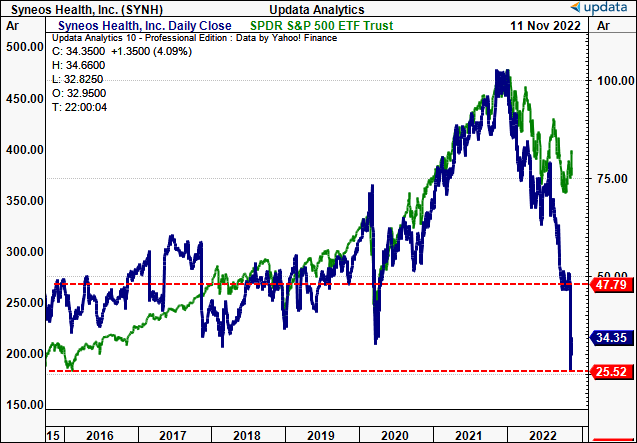
Q3 numbers indicate high probability of further punishment
SYNH’s Q3 numbers illustrate substantial market headwinds on the horizon, in my estimation. Investors are flocking to factors of quality in late FY22 and are re-positioning against names that offer upside at the bottom line. For SYNH, this isn’t the case looking ahead.
Management were equally as pessimistic from the company’s results. Per CEO Michelle Keefe on the Q3 earnings call:
“I am disappointed to share that Syneos Health experienced more significant headwinds in net awards, revenue and margins than anticipated during the third quarter producing results that were well below our expectations and frankly unacceptable.”
Turning to the P&L, third quarter revenue tightened 70bps YoY to $1.34 Billion (“Bn”). This also missed consensus estimates. Notably, there was a 750bps headwind from reimbursable expenses in SYNH’s clinical solutions business, itself down 350bps YoY to $1Bn in turnover.
Meanwhile, revenue from SYNH’s commercial solutions business grew 800bps YoY to $333mm. Growth in the division stemmed from strength in the Syneos One portfolio, and conversely benefited from a 380bps tailwind from reimbursement expenses. This pulled down to a net margin of 6.5% and average quarterly ROE of 8.6%. With shares trading at 1x book value, investors realize this same ROE as well.
The printed numbers align with longer-term growth trends SYNH has exhibited since even before the pandemic. As seen in Exhibit 2, showing the company’s YoY delta from the top–bottom line, there’s been a wind-back in quarterly turnover in particular. Revenue upside has slowed and remains in-line with FY18 growth rates, whereas EPS and net-cash flow growth is equally as tight.
With the pullback in operating trends for SYNH, future earnings growth is unappealing. This will likely to lead to further punishment until SYNH can demonstrate otherwise, in my estimation.
Exhibit 2. SYNH Operating trends showing slowdown from longer-term averages
Data: HB Insights, SYNH SEC Filings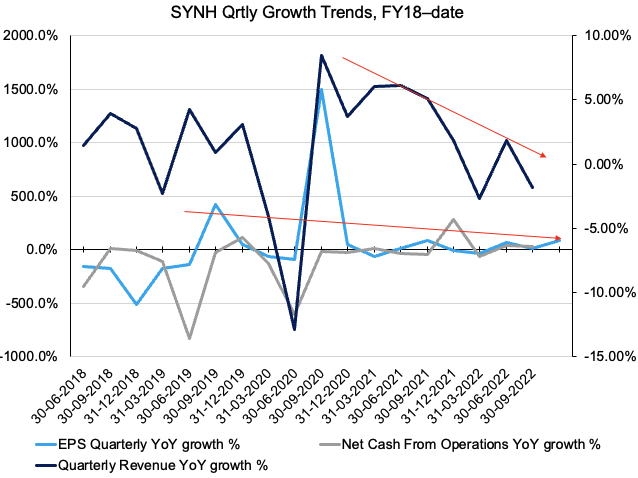
The company’s cost of equity capital has increased substantially in FY22 and now rests at multi-year highs of 9.24%. A debt cost of 3.71% weighted at 44% in the capital structure sets a WACC hurdle of 6.79%, down fromQ3 FY22. As seen in Exhibit 3, this is the highest range of discount rate SYNH has faced in years. This has a pronounced effect to SYNH’s return on invested capital (“ROIC”), both date and down the line
Moving onto Exhibit 4, the surging cost of capital has made it increasingly difficult for SYNH to generate economic value added. The economic profit curve [ROIC minus WACC hurdle] inverted in Q2 FY21, and has continued to slope downwards since. It came in at a negative spread of c.500bps last quarter with TTM ROIC pulling into just 5.5%, below the WACC number of 10.1%. It now rests at a -129bps spread. As such, it appears increasingly difficult for SYNH to generate additional value above its cost of capital looking ahead.
Exhibit 3. Rising cost of capital as policy rates re-base to multi-year highs, resulting in abnormally high WACC for SYNH
- SYNH WACC, Jan FY20’–date
Data: Alpha Spread, SYNH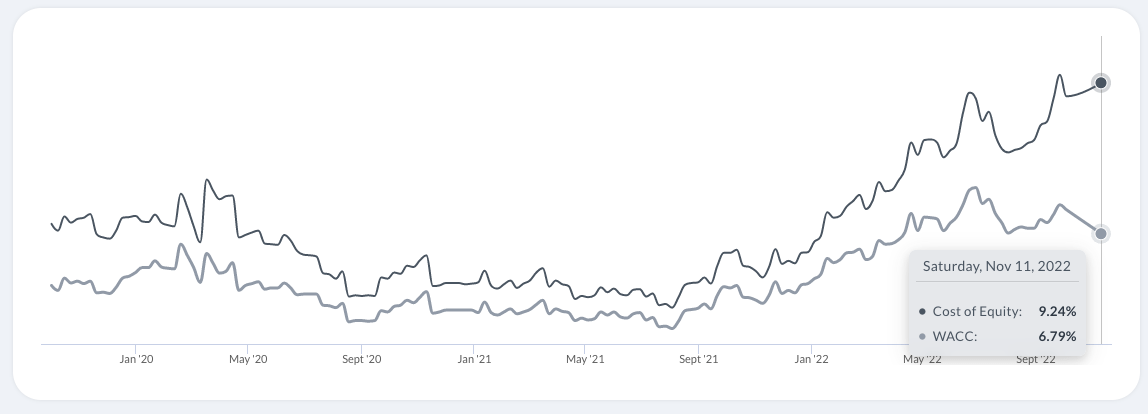
Exhibit 4. Rising cost of capital leading to increasing difficulty of SYNH to generate economic value added down the line
Data: HB Insights, SYNH SEC Filings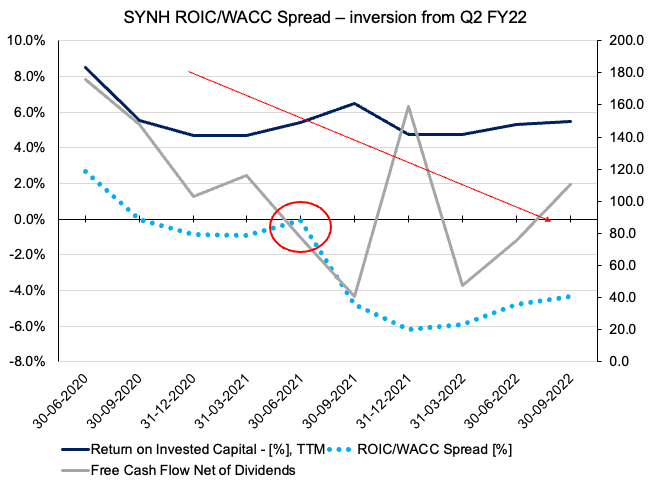
Market data unsupportive of turnaround in the near term for SYNH
As seen in Exhibit 5 [showing weekly bars], SYNH has remained in a 44-week-long down trend that began in FY21, when prices crossed beneath the 50DMA and 250DMA. This coincided with the start of the FY22 bear market in broad equities. The stock has attempted to base up on 3 occasions since and stabilize, however, each time has been met with poor volume into the move. The sideways price action with declining volume trend is resistance in my opinion.
Further, the market’s reaction to SYNH’s Q3 earnings miss is easily observed on the chart, as shares pushed below the 50DMA with authority last week.
Exhibit 5. 44-week long downtrend instigated following price cross with 50DMA and 250DMA
Data: HB Insights, Updata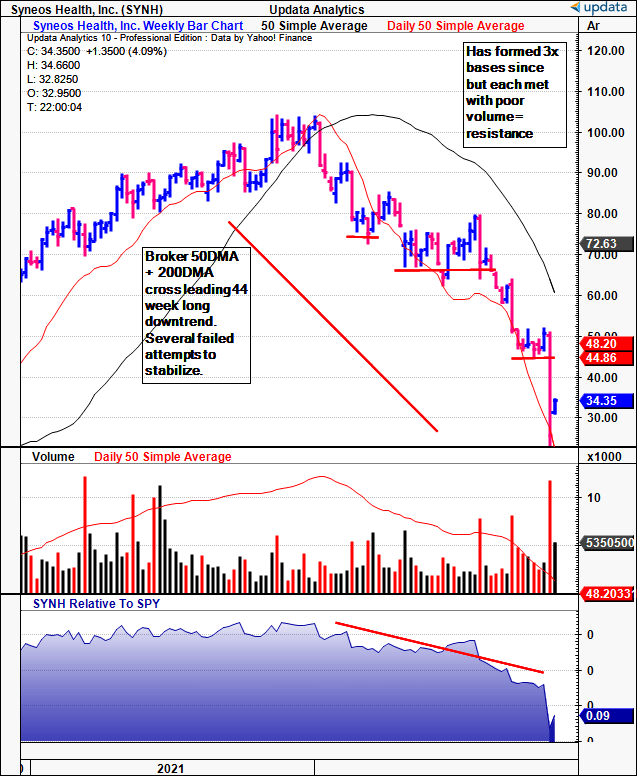
As a result, there are multiple downside targets derived from point-and-figure charting, as seen below. The price target of $37 has been taken out and we are now pressing to downside targets of $23.75
Exhibit 6. Multiple downside targets, pushing towards the downside objective of $23.75
Data: Updata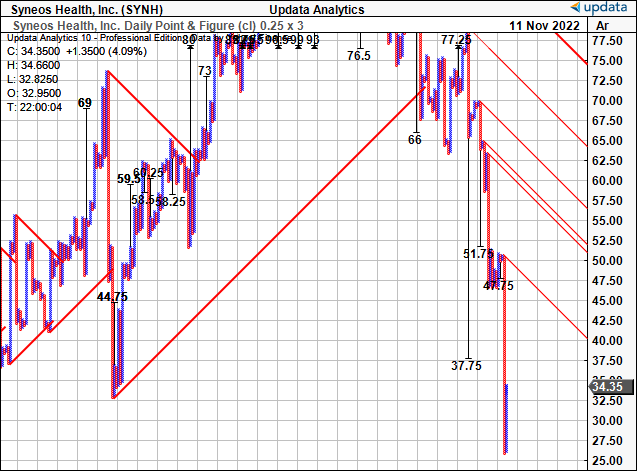
Fund ownership has also weakened substantially over the last 2 quarters to date. Institutional funds (ex-ETFs) increased exposure to SYNH by ~29% on average since Q2 FY22, hardly a suggestion of institutional momentum. There have been a couple of core-value funds that have increased exposure at the compressed multiples. This isn’t sustained across the board, with net accumulation of just 36,900 shares for the quarter, as noted in Exhibits 7 and 8.
Exhibit 7. Change in fund ownership [by the percentage of shares owned] not supportive of institutional momentum
Data: Refinitiv Eikon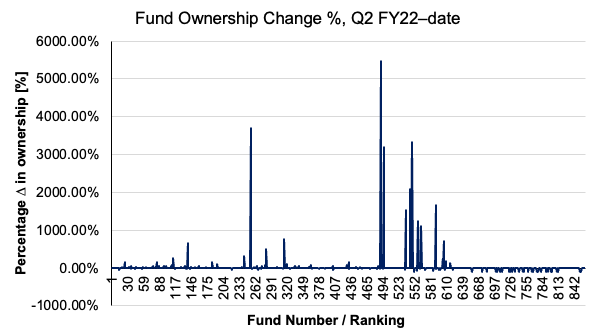
Exhibit 8. Net-accumulation also unsupportive
- SYNH Fund ownership, gross accumulation across all funds, Q2 FY22–date.
Data: Refinitiv Eikon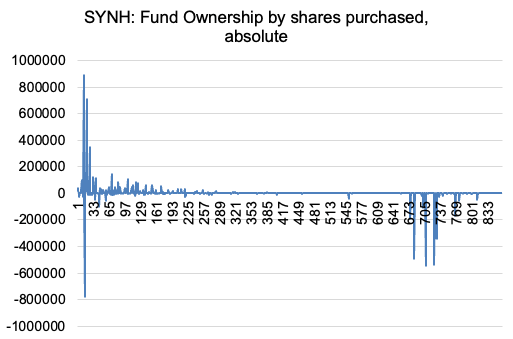
Valuation and conclusion
Consensus has priced SYNH at 13x FY22 GAAP earnings and 7.3x FY22 non-GAAP EPS. We’ve projected SYNH to print $2.59 per share in earnings for this year, a 6.8% decrease from the TTM. At these levels, SYNH has a TTM earnings yield of 8%, and investors are compensated with a 6.68% real equity risk premium for this cost. Net-net, I see SYNH fairly priced closed to 12.5x earnings, implying a price of $32. This would suggest SYNH either has further downside to come, or is at least fairly priced at its current levels.
Exhibit 9.
Data: HB Insights Estimates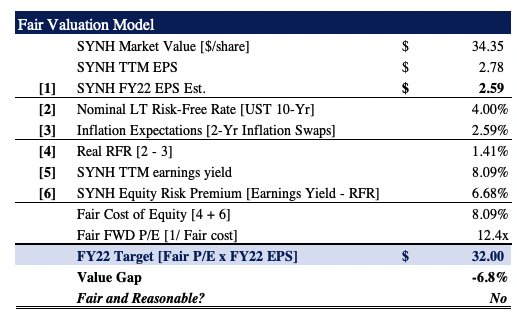
As a result there’s nothing of substance for SYNH to suggest a change in the investment debate. Net-net I continue to rate the stock a hold, without a directional view on the market. Syneos Health shares look appropriately priced following the latest selloff, however, there’s a lot of upside to capture in this name. Rate Syneos Health, Inc. a hold at $32.
Be the first to comment