

jetcityimage
A few months ago, I reviewed the Guggenheim Strategic Opportunities Fund (GOF). My overall impression of GOF was that it was paying a distribution yield that far exceeded the fund’s earnings power.
Recently, I came across GOF’s sibling fund, the Guggenheim Active Allocation Fund (NYSE:GUG). How does GUG compare to GOF?
Although GOF is marketed as an ‘opportunistic’ fund and GUG is marketed as an ‘asset allocation’ fund, going through the details, I find the two funds have very similar portfolio compositions and holdings. The key difference is that the GOF fund trades at a 20% premium to NAV while paying a 17.3% of NAV distribution while the GUG fund trades at a 14% discount to NAV while paying a 9.1% of NAV distribution.
GOF investors may wish to sell the ‘expensive’ GOF fund and switch into the ‘discounted’ GUG fund, as I estimate there is less risk of a distribution cut for GUG.
Fund Overview
The Guggenheim Active Allocation Fund (“GUG”) is a closed-end fund focused on current income and capital appreciation. The GUG fund pursues an asset allocation strategy, allocating exposure to securities and asset classes with attractive risk/reward characteristics. The GUG fund has over $500 million in net assets and charges a 1.93% expense ratio.
Strategy
To achieve its investment objective, the GUG fund employs a dynamic asset allocation strategy, allocating the fund’s exposure to different asset classes that offer attractive risk/reward. Within an asset class, the fund also pursues a relative value strategy, utilizing quantitative and qualitative analysis to identify investment opportunities.
The fund combines a fixed-income portfolio with a diversified pool of alternative investments and equity strategies that the manager believes will outperform on an absolute basis.
The GUG fund also employs leverage to enhance returns. As of December 30, 2022, the fund had $198 million in leverage against $714 million in managed assets for 28% leverage.
Portfolio Holdings
Similar to the GOF fund I recently reviewed, the GUG fund resembles an open-ended credit hedge fund with its investment portfolio mostly invested in high yield bonds (52.6%), senior loans (29.8%), and equities (14.6%) (Figure 1). The GUG fund has a weighted average duration of 4.6 years.
Figure 1 – GUG portfolio composition (guggenheiminvestments.com)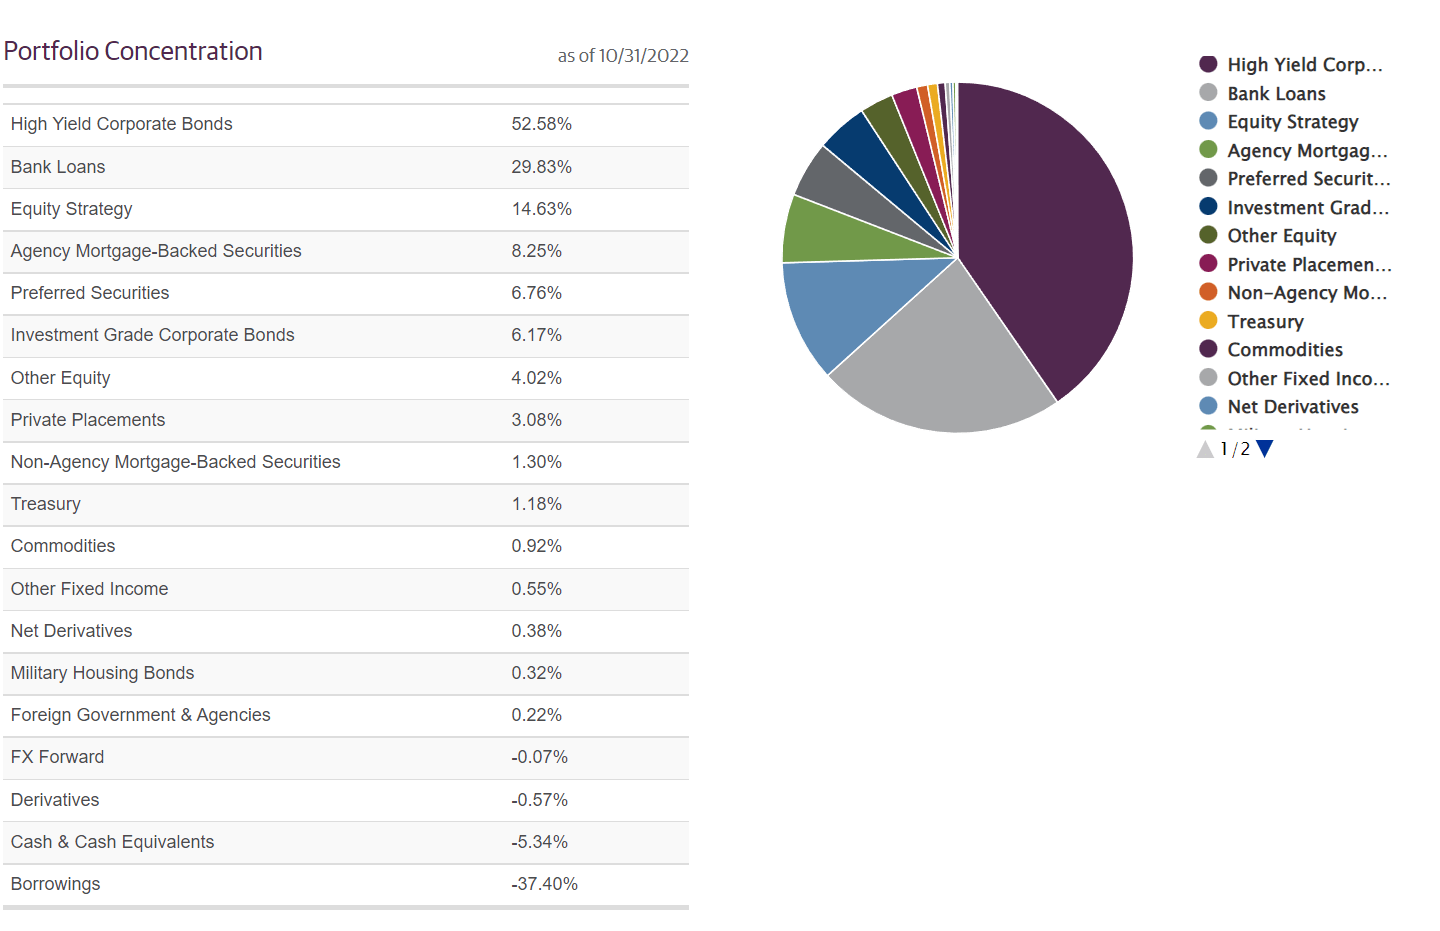
The fund’s asset allocation can vary quite a lot in between periods, as the high yield bond allocation was 46.7% in May 31, 2022 and the equity allocation was 33.1%.
Returns
The GUG has limited operating history, with an inception date of 11/23/2021. However, in its short history, the fund has not performed well, with a 1Yr NAV return of -13.0% to November 30, 2022.
Figure 2 – GUG fund returns (guggenheiminvestments.com)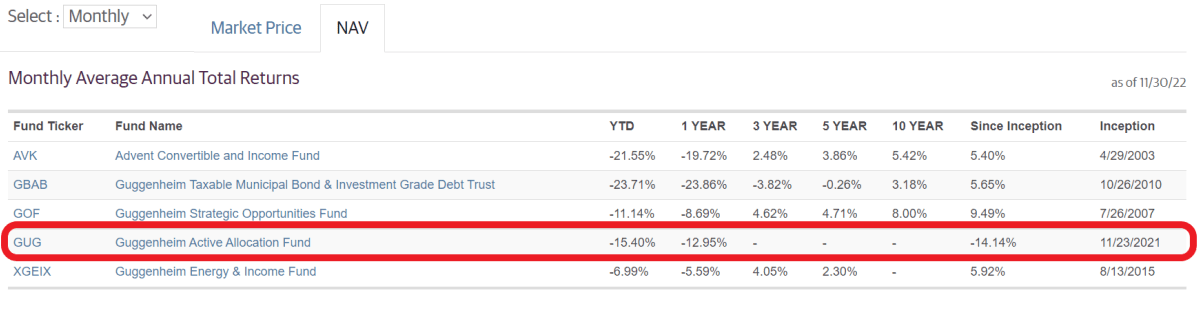
GUG’s poor performance can be partly explained by the fund’s heavy exposure to high yield bonds and equities. Both assets classes have suffered in 2022.
However, it is notable that the GUG fund appears to have underperformed its underlying asset classes. On a 1 Yr basis to November 30, 2022, the SPDR Bloomberg High Yield Bond ETF (JNK) returned -9.7%, the SPDR S&P 500 ETF Trust (SPY) returned -9.3%, and the Invesco Senior Loan ETF (BKLN) returned -1.3% respectively.
If we use the latest asset allocations from Figure 1 as a reference (covering 97% of net assets of GUG), one would expect the GUG fund to have returned -6.8% in the past year (Figure 3). Instead, the fund returned -13.0%. So the GUG fund must have experienced negative security selection and/or allocated to different asset classes at inopportune times to underperform by over 600 bps.
Figure 3 – Simple return decomposition for GUG (Author created with fund exposures from guggenheiminvestments and asset class returns from the various ETF fund websites)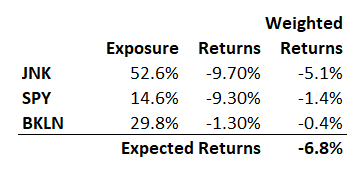
Distribution & Yield
The GUG fund pays a very high monthly distribution of $0.11875 or 10.6% current yield on market price. On NAV, the current yield is 9.1%.
At first glance, GUG’s distribution appears to be unsustainable in the long-run, as it is above the fund’s returns. Since inception, the fund’s NAV has declined from $20 to $15.63 currently, from a combination of negative investment performance (-14.1%) and paying out its high monthly distribution (Figure 4).
Figure 4 – GUG’s NAV has declined by 22% since inception (cefconnect.com)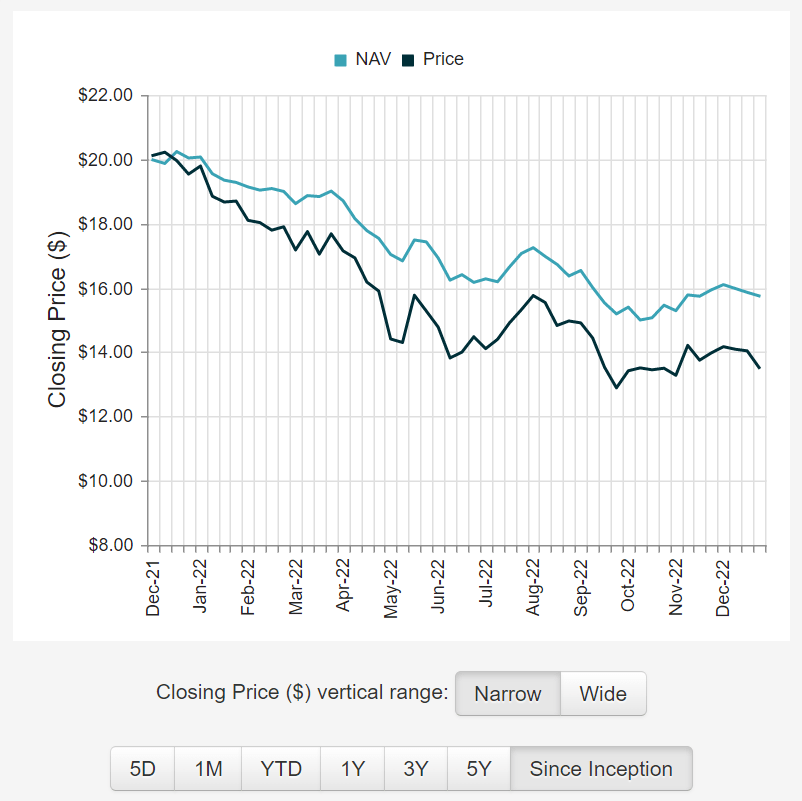
Going through the fund’s 19a notices, we can see that the GUG fund’s distribution has only been partially funded from net investment income (“NII”). The attribution to capital gains and return of capital have been as high as 100% for the November distribution.
The major problem with funding distributions through capital gains and return of capital is that as the NAV declines, there is less interest earning assets to support future distributions. Eventually, the fund is forced to cut its distribution and investors are left with a loss in both principal and income.
GUG vs. GOF
As mentioned above, the GUG fund is very similar in strategy and portfolio composition to the larger GOF fund. Figure 5 compares the two funds side-by-side.
Figure 5 – GUG vs. GOF (Author created with data from guggenheiminvestments.com)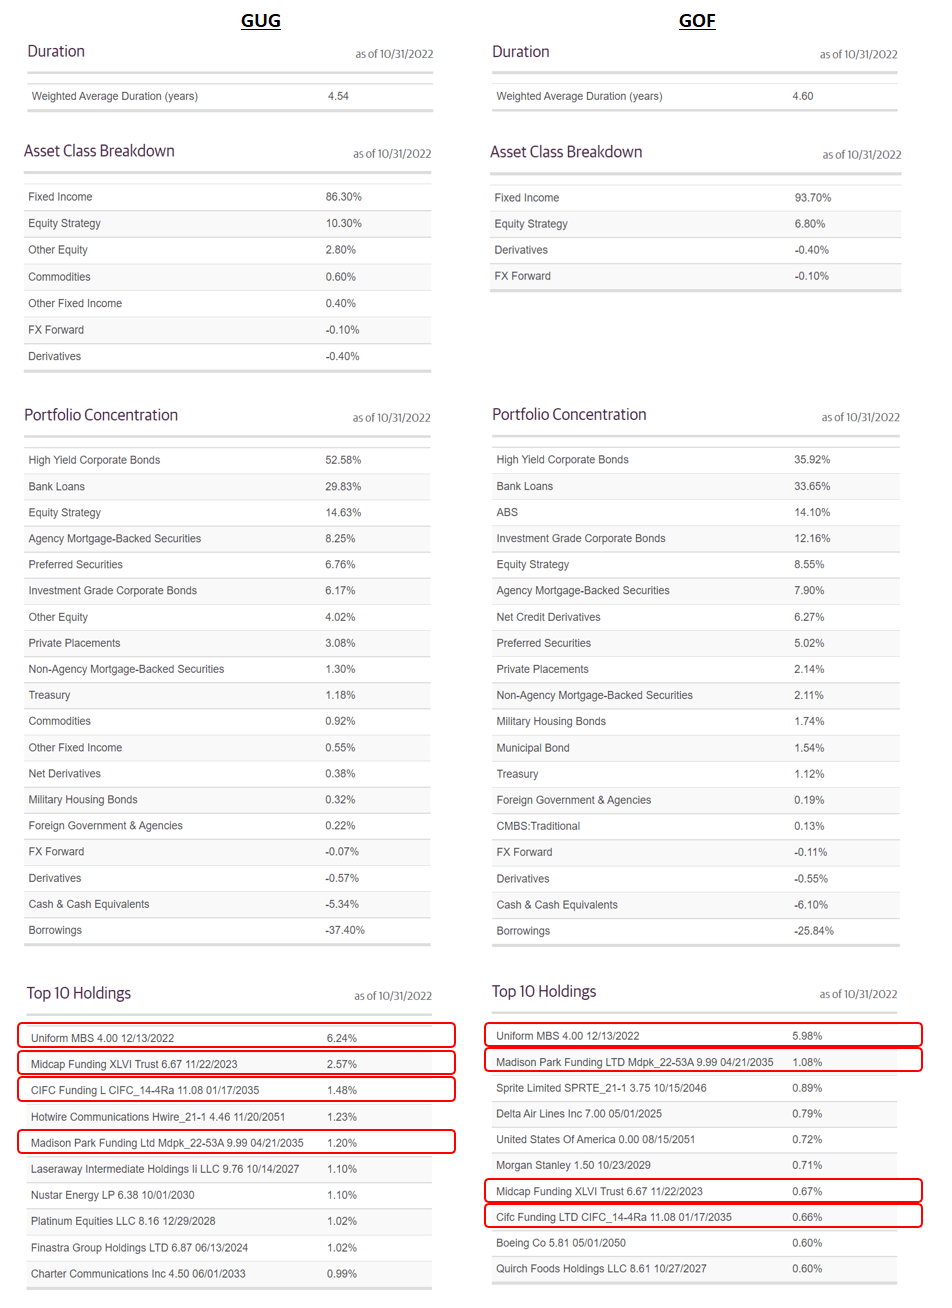
We can see that both funds have approximately the same average duration, as well as similar asset allocations (both are predominantly invested in high yield bonds and bank loans). There is also significant overlap in the top 10 positions.
In terms of NAV returns (from Figure 2 above), we can see the GOF fund has slightly outperformed, with a 1Yr return of -8.7% vs. -13.0% for GUG. However, what jumps out upon closer examination is the funds’ respective market price performance, with the GUG fund declining by 22.6% to November 30, 2022 vs. -0.8% for the GOF fund (Figure 6).
Figure 6 – GUG and GOF market price returns (guggenheiminvestments.com)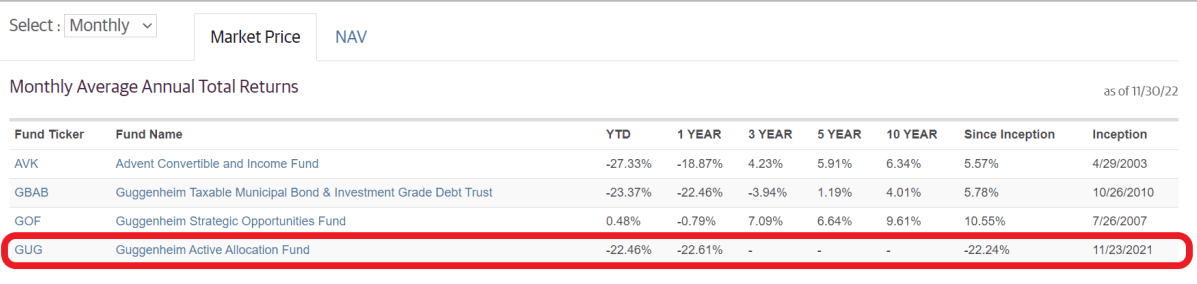
This creates an interesting dynamic where the GOF fund trades at a 20% premium to NAV while the GUG fund trades at a 14% discount (Figure 7).
Figure 7 – GUG trades at a 14% discount to NAV (cefconnect.com)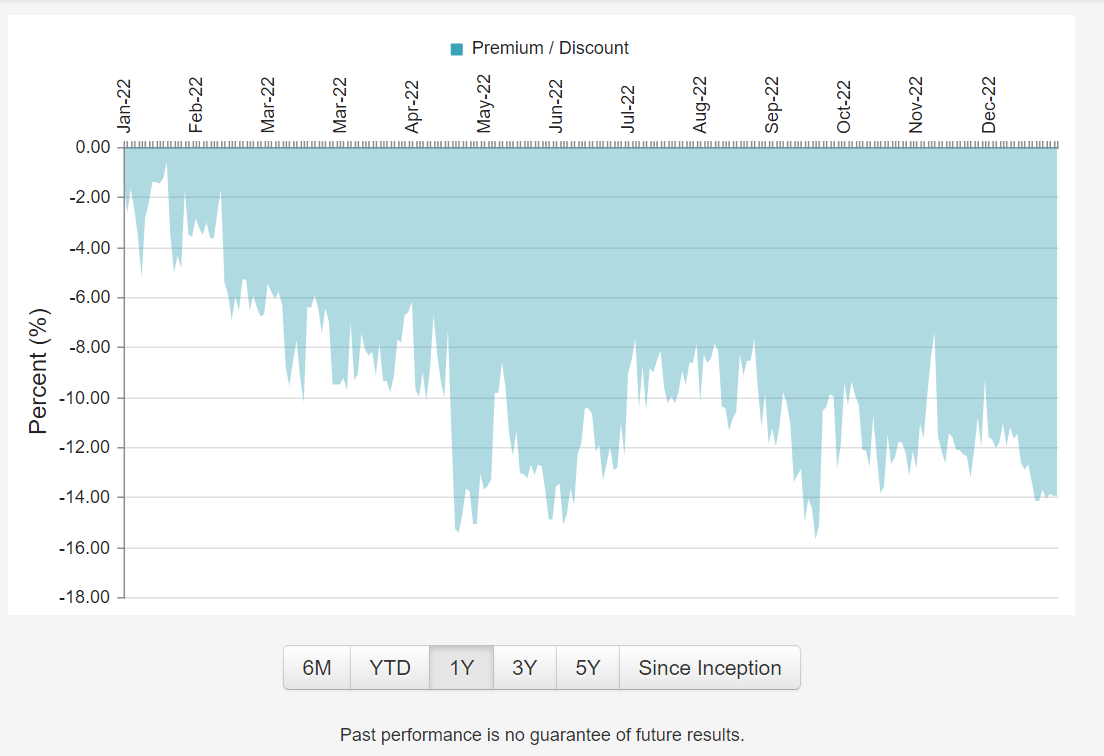
Since the investment portfolios are quite similar between the two funds, GOF investors may wish to switch out of the ‘expensive’ GOF fund and into the ‘discounted’ GUG fund.
Furthermore, if we compare the two funds’ distribution yields, I am much more concerned about GOF’s distribution, as the GOF fund pays a monthly distribution of $0.1821. This equates to a 14.4% current yield on market price or an eye-watering 17.3% yield on NAV. Notice that 17.3% is more than double the GOF fund’s 10-Yr average annual NAV return of 8.0% (from Figure 2). Clearly, this distribution rate is unsustainable in the long-run.
Conclusion
The Guggenheim Active Allocation Fund is a new CEF launched by Guggenheim Investments in late 2021. It employs a tactical asset allocation strategy to generate income and capital gains. Unfortunately, my analysis above indicates the GUG fund has underperformed a static allocation to high yield bonds, equities, and bank loans. This puts Guggenheim’s tactical asset allocation abilities into question.
Comparing between the GUG fund and the larger GOF fund, I find the two funds have very similar composition and returns. However, the GOF fund trades at a 20% premium to NAV while paying an unsustainable 17.3% of NAV distribution. In contrast, the GUG fund trades at a 14% discount to NAV while paying a 9.1% of NAV distribution.
GOF investors may wish to sell the ‘expensive’ GOF fund and switch into the ‘discounted’ GUG fund, as I estimate there is less risk of a distribution cut for GUG.
Be the first to comment