

Swiss Franc, USD/CHF, EUR/CHF, CHF/JPY, NZD/CHF – Talking Points
- USD/CHF gearing up for test of key trendline resistance following FOMC minutes
- EUR/CHF outlook remains skewed lower after “death cross” formation
- CHF/JPY continues to gyrate at resistance, support zone eyed below
- NZD/CHF weakness exacerbated by recent lockdowns in New Zealand
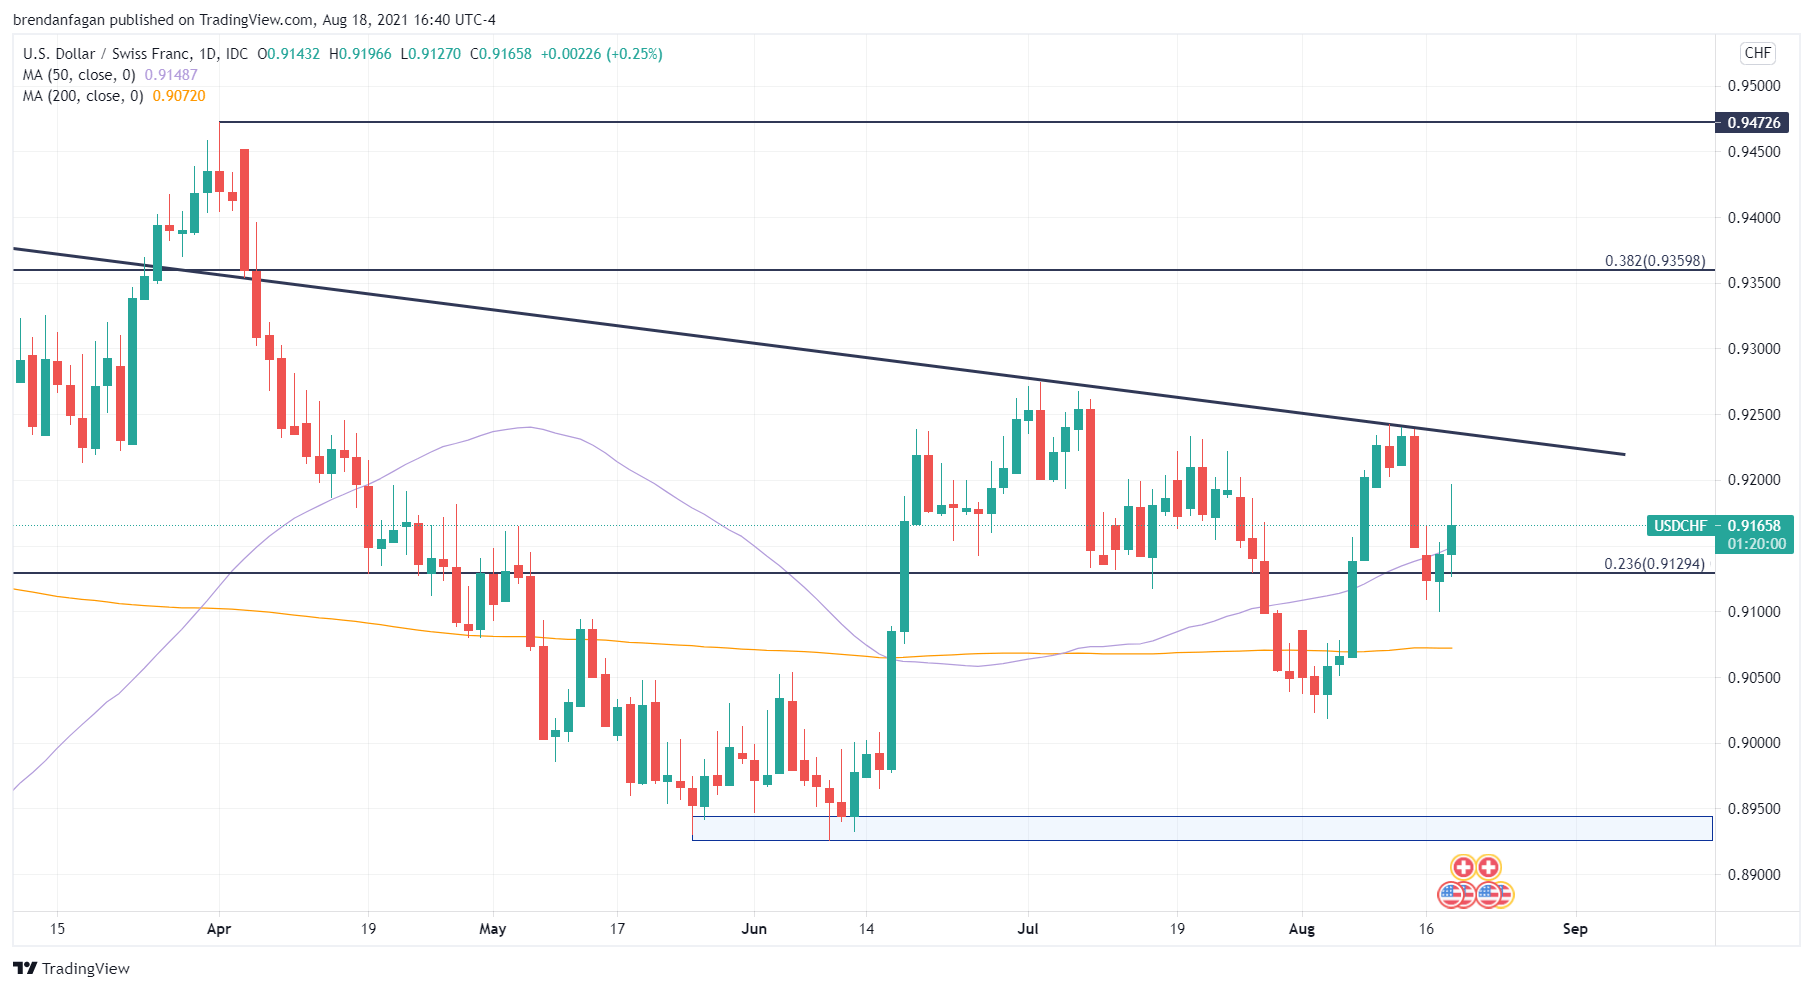
USD/CHF Technical Analysis
The US Dollar looks set to appreciate further against the Swiss Franc following the release of the FOMC meeting minutes on Wednesday. Should bulls remain in control of USD/CHF, a retest of a long-term descending trendline may be on the cards near 0.9320. Wednesday’s trade also saw the pair cross back above the 50-day moving average (MA), indicating the possibility that the upside may continue. Should US Treasury yields back-off in the face of additional weak data, support may be found at the 50-day MA, or the 0.236 Fibonacci retracement level at 0.9129.
USD/CHF Daily Chart
Chart created with TradingView
EUR/CHF Technical Analysis
Bears remain firmly in control of EUR/CHF, as the pair fell to a fresh new yearly low at 1.0701. The pair closed Tuesday’s trade at the bottom end of a descending regression channel dating back to the March high, before bouncing on Wednesday to the previous yearly low from January. The move lower to a fresh yearly trough is significant, as the pair broke below the support zone near 1.0750, a level that had held for 2021 up until August.
Further confirmation of the downtrend comes in the formation of a “death cross,” which is when a short-term moving average falls below a longer-term moving average. The 50-day MA fell below the 200-day MA on August 2. A divergence in policy between the Fed and European Central Bank may bring continued Euro weakness, which may trickle into Euro crosses outside of EUR/USD.
EUR/CHF Daily Chart
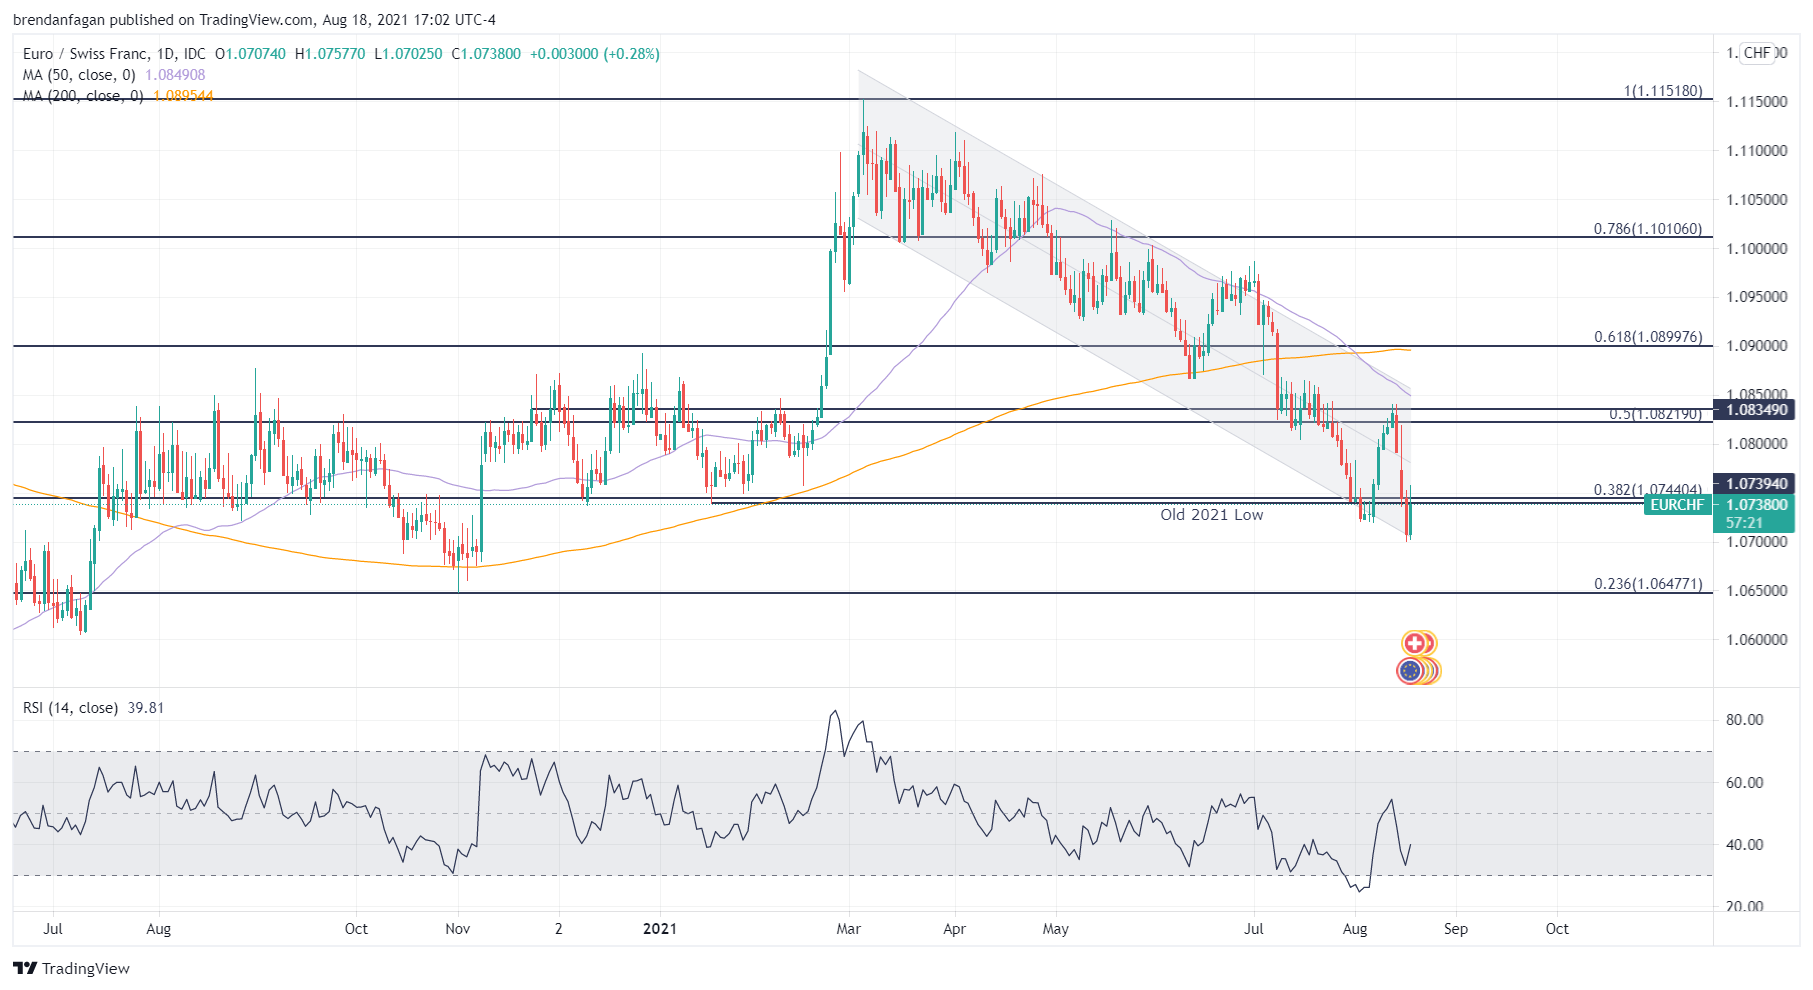
Chart created with TradingView
CHF/JPY Technical Analysis
CHF/JPY finds itself constrained by a former resistance level at 119.806, which dates back to late April. During the massive runup in the pair through the first half of 2021, multiple bull flags formed during the breakout. The most recent of which occurred at the aforementioned 119.806 level. The breakout from that last flag saw the pair trade up to 122.771, a level from which it has since retreated. A bounce in safe-haven assets surrounding the Fed’s June “hawkish surprise” initiated the pair’s move lower, from which it has not yet recovered.
The pair has gyrated for much of the last few months, with the occasional breakout retracing to an ascending trendline dating back to the August 2020 swing high. Upside momentum has stalled at a falling trendline from the yearly high, with two separate tests recently being rejected. With the pair struggling to retake resistance at 119.806, a test of the trendline below may be on the cards. A break of that trendline, which has not yet materialized over the course of this move lower, may bring the 200-day MA into play at 188.395.
CHF/JPY Daily Chart
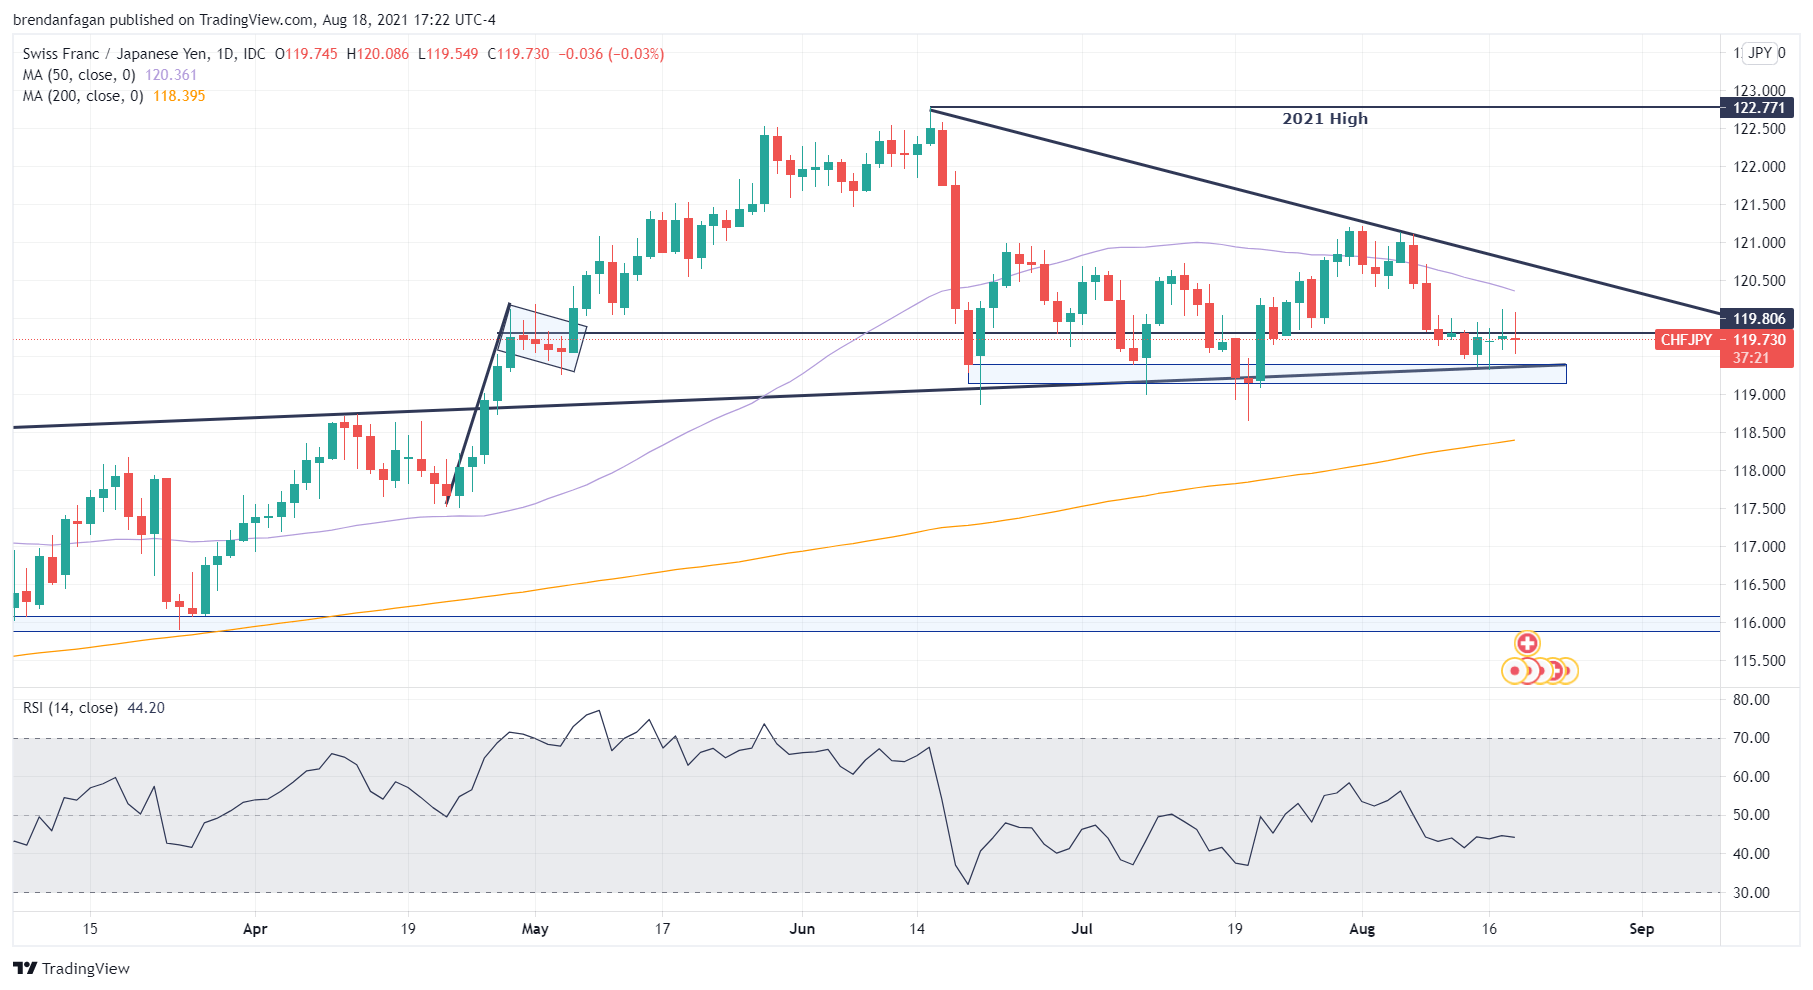
Chart created with TradingView
NZD/CHF Technical Analysis
The New Zealand Dollar continues to get slammed following the announcement that the entire country was entering “level 4” lockdown following the resurgence of Covid. No stranger to the party is the Swiss Franc, which has appreciated against the Kiwi for the last 5 sessions. Swiss Franc strength against the Kiwi has been present since March, with the pair trading within a descending channel since a fresh yearly high of 0.67669 was made on February 25. Since then, the Franc has been gaining steadily on its counterpart, chopping between the upper and lower bounds of the descending channel.
In just the last 5 sessions, the relative strength index (RSI) has fallen from 62.49 to 37.08, highlighting just how swiftly market participants have turned against the Kiwi. Should a break of the descending channel materialize, a test of the .236 retracement level at 0.62533 may be on the cards. A significant move lower may yet materialize, as the pair has not yet reached “oversold conditions.” Recent price action would suggest that any rips in the pair may fade, with most either failing at the mid-point or top end of the descending channel.
NZD/CHF Daily Chart
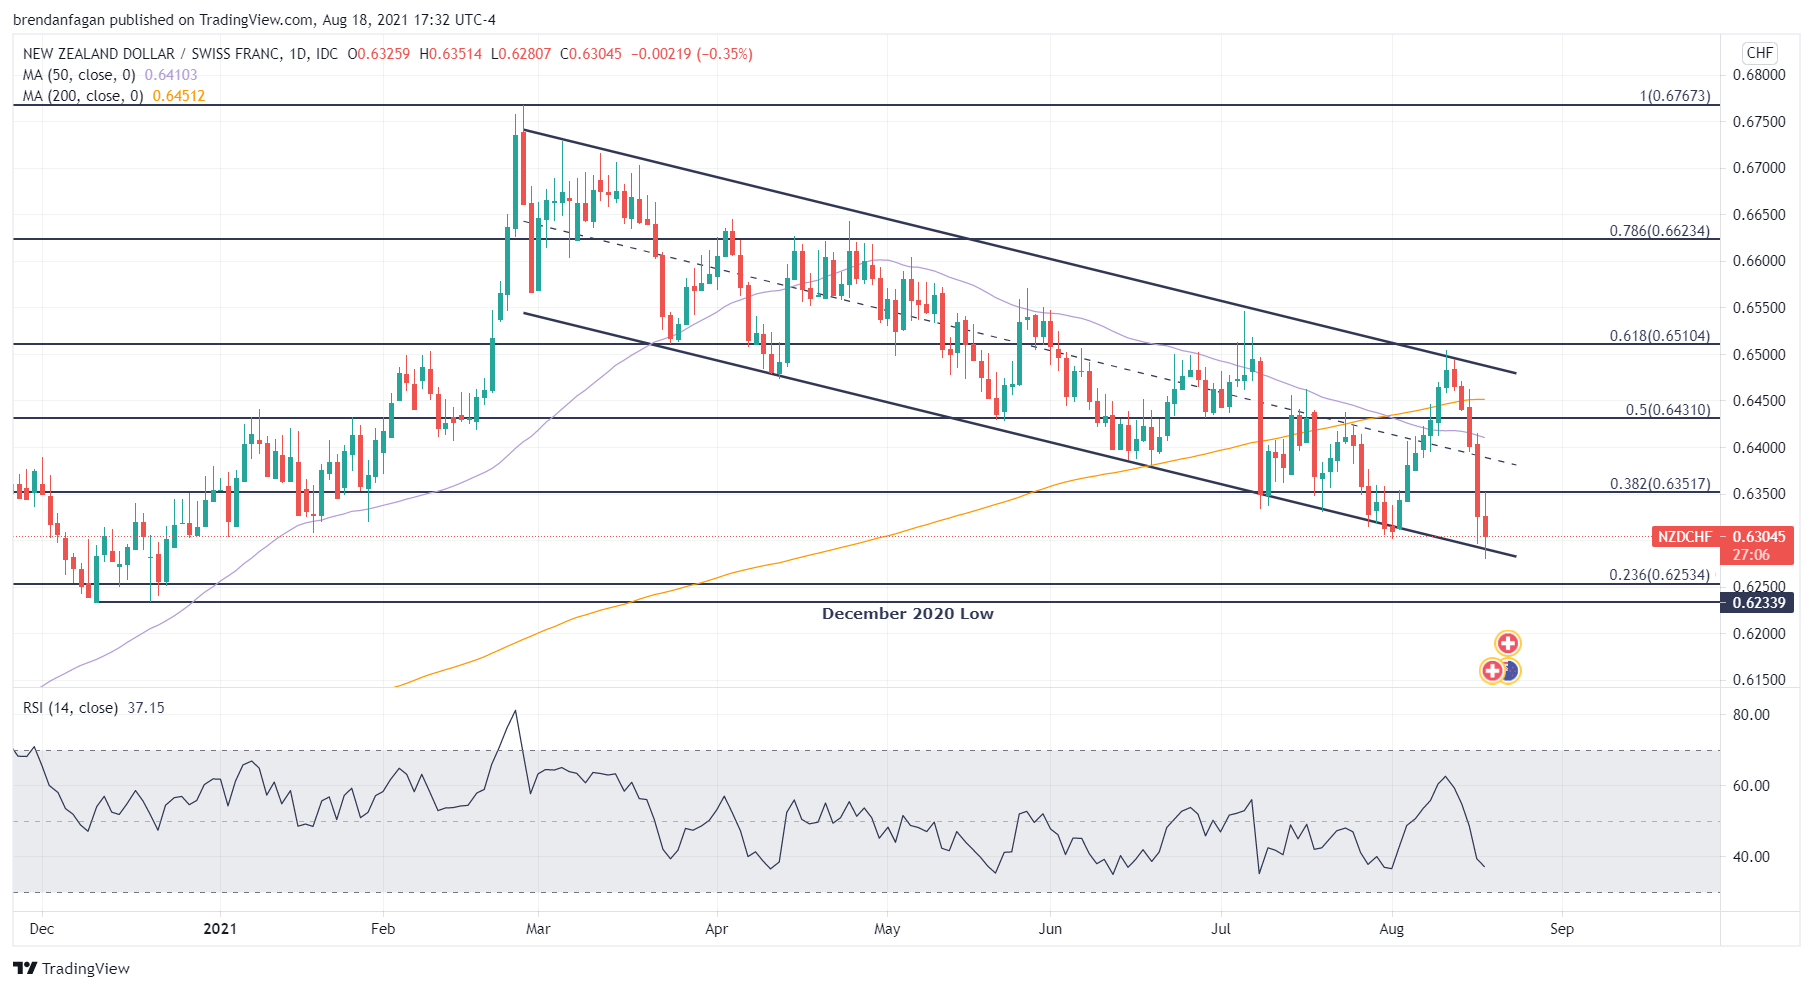
Chart created with TradingView
Resources for Forex Traders
Whether you are a new or experienced trader, we have several resources available to help you; indicator for tracking trader sentiment, quarterly trading forecasts, analytical and educational webinars held daily, trading guides to help you improve trading performance, and one specifically for those who are new to forex.
— Written by Brendan Fagan, Intern
To contact Brendan, use the comments section below or @BrendanFaganFX on Twitter
Be the first to comment