

Sundry Photography
Regional banks have surged to fresh relative highs versus the S&P 500 since March 2021. The SPDR S&P Regional Banking ETF (KRE) is down just 3% over the last six months compared to a dreadful 17% total return decline for the SPDR S&P 500 Trust ETF (SPY).
One of KRE’s largest holdings reports results Thursday evening next week, but it faces fundamental headwinds from a slowing tech sector.
Regional Banks On A Bullish Relative Run
Stockcharts.com
SVB Financial Group (NASDAQ:SIVB) is a financial holding company that serves companies in the technology, life science, venture capital, private equity, and premium wine industries. It offers diversified financial services such as commercial, investment, international and private banking. Headquartered in Santa Clara, California, SVB Financial Group operates through offices in the U.S. and international operations in China, India, Israel, and the United Kingdom.
The $19.8 billion market cap Banks industry company within the Financials sector trades at a low 13.4 trailing 12-month GAAP price-to-earnings ratio and does not pay a dividend, according to The Wall Street Journal.
The financial services firm has a decent balance sheet but operational exposure to the embattled innovation sector. There are downside risks around the macro situation and a further slowdown in the Information Technology sector. Moreover, a dearth of IPO activity is a headwind for SIVB shares.
On valuation, BofA analysts expect earnings to fall hard this year while Q3 should see strong year-over-year growth. A rebound is expected next year and in 2024 but much will depend on how the tech sector comes out from this economic downturn. While I am skeptical of what earnings will be, the Bloomberg consensus estimate is actually more bullish than BofA’s. So, the longer-term valuation picture looks good as both the operating and GAAP P/Es are seen as retreating. The stock is still not expected to pay a yield, however.
SIVB Earnings, Valuation, And Dividend Forecasts
BofA Global Research
Looking ahead, Wall Street Horizon’s corporate event data show a confirmed Q3 2022 earnings date of Thursday, October 20 after market close with a conference call later that evening. You can listen live here.
Corporate Event Calendar
Wall Street Horizon
The Options Angle
Data from Option Research & Technology Services (ORATS) show a consensus earnings forecast of $7.13 which would be a strong 41% climb from the same quarter a year ago. The firm also has a strong EPS beat rate history, topping analyst estimates in seven of the past nine instances, but the stock has fallen in two of the previous three earnings periods.
In terms of expected share price moves post-earnings, ORATS calculates the nearest-expiring at-the-money straddle as pricing in a 7.7% stock price swing after the report next Thursday. With overall market volatility running high, that’s the largest straddle percentage in at least three years.
SIVB: A Big Implied Stock Price Move Post-Earnings
ORATS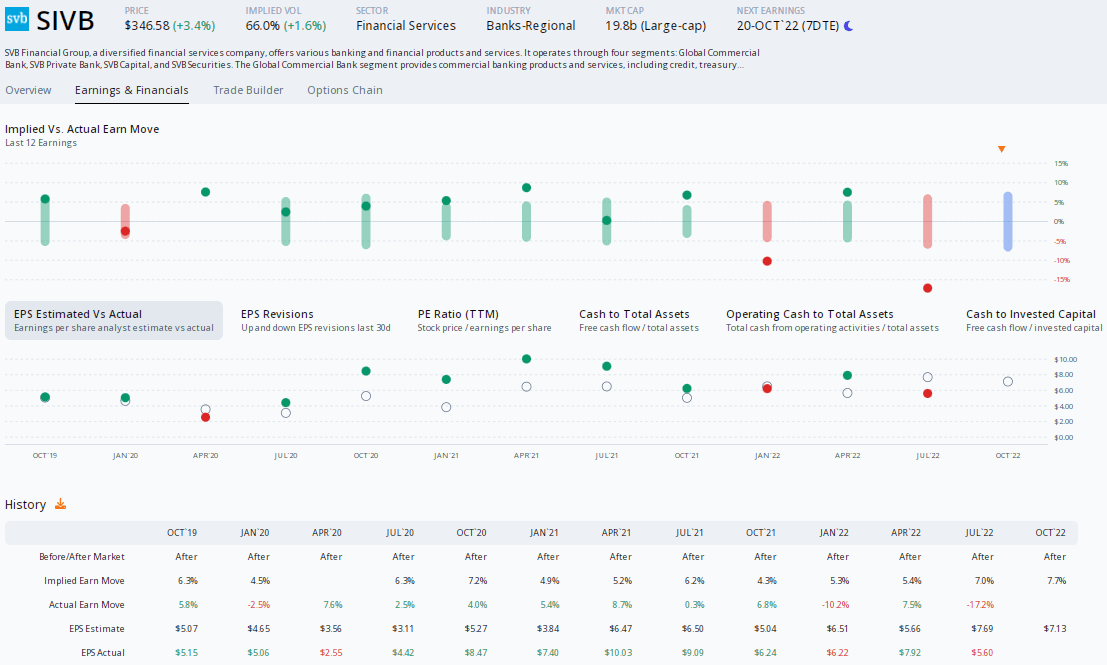
The Technical Take
Despite a strong earnings growth rate expected to be reported, the chart suggests there’s still some room to the downside. SIVB has strong bearish momentum, and I see a test of the pre-COVID highs coming before long. Perhaps the nearly 8% expected stock price move late next week could be the catalyst.
Notice in the chart below that the stock has very little volume from here down to the $267 to $270 range. That would imply another 20% leg lower before the bulls can recharge. Moreover, shares appeared to breakout from the downtrend back in August on a spike to $478, but sellers quickly resumed control. A climb above $425 could help confirm that a low is in.
SIVB: Still Room For Lower Prices Before It Hits Support
Stockcharts.com
The Bottom Line
SIVB should have ample near-term fundamental headwinds with a steep financing slowdown in the tech sector. The chart also suggests continued bearish price action. Ahead of earnings next week, options traders price in a substantial move, and I think that could be lower. Long-term, though, value investors should look to scoop up shares between $270 and $300 and hold.
Be the first to comment