

piranka
Super Micro Computer, Inc. (NASDAQ:SMCI) is one of the major companies that designs and manufactures servers and storage systems mostly within the United States of America, and precisely in San Jose (California).
SMCI also represents a technological reality with strong growth in terms of revenue. We can also record the same growth in terms of EPS. What is struggling to stabilize is the Free Cash Flow which is strongly influenced by the management of the Inventory. The latter represents the key to business success both in positive terms and, unfortunately, in terms of absolute risk. Too aggressive management could inhibit future growth due to a lack of sufficient cash flow.
At the moment the creation of value for shareholders is momentarily delayed if we look at the repurchase of own shares or in large investments for future growth. Market conditions, because of a global shortage, are challenging but new products coming out from Advanced Micro Devices (AMD), NVIDIA (NVDA), and Intel (INTC), could offset the negative market momentum. Growth forecasts for the next quarters remain attractive and the share price appears to be fair. My rate is Buy.
General Overview
Super Micro Computer, Inc. is a high-performance technology-based manufacturer of server and storage systems. The products are made for several applications from cloud and data centers to AI and 5G.
The company defines Total IT Solution as the set of solutions offered to the market: servers and blade servers, workstations, storage systems, networking, system, and security management software. In addition to the products, the company also provides assistance and consultancy services to client companies for the installation and maintenance of IT structures. Two keywords that represent the company organization in terms of services offered are flexibility and customization concerning the various solutions offered to customers.
The products and services, on the other hand, are generally studied, designed, and built with maximum attention to energy efficiency and the theme of the green economy.
The operations are mainly based in Silicon Valley (which is also the headquarter), the Netherlands, and Taiwan. The services are offered in more than 100 different countries to more than 1,000 different customers.
The business strategy is based on the speed of innovation, closely following the new technologies available on the market, and leveraging the global company organization.
The above is translated by the company into the ability to grow 5X higher than the reference industry average:
FISCAL Q1 2023 RESULTS
Financial & Highlights
Revenue and Profitability
Form 10-K + Author Graph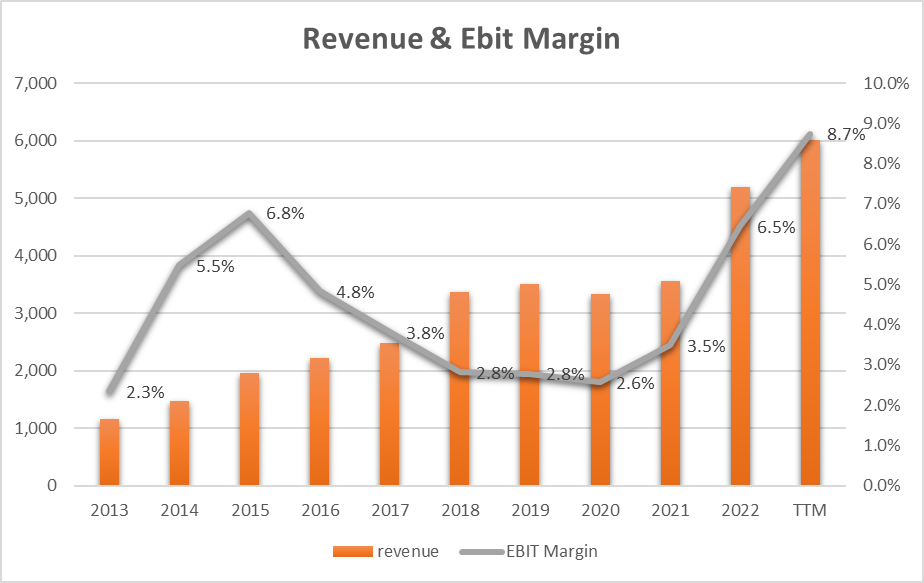
Revenue is growing at 17.9% annually (CAGR) in the last 10 years but it is only in 2022 that it grew by 46% in a single year. The EBIT Margin instead remained low until 2021 and then started to settle at acceptable levels (for this type of company) in 2022 and also in Q1 of 2023 with a respectable 8.7%. The trend is growing and represents a positive element.
Listening to the last earnings call:
Especially, the growing utilization of our Taiwan facility is improving our ability to meet demand and making higher operating margin… our ambition of reaching $20 billion in the near distant future with a focus on increasing our profitability. Based on our current demand and capacity, we are forecasting $1.75 billion revenue for this December quarter, supporting our $7B annual revenue target for FY2023.
…we can underline that Taiwan is the central pivot for the increase in profitability and that the company has a revenue target of $7B for 2023, confirming the deceleration of the average growth rate of the last 10 years compared to 2022.
Also Silicon Valley facility is growing in production and the Company is expected to be able to reach 3,000 production racks per month at 50% more than its actual capability.
Moving on to analyze the profitability of the capital used:
Form 10-K + Author Graph
…we can note how instead the ROCE (Return on Capital Employed) has reached a very high level (27%). This very important figure is mainly due to the Capital Turnover which stood at 3.1. This means that every $1 employed in the company produces a good $3.1 in sales and this has been steadily and consistently for about 10 years. This profitability figure and this stable trend underline the company’s ability to grow revenue without using more resources in terms of assets and capital. Growth is harmonious and sustainable in the long term.
Free Cash Flow, EPS, and CapEx
Form 10-K + Author Graph
In terms of EPS, we can see that the gray bars follow an increasing and stable trend that recalls that of revenue. EPS stands at $6.41 (TTM) and is experiencing annual growth (CAGR) of 32% over the past 10 years.
What instead records an unstable and even negative trend in some years is the Free Cash Flow. The blue bars represent the trend and we can see how in the mid-years the generation of FCF/Share was negative. In particular, 2022 represents the negative peak with -$9.44/share. How is it possible that the company fails to transform earnings into positive cash flow?
Pausing to analyze only the last Q1 of 2023, management says that:
For fiscal Q1, we generated positive cash flow from operations of $314 million versus cash used in operations of $25 million last quarter. The positive operating cash flow was due to higher profitability along with better management of inventory and working capital.
And this represents the key to understanding the company’s difficulties in generating positive Cash Flow on a stable basis. Inventory management represents, and not only in 2022, a critical element capable of heavily eroding cash flow and therefore the ability to invest to grow further.
Going into the details of the last quarters…
FISCAL Q1 2023 RESULTS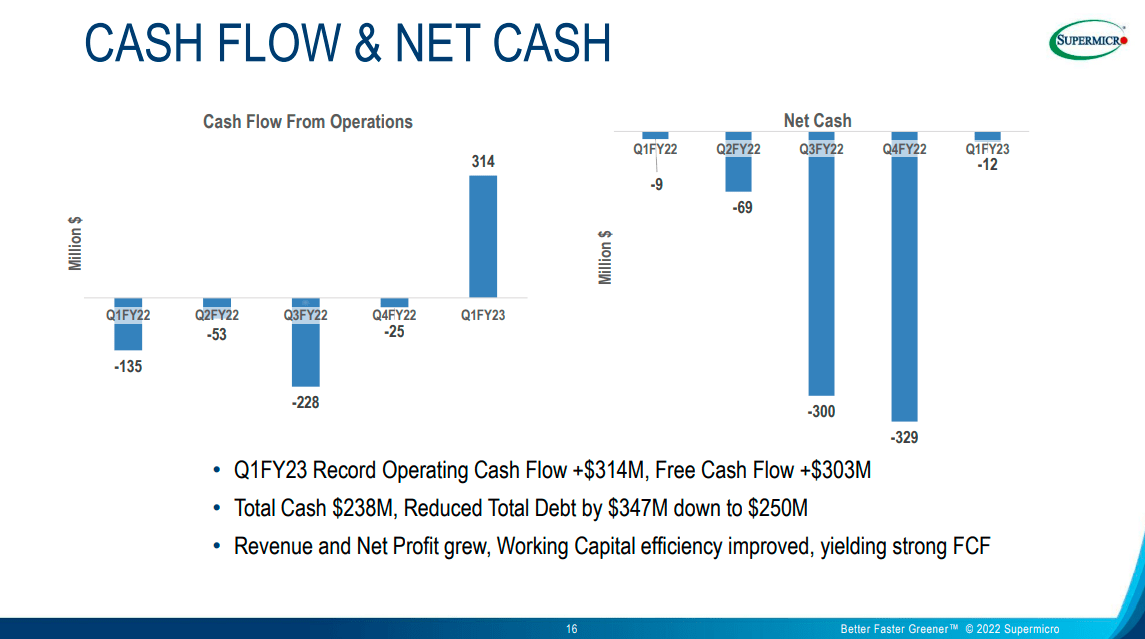
…we can see how Q1 of 23 recorded a high Operating Cash Flow of $314M which did not however offset the negative values of the previous 3 quarters. The Total cash was $238M, the total debt was reduced to $250M with a paid down of $347M. The Q1 strong cash flow generation was also helped by an advanced $70M payment by customers and it is used to pay down debt not to invest. The company has also a buy-back share authorization for $200M until 2024 and for the moment, no cash could be used to create shareholders’ value in terms of share repurchase.
Listening to the Q1 23 earnings call:
As we look ahead to the rest of fiscal 2023, we expect that our improved profitability together with good working capital management will lead to operating cash flow in line with net income.
The management thinks that 2023 could generate high cash flow in line with EPS. I understood that it will be possible only if inventory management will allow for this. I return to the inventory theme in the following paragraph related to risk.
Returning to the previous graph, the yellow line identifies the relationship between CapEx and depreciation. To date, it stands at a value of 1.35 and in the last 6 years, it has remained at a value between 1 and 2. This means that the company is investing sufficiently to maintain its assets. I do not register a growth trend and this indicates that no structural investments are being made for great future developments and growth. What can we expect in the future, the management always tells us:
So we haven’t changed our CapEx allocation strategy. We still have a repurchase plan in place as market – and the board review that policy. And otherwise our CapEx for next quarter was listed as $7 million to $10 million and so we don’t anticipate large increases in inventory.
If the inventory supports a sufficient generation of cash flow, this will not be used for further developments in CapEx but presumably, the share repurchase will take place.
Earnings Power Value Model Valuation
Assuming that the cash profit remains constant over the long term, I use the EPV (earnings power value) method to calculate the share price.
The method starts with EBIT. The second step is to add depreciation and amortization and then subtract stay-in-business CAPEX.
The result is the Cash Trading Profit.
I then subtract the taxes by calculating the amount using the actual tax rate that the company pays.
The result is the After-Tax Cash Trading Profit
At least to calculate the total company enterprise value I divide the After-Tax Cash Profit by the interest Rate I define as fine for this kind of Company (SMCI is a medium-risk company so I decided to use 10%).
The result is the Total Company Earnings Power Value. Dividing the result by the total number of shares we find the value per single share.
The table below shows the calculation for SMCI.
|
EBIT |
526.20 |
|
Dep & amort |
33.50 |
|
CAPEX |
-45.10 |
|
Cash Trading Profit |
514.60 |
|
TAX |
16.60% |
|
TAX |
-85.42 |
|
After TAX cash profit |
429.18 |
|
Interest Rate |
10% |
|
EPV |
4291.76 |
|
Share in issue |
52.9 |
|
EPV per share |
81.1 |
$81.1 represents the share price valuation using the EPV method. If we compare the data with the current market price ($84) we see that the current price could be seen as fair.
Peers and Competition
As the main competitive factors in the Technology Hardware, Storage, and Peripherals industry could be:
• Fast Time to market with early identification of new market opportunities;
• High-quality product with continuous cost improvement;
• Flexibility and scalability of the products;
• Global service provider with highly efficient customer support
I decided to make a comparison with the main competitors with global tech vendors such as Cisco (CSCO), Dell (DELL), Hewlett-Packard Enterprise (HPE), and Lenovo (OTCPK:LNVGY);
Seeking Alpha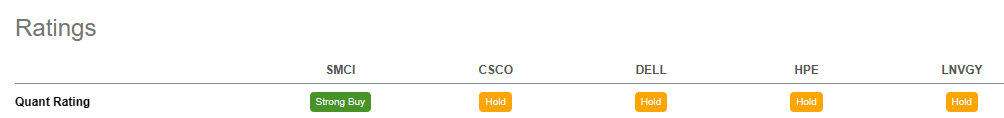
Using Seeking Alpha’s Quant Ratings we have a ‘Strong Buy’ verdict related to the ‘Hold’ rating of the others company.
From the Quant Factor Grades point of view, we can see how SMCI is outstanding in Growth, Momentum, and EPS Revision. Only in Valuation and Profitability, the grade is not outstanding if compared with peers. This comparison allows us to understand how at this moment SMCI is experiencing a good moment with all the positive ratios in his favor and that his peers are unable to be such attractive.
Seeking Alpha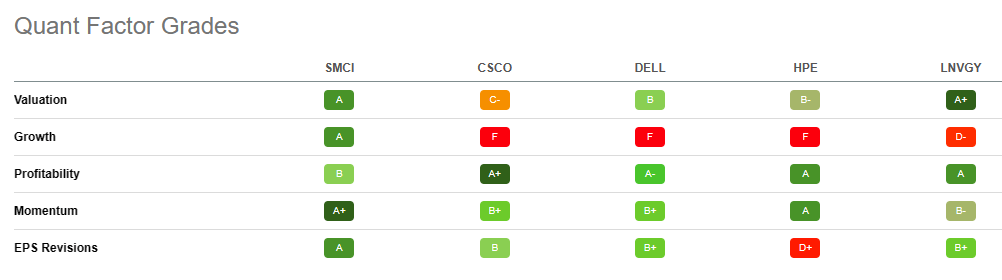
The market has recognized these positive characteristics with a return on investment of 41.28% in the last year. Runner-up HPE with 12.92% is far behind in terms of annual return.
Seeking Alpha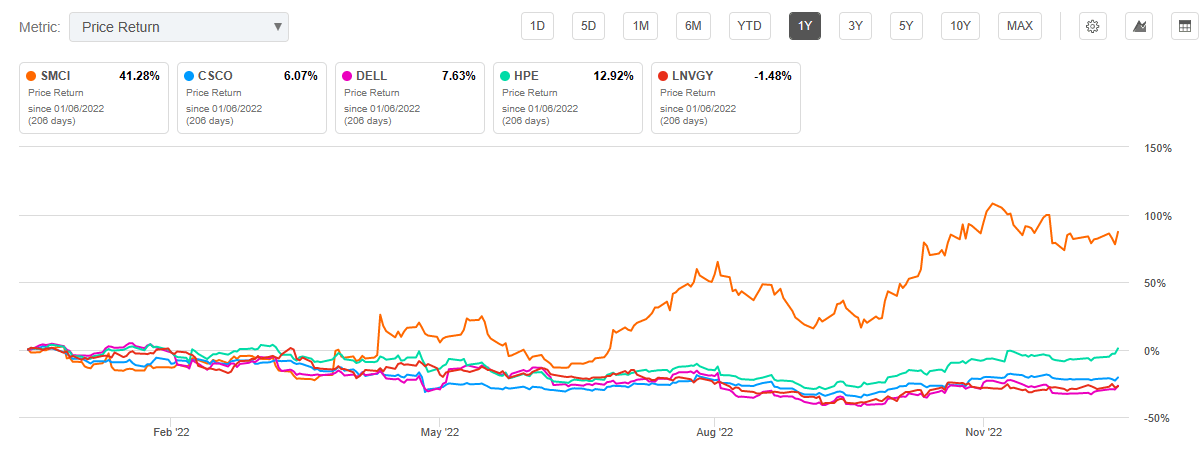
Excess or obsolete Inventory could be one of the main Risk
Form 10-K + Author Graph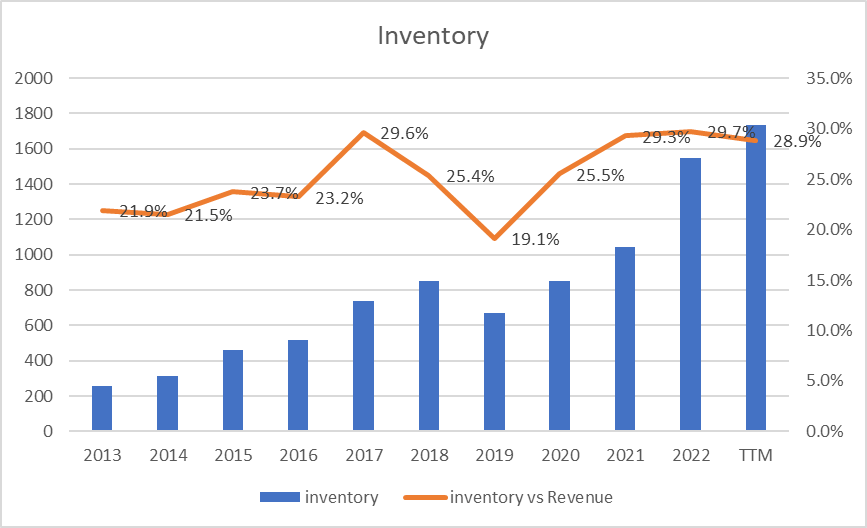
In 2022 the company has reached the highest peak of inventory value, in the last 10 years, if referred to Revenue (29.7%). Only the last Q1-23 recorded a slight drop but, in any case, the figure stands at very high and impressive values. The company’s business strategy is based on fast to market and this translates into an inventory that is always available, large, and varied. But if this, on the one hand, allows us to be first on the market, on the other hand, it poses heavy risks in terms of the value of the fixed product and above all in terms of cash flow.
As we can read from Form 10-K:
We may lose sales or incur unexpected expenses relating to insufficient, excess, or obsolete inventory. To offer greater choices and optimization of our products to benefit our customers, we maintain a high level of inventory. If we fail to maintain sufficient inventory, we may not be able to meet the demand for our products on a timely basis, and our sales may suffer. If we overestimate customer demand for our products, we could experience excess inventory of our products and be unable to sell those products at a reasonable price, or at all. As a result, we may need to record higher inventory reserves. In addition, from time to time we assume greater inventory risk in connection with the purchase or manufacture of more specialized components in connection with higher volume sales opportunities.
High levels of inventories (and the resulting risk) are part of the corporate DNA. As an investor, I would like to see an adjustment of the trend and not an increasing trend.
Conclusion
Super Micro Computer has experienced an explosive growth rate over the past two years, nearly doubling its revenue from $3.5B in 2021 to more than $6B (TTM). EPS has closely followed the revenue growth trend and this has allowed the company to position itself among the top growth technology companies in the last, difficult, year. Investments in CapEx appear to be constant and contained in the maintenance of assets. What interferes significantly with growth and shareholders’ value creation is the Cash Flow which has been fluctuating for the past 10 years and is connected to an atavistic corporate structural problem: Inventory management.
The last Q1 of 23 saw a slight improvement in management and this underlines the company’s focus on containing risk. Strongly growing profitability thanks to Taiwan. I think the company could be a good investment in the medium term. My rate is Buy.
Be the first to comment