

sankai
By Mark Barnes, PhD, and Christine Haggerty, Global Investment Research (GIR)
Among the more notable twists of this year’s raucous third quarter was the upending of the long-running underperformance of the US Growth indexes versus their Value counterparts.
As we cover in our latest GIR Russell US Indexes Spotlight report, both large- and small-cap Growth indexes held up better than their Value peers in the turbulent Q3 as the summer bounce-back in technology and other high-growth stocks did not fully unwind in the broad September selloff. In fact, Russell 2000 Growth even mustered a modest gain. Despite this recent reprieve, Russell 1000 Growth remained the worst performer among the Russell US index family YTD (though its small-cap peer was not far behind), and Russell 1000 Value still ranked at the top (down 17.8%).
Russell US index series performance (TR, USD %) – periods ended September 30, 2022
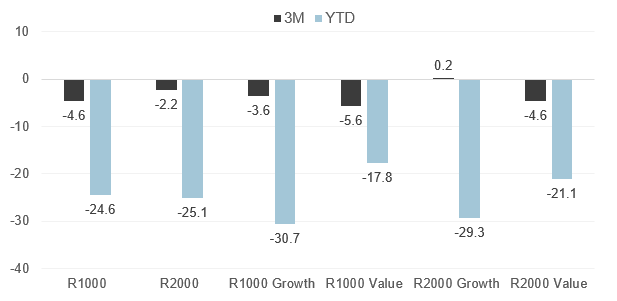
Source: FTSE Russell. Data as of September 30, 2022. Past performance is no guarantee to future results. Please see the end for important disclosures.
Fed policy and rates call the shots
This recent Growth/Value tug of war has coincided with the big shifts in inflation and interest-rate expectations since the spring. Both large- and small-cap Growth enjoyed a strong comeback in early months of the quarter, when the sharp deterioration in leading economic indicators raised hopes for an earlier end to Fed rate hikes and triggered a sharp drop in US bond yields. But those hopes and the rebound in growth stocks came to an abrupt halt in the September rout after Fed Chair Jerome Powell’s hardline speech at the annual Jackson Hole symposium in late August, and increasingly hawkish Fed messaging, drove a renewed spike in bond yields.
10-yr US Treasury bond yield (%)
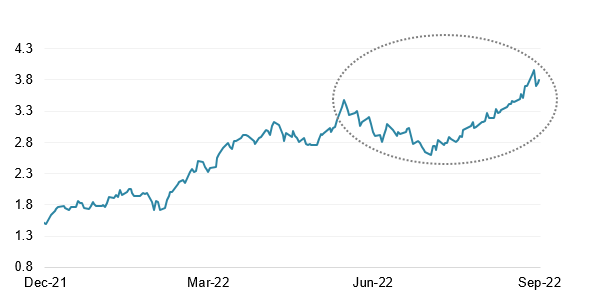
Source: FTSE Russell/Refinitiv. Data through September 30, 2022. Past performance is no guarantee of future results. Please see the end for important legal disclosures.
So, while the Growth style indexes have retraced much of the ground lost to Value since March, they continued to badly lag for the year, as illustrated below.
Russell US Growth relative to US Value index returns (rebased)
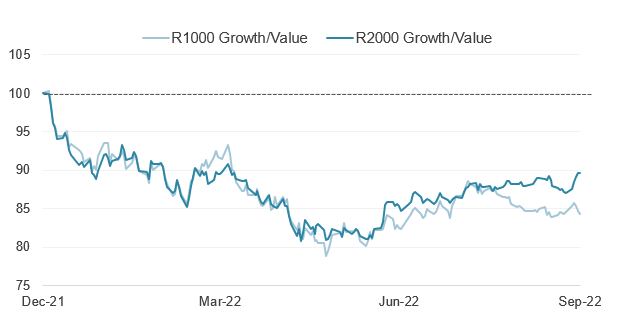
Source: FTSE Russell. Data through September 30, 2022. Past performance is no guarantee of future results. Please see the end for important legal disclosures.
Resource and defensive stocks led the way
Growth’s Q3 winning streak came amid nearly universal losses across industry groups. Across all four style indexes, rate-sensitive Real Estate, Tech, Staples and Telecom stocks were the worst performers, while Energy was the only sector to post gains.
Russell 1000 Growth fared better than Value in eight of 11 industries in Q3, buoyed mostly by outperformances in large-cap Utilities, Discretionary, Basic Materials and Energy. Russell 2000 Growth did so in nine of 11 industries, led by small-cap Telecom, Discretionary and Health Care stocks.
Industry returns (TR %) – Three-months ended September 30, 2022
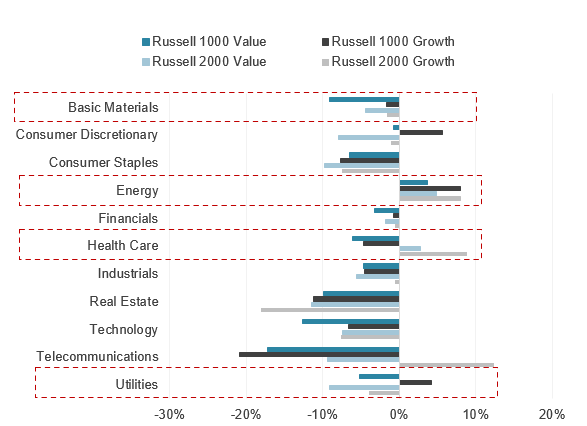
Source: FTSE Russell. Based on Industry Classification Benchmark (ICB) data as of September 30, 2022. Past performance is no guarantee of future results. Please see the end for important legal disclosures.
Despite this U-turn, Value held its edge over Growth YTD for both the large- and small-cap indexes in most industries (eight of 11). Telecom, Health Care and Energy were the top Russell 1000 Value performers for the period, while Energy, Utilities and Real Estate buoyed Russell 2000 Value returns.
———–
© 2022 London Stock Exchange Group plc and its applicable group undertakings (the “LSE Group”). The LSE Group includes (1) FTSE International Limited (“FTSE”), (2) Frank Russell Company (“Russell”), (3) FTSE Global Debt Capital Markets Inc. and FTSE Global Debt Capital Markets Limited (together, “FTSE Canada”), (4) FTSE Fixed Income Europe Limited (“FTSE FI Europe”), (5) FTSE Fixed Income LLC (“FTSE FI”), (6) The Yield Book Inc (“YB”) and (7) Beyond Ratings S.A.S. (“BR”). All rights reserved.
FTSE Russell® is a trading name of FTSE, Russell, FTSE Canada, FTSE FI, FTSE FI Europe, YB and BR. “FTSE®”, “Russell®”, “FTSE Russell®”, “FTSE4Good®”, “ICB®”, “The Yield Book®”, “Beyond Ratings®” and all other trademarks and service marks used herein (whether registered or unregistered) are trademarks and/or service marks owned or licensed by the applicable member of the LSE Group or their respective licensors and are owned, or used under licence, by FTSE, Russell, FTSE Canada, FTSE FI, FTSE FI Europe, YB or BR. FTSE International Limited is authorised and regulated by the Financial Conduct Authority as a benchmark administrator.
All information is provided for information purposes only. All information and data contained in this publication is obtained by the LSE Group, from sources believed by it to be accurate and reliable. Because of the possibility of human and mechanical error as well as other factors, however, such information and data is provided “as is” without warranty of any kind. No member of the LSE Group nor their respective directors, officers, employees, partners or licensors make any claim, prediction, warranty or representation whatsoever, expressly or impliedly, either as to the accuracy, timeliness, completeness, merchantability of any information or of results to be obtained from the use of FTSE Russell products, including but not limited to indexes, data and analytics, or the fitness or suitability of the FTSE Russell products for any particular purpose to which they might be put. Any representation of historical data accessible through FTSE Russell products is provided for information purposes only and is not a reliable indicator of future performance.
No responsibility or liability can be accepted by any member of the LSE Group nor their respective directors, officers, employees, partners or licensors for (a) any loss or damage in whole or in part caused by, resulting from, or relating to any error (negligent or otherwise) or other circumstance involved in procuring, collecting, compiling, interpreting, analysing, editing, transcribing, transmitting, communicating or delivering any such information or data or from use of this document or links to this document or (b) any direct, indirect, special, consequential or incidental damages whatsoever, even if any member of the LSE Group is advised in advance of the possibility of such damages, resulting from the use of, or inability to use, such information.
No member of the LSE Group nor their respective directors, officers, employees, partners or licensors provide investment advice and nothing in this document should be taken as constituting financial or investment advice. No member of the LSE Group nor their respective directors, officers, employees, partners or licensors make any representation regarding the advisability of investing in any asset or whether such investment creates any legal or compliance risks for the investor. A decision to invest in any such asset should not be made in reliance on any information herein. Indexes cannot be invested in directly. Inclusion of an asset in an index is not a recommendation to buy, sell or hold that asset nor confirmation that any particular investor may lawfully buy, sell or hold the asset or an index containing the asset. The general information contained in this publication should not be acted upon without obtaining specific legal, tax, and investment advice from a licensed professional.
Past performance is no guarantee of future results. Charts and graphs are provided for illustrative purposes only. Index returns shown may not represent the results of the actual trading of investable assets. Certain returns shown may reflect back-tested performance. All performance presented prior to the index inception date is back-tested performance. Back-tested performance is not actual performance, but is hypothetical. The back-test calculations are based on the same methodology that was in effect when the index was officially launched. However, back-tested data may reflect the application of the index methodology with the benefit of hindsight, and the historic calculations of an index may change from month to month based on revisions to the underlying economic data used in the calculation of the index.
This document may contain forward-looking assessments. These are based upon a number of assumptions concerning future conditions that ultimately may prove to be inaccurate. Such forward-looking assessments are subject to risks and uncertainties and may be affected by various factors that may cause actual results to differ materially. No member of the LSE Group nor their licensors assume any duty to and do not undertake to update forward-looking assessments.
No part of this information may be reproduced, stored in a retrieval system or transmitted in any form or by any means, electronic, mechanical, photocopying, recording or otherwise, without prior written permission of the applicable member of the LSE Group. Use and distribution of the LSE Group data requires a licence from FTSE, Russell, FTSE Canada, FTSE FI, FTSE FI Europe, YB, BR and/or their respective licensors.
Editor’s Note: The summary bullets for this article were chosen by Seeking Alpha editors.
Be the first to comment