

S&P 500, Nasdaq 100, Dow Talking Points:
Stocks have continued their post-FOMC ramp and the S&P 500 has already set a fresh two-month-high. The big driver for this morning is continued hope for de-escalation in Ukraine, with reports that Russia was withdrawing forces from Kyiv. This helped U.S. equities to gap at the open to continue a rather stunning reversal from the lows set two weeks ago. In the Nasdaq 100 – that ramp has amounted to as much as 17.41% – in two weeks.
The big level of note for today in the Nasdaq 100 is the psychological level at 15k. This spot provided a bit of resistance in mid-February before bears went on the prowl to create fresh 10-month lows the day before the FOMC rate hike. While the index is already stretched, there’s another spot of resistance just ahead, plotted around the current two-month-high and up to a Fibonacci level at 15,307. This could be a spot to plot for possible pullbacks, with 15k offering some element of support potential.
Nasdaq 100 Daily Price Chart
Chart prepared by James Stanley; Nasdaq 100 on Tradingview
S&P 500
The S&P 500 is already trading at a fresh two-month-high after a strong gap-up this morning. The big level of note here is 4600, which was support from early-January which then became resistance on multiple occasions in early-February, just before the index broke down to fresh lows. Yesterday’s price action saw a breakout run up to this zone ahead of the US close, but the overnight move has powered through and this morning’s gap has helped the index to test above this key spot on the chart.
At this point, that zone that runs from the approximate 4590-4600 and can be re-purposed for short-term support potential. If that can’t hold or if we end up with a blow-off move over the next couple of days, 4538 remains of interest for support potential as it showed as resistance but, as yet, hasn’t shown much for support.
S&P 500 Four-Hour Price Chart
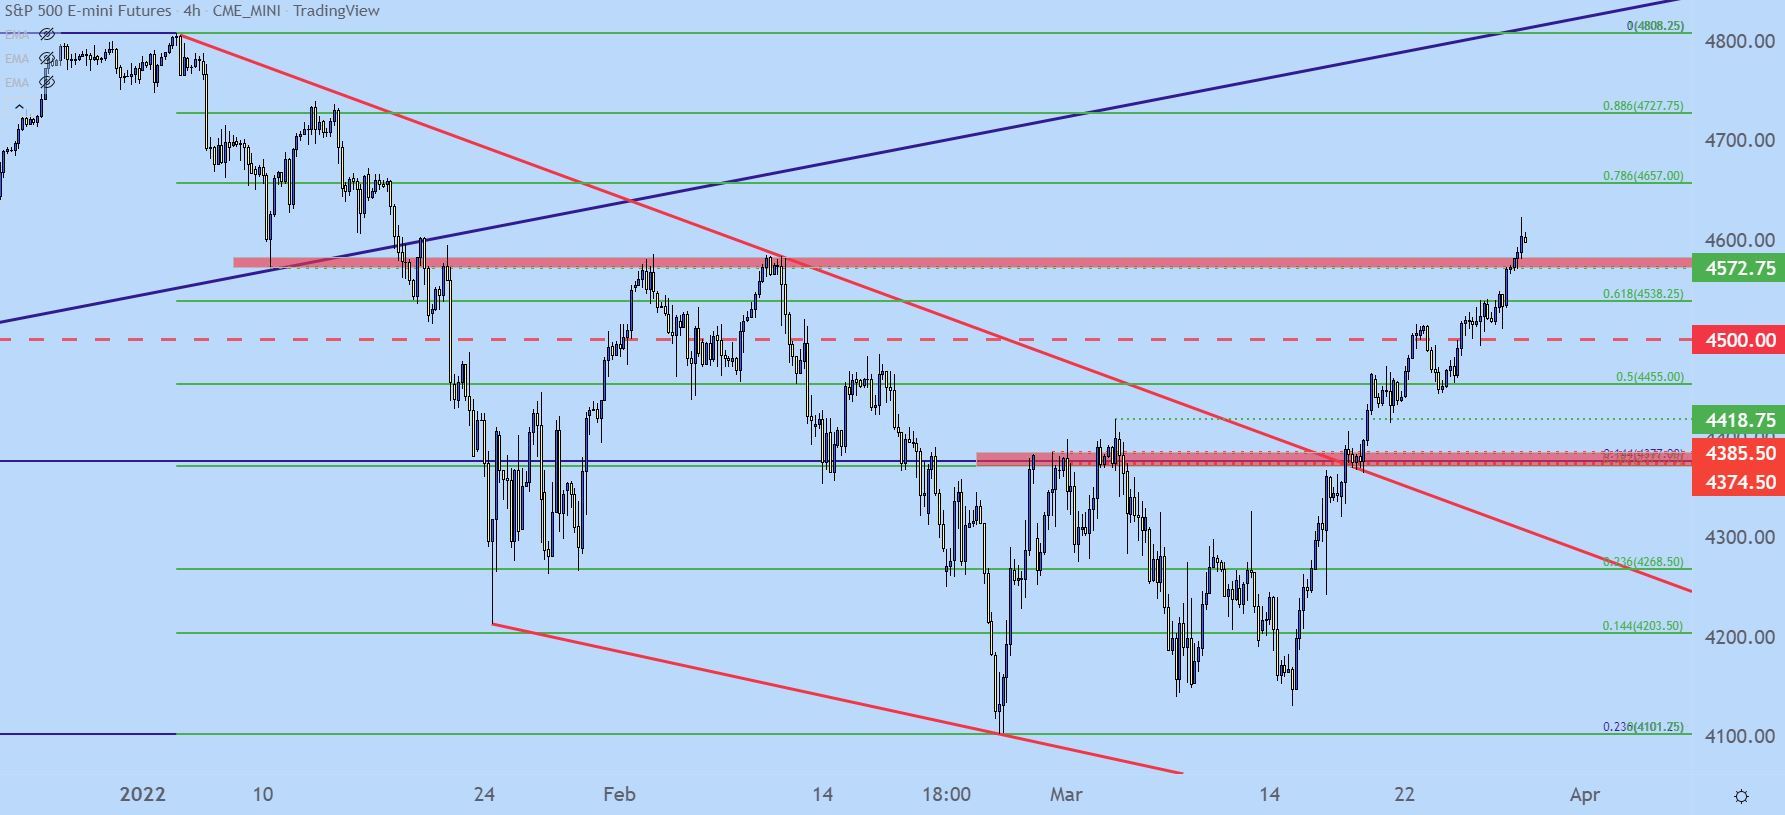
Chart prepared by James Stanley; S&P 500 on Tradingview
Dow Jones
The big level in the Dow is the 35k psychological level. Just last week there was a test of support at a key area on the chart around the 32,500 zone, which led to a strong bounce which eventually led to a fresh monthly high.
The 35k level was last in play as an intra-day high on February 16th which led to a fresh 11-month-low. As of this writing it looks like the 35k level is already showing as short-term support for pullback themes after this morning’s gap. But, there’s another spot of support a bit deeper, plotted from around 34,800.
Dow Jones Four-Hour Price Chart
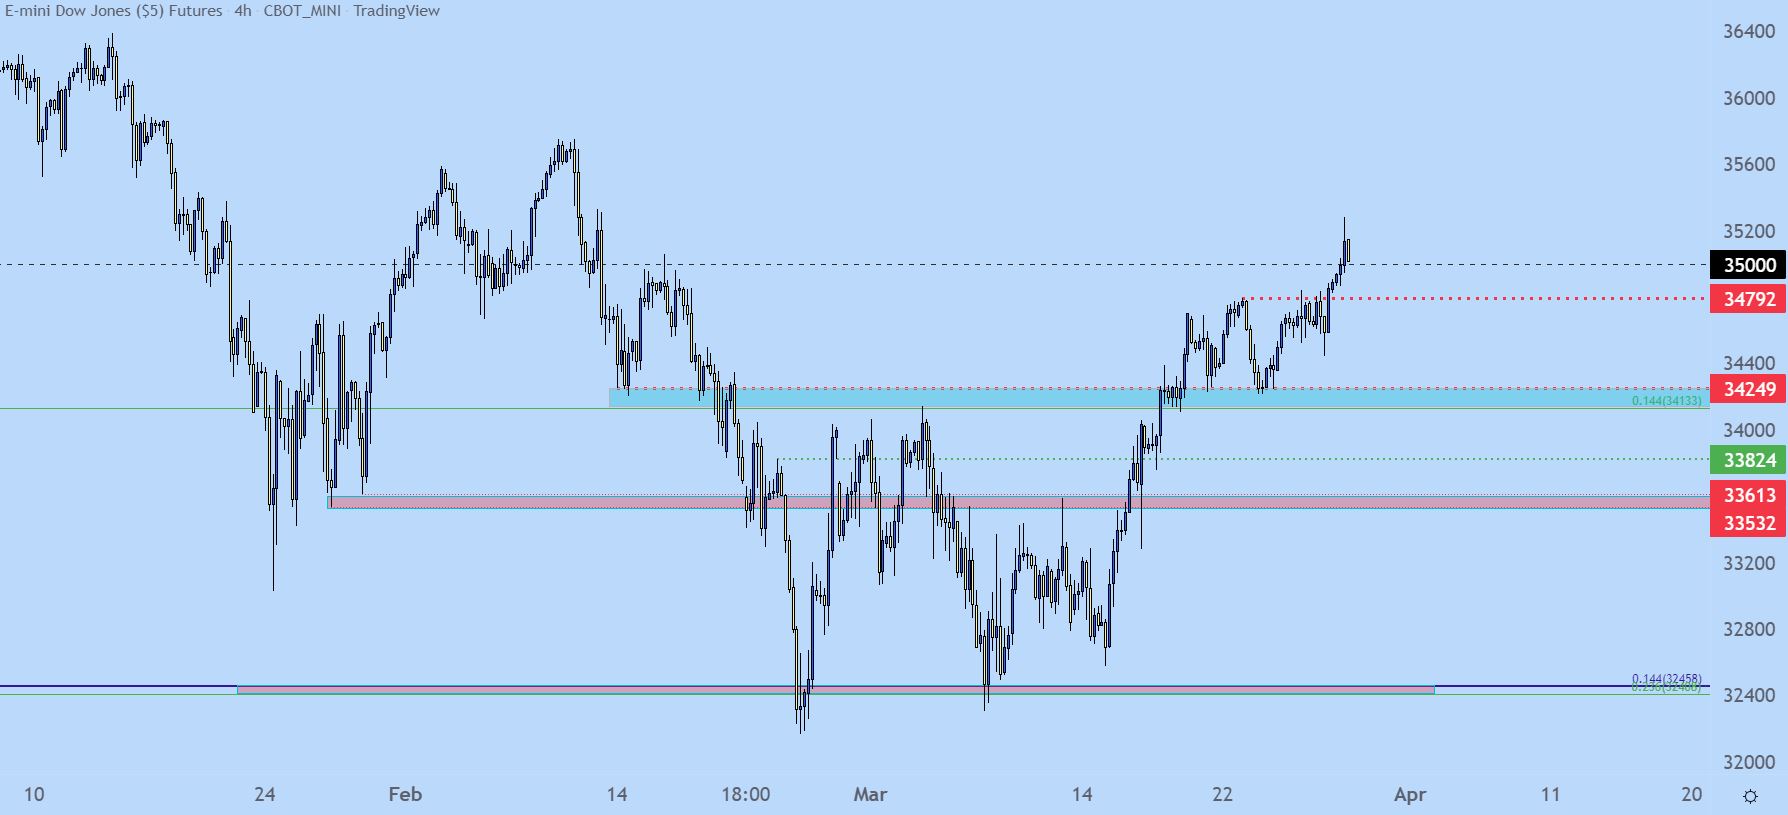
Chart prepared by James Stanley; Dow Jones on Tradingview
— Written by James Stanley, Senior Strategist for DailyFX.com
Contact and follow James on Twitter: @JStanleyFX
Be the first to comment