
cagkansayin/iStock via Getty Images
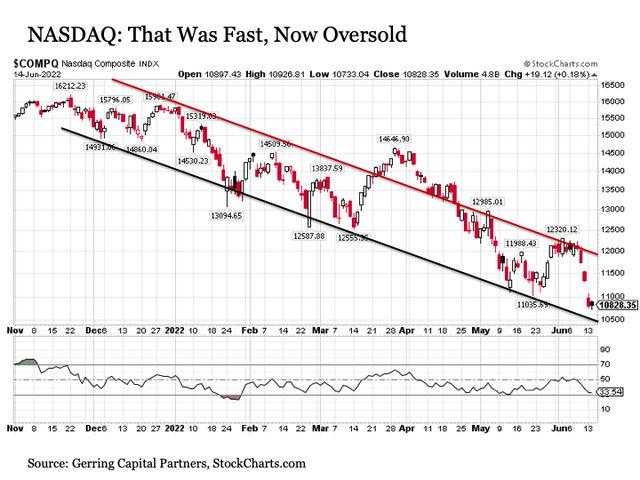
That was fast. Just last week, I wrote an article on Seeking Alpha discussing expectations for a next leg lower in tech stocks. While I believed the downside would materialize, I didn’t necessarily think it would play out in less than a week. And given that tech and tech adjacent in communications services (GOOG)(META) and consumer discretionary (AMZN)(TSLA) still make up well over 30% of the overall market, this weakness has gone a long way in driving the S&P 500 Index also strongly to the downside. Given the pace of the recent declines, markets are now ready for a bounce as we approach the next key Fed announcement on Wednesday afternoon.
StockCharts.com
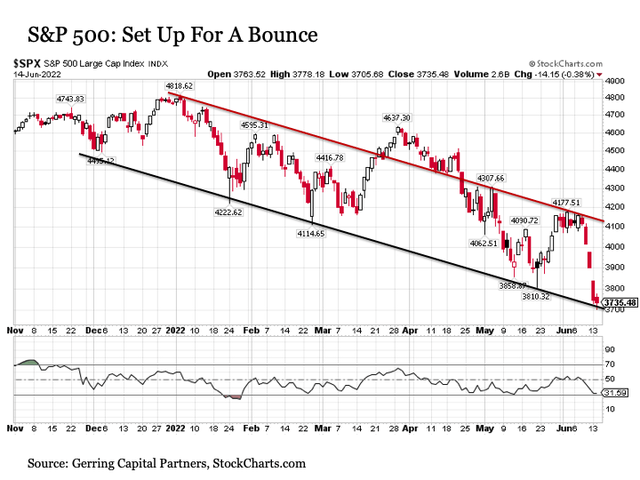
From resistance to support in just five trading days. It was just the middle of last week when the headline S&P 500 Index was continuing to grind along its downward sloping trendline resistance (red line in chart below) trying to squeeze a breakout to the upside.
StockCharts.com
But an abysmal five trading day stretch that included a cage rattling inflation report on Friday quickly sent the S&P 500 to new 2022 lows and in the process to oversold levels coupled with downward sloping trendline support. In short, the S&P 500 has fallen too far, too fast, and is now primed for a short-term bounce to the upside. Any such rebound could take the headline index back above 4000 before it’s all said and done.
The question then is what to do from a portfolio strategy perspective following any such bounce?
Additional information beyond the stock market. Consider the U.S. Treasury market, which has been taking a drubbing of its own in recent trading days. For example, the 10-Year U.S. Treasury yield last Thursday was yielding 3.04%. (heading into Memorial Day, it was trading as low as 2.74%). On Tuesday, it closed with a yield of 3.49%. This is a breathtaking 45 basis point increase in the 10-Year U.S. Treasury yield in just three trading days (and a 75 basis point jump since Memorial Day, which was just ten trading days ago!).
Stocks and bonds getting pummeled at the very same time. What is the 60/40 investor to do?
The first answer is do not panic. When security prices are plunging as they have the last few trading days, the knee-jerk reaction among many investors can be to sell in the downdraft. But this is exactly what you don’t want to do. It is important to remember that major established markets like the U.S. stock market and the U.S. Treasury market do not go down in a straight line. Even if investors are trapped in the fully clenched jaws of a bear market, securities in these categories oscillate to the downside with sharp declines followed by measurable rallies. All one needs to do is look at the charts of the NASDAQ and S&P 500 above to see how this phenomenon works over time. Thus, if you as an investor are inclined to sell in either of these established stock and bond markets, you are almost always best to wait for the inevitable bounce before striking your exit (speculative fare like cryptocurrencies are an entirely different story – caveat to the emptor on those kind of “assets” if you want to call them that).
Next, while staying calm, evaluate the true market messages. Ignore the reasons cited in the financial news media during their headline news flashes explaining why the markets are moving on any given day, as these are typically not the reasons. Instead, stick to your investment philosophy and ask yourself a few key questions.
- Is the decline in the market orderly or chaotic?
- Is everything going down in integers, or are some areas of the market actually able to squeak out gains?
- Have the economic and/or market fundamentals changed, and if so, how should portfolio strategy be adjusted on the margins (in other words, incremental changes instead of buying or selling everything at once)?
The answer to the first question above is that the market decline has been orderly so far. While some liquidation activity clearly is taking place across capital markets, we see the S&P 500 Index for example continue to oscillate consistently in its downward sloping trading channel. Same with the NASDAQ.
The answer to the second question is that the market remains selective. Sure, most everything got taken out to the woodshed on Friday and Monday, but some stocks have still been able to fight their way higher. For example, Kellogg (K) had a fine day on Friday while the broader S&P 500 was getting slammed, and it’s still trading higher since opening day Friday levels.
Lastly, the economic and/or market fundamentals have indeed changed in one key respect over the last few trading days, and this has to do with the piping hot inflation data released on Friday and the anticipated response by the U.S. Federal Reserve that has emerged in the trading days since.
Too capricious for my liking. So here’s how it’s all been going down in a nutshell. The Bureau of Labor Statistics releases the latest monthly read on inflation for May on Friday, and the headline Consumer Price Index number comes in hot. Never mind that the annual core inflation rate eased lower for the second month in a row, the focus was on the rebound in the headline annual inflation and rightfully so.
Up until that point and even into the start of the new trading week, the U.S. Federal Reserve had been on record with the plan to raise interest rates by 50 basis points at their upcoming Federal Open Market Committee meeting this week culminating with the announcement at 2PM on Wednesday afternoon. But following the unexpectedly hot inflation number on Friday, we not so subtly found several former Fed members splashing news and opinion all over The Wall Street Journal that a 75 basis point hike is what actually should be in order come Wednesday afternoon. Got the message along with the CME Fed Funds futures markets, which dramatically shifted from 35% odds on Monday for a 75 bps hike to 99% odds on Tuesday.
The Fed has a tough inflation fight on their hands, and theirs is certainly not an easy job, particularly as fiscal policy will remain relatively easy for the foreseeable future (never mind the Fed’s bloated balance sheet). I get it. But where I have a problem is the abruptness of this change. I know the headline annual inflation rate was hot last Friday, and a variety of the underlying data showed stubborn pricing pressures.
But is the Fed’s modeling that is designed to direct their policy making for the largest and most influential economy in the world including the keeper of the global reserve currency so sensitive and reactive that it is compelled to tack on an additional 25 basis points of tightening to their policy strategy as the result of a single recent data point? This is a particular question when both the headline and core annual PPI inflation rates showed continued signs of incremental cooling in their own right on Monday. This is also a particular question when we learn in Econ 101 that economic data releases at any given point in time are subject to meaningful revision and should be taken with a healthy dash of salt upon initial release.
It is here where I have concerns. The Fed has shifted last minute to a 75-basis point hike, seemingly based on a single data point. I worry about the reactivity of the move and what it may imply about the rigor and discipline of the underlying research driving their policy approach during this difficult policy fight against inflation. I hope that I am misplaced in my concern. Nonetheless, it has implications for portfolio strategy and the need for potential changes at the margins from a risk control perspective.
So what should we reasonably expect? First, it is reasonable to anticipate that capital markets may rebound once the Fed decision is released on Wednesday at 2PM. This is because uncertainty will be eliminated with the Fed decision and the market will have better knowledge of how the Fed plans to proceed going forward. The financial media narrative would likely follow the thread that capital markets are reassured that the Fed is taking the inflation fight head on by hiking a more assertive 75 basis points. The bounce may not be instantaneous or consistent, as stocks in particular have a history of rallying the afternoon of a Fed decision only to sell off for the remainder of the week and declining the afternoon of a Fed decision only to rally for the remainder of the week. Nonetheless, the certainty provided by the Fed announcement may be a sufficient catalyst to spark a rally in either oversold stocks or oversold bonds or both through the remainder of the trading week.
Next, it is important to carefully consider what the bond market is already telling us. U.S. Treasury yields have been up a lot the last few trading days as mentioned above. But the more telling information associated with what all of this means including the implications of the Fed likely shifting from 50 bps to 75 bps for capital markets in the months ahead.
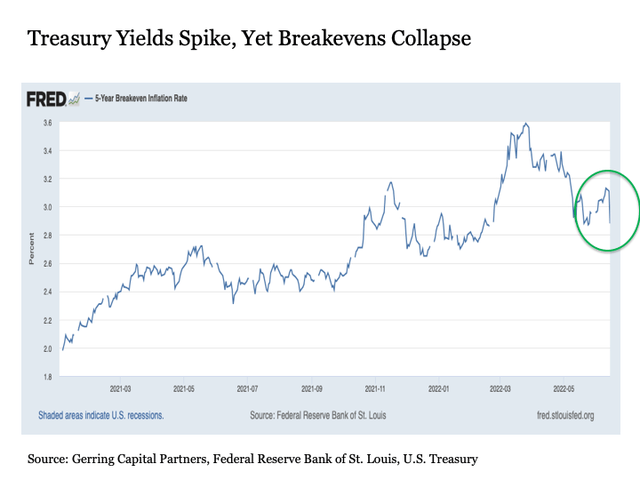
Plunging Breakevens. Most notable is the fact that while the logical explanation for Treasury yields spiking since last Thursday is the threat of inflation, the glaring contraction is that both 5-year and 10-year breakeven inflation rates have plunged over the same time period. Consider the 5-year breakeven inflation rate chart below.
Federal Reserve Bank of St. Louis
On Tuesday alone, the 5-year breakeven rate dropped by 23 basis points to its lowest levels since just before Memorial Day and before the Russian invasion of Ukraine in mid-February before that. In other words, inflation expectations are not rising but instead are falling off sharply right now. This implies that the bond market may be thinking that the Fed might take an over aggressive turn with its policy approach. What are the economic implications of such an outcome?
StockCharts.com
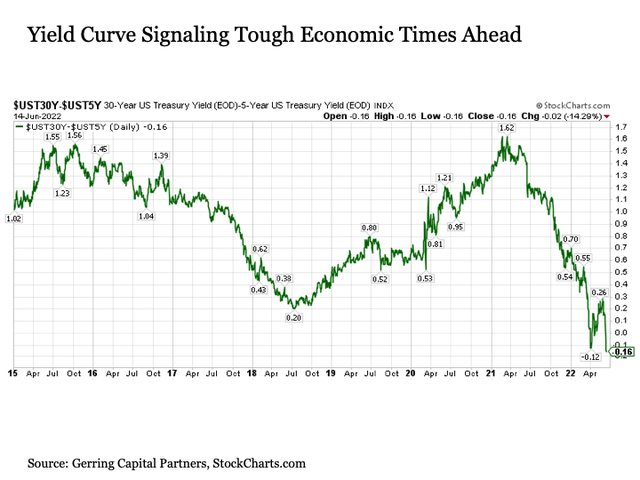
Inverted yield curve. Accompanying the drop in breakevens is a swift shift back toward inversion in the Treasury yield curve. An inverted yield curve where the yields on shorter dated Treasuries (i.e. the 5-year Treasury yield) are higher than the yields on longer dated Treasuries (i.e. the 30-year Treasury yield) historically has not been a good sign for the economy or the stock market. And a look at the 5/30 spread shows that we have entered into a new deeper level of inversion by this yield curve measure. In short, the market is increasingly signaling that an economic recession may lie ahead, with the probability of such an outcome increasing with the Fed’s apparently more aggressive policy turn this week.
Still signaling disinflationary over stagflationary. Recessions are decidedly negative for the broader stock market, although selected market segments (value, defensives) can continue to perform well through much of these difficult periods. But what of the nature of this recession that potentially looms on the horizon. Will it be accompanied by easing if not outright falling pricing pressures, or will it be accompanied by stubborn inflation? We can return to the Treasury market for answers supporting the disinflationary outcome.
StockCharts.com
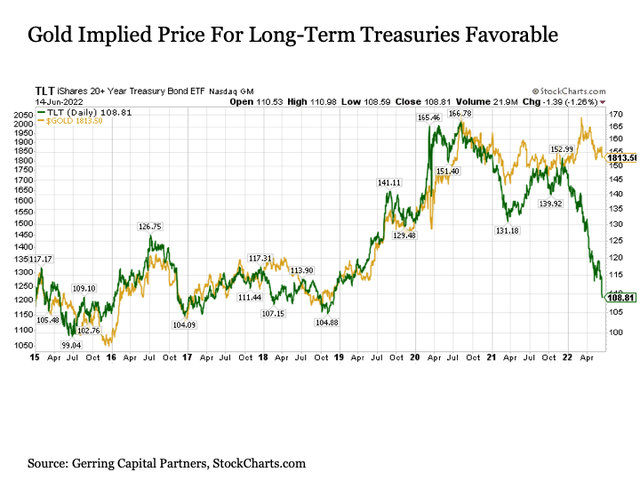
First, the gold implied price for U.S. Treasuries is meaningfully higher from where it is trading today. Why does this relationship matter? Because if the Fed was truly on the brink of needing to tighten monetary policy aggressively AND sustainably to combat a persistent inflation problem, we would expect to see gold selling off along with Treasuries. Instead, gold is holding firm, thus implying that the collective marketplace is more concerned about the potential instability that comes with an economic recession.
StockCharts.com
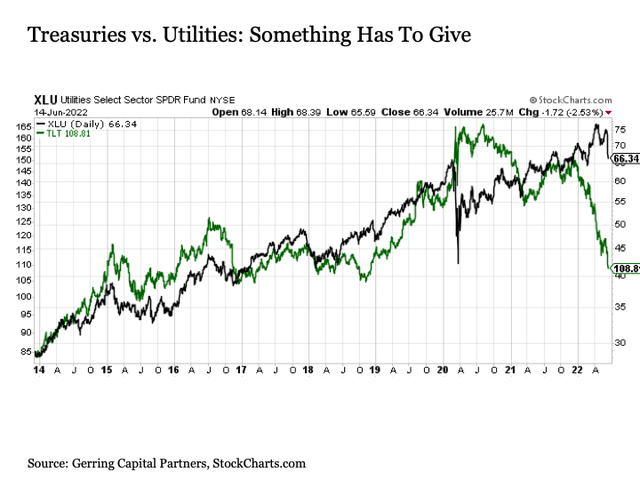
Next, the utilities implied price for U.S. Treasuries is also measurably higher. I’m no fan of utilities or their premium valuations in the current market environment, as I moved to a zero weight to the sector earlier this year after maintaining a dedicated overweight dating back to late 2013. But particularly in light of their premium valuations, if market participants were collectively of the mind that inflationary pressures were likely to be sustained going forward, we would expect to see utilities getting absolutely crushed along with Treasuries. Instead, they have been moving solidly higher throughout 2022.
These are just a few of the disconnected relationships with the Treasury market right now that suggest not only a disinflationary recession lies ahead following today’s high inflation economic fade (the Atlanta GDP Now forecast for 2022 Q2 GDP Growth has fallen to a notably low 0.9% – 2022 Q1 GDP growth was already negative, so if this Q2 number turns negative it would trip the technical definition of a recession much earlier than anticipated), but also provides indications of the accompanying investment opportunities and risks as we travel through these transitions in the months ahead.
Bottom line and investment implications. The Fed appears ready to take a more reflexively aggressive turn with monetary policy. This is increasingly the probability that the U.S. economy will eventually fall into recession (if it’s not there already). Markets appear set to bounce from oversold levels, perhaps as soon as this week depending on the response to the Fed decision on Wednesday afternoon. Given the escalation in economic and market risks that looms ahead, it will be prudent to use any such near-term bounce to consider paring back stock allocations on the margins. This may involve taking profits on selected positions that have been working, or harvesting losses on allocations that appear set to underperform as current economic conditions continue to unfold.
As for where to reallocate proceeds from these sales on the margins beyond a net increase in the allocation to cash, adding replacement stock allocations to specific and targeted areas of the market that are set to continue performing well like energy, food, health care and defense is a worthwhile consideration. We may also eventually reach the juncture where the sell-off in Treasuries provides an attractive entry point for purchases. Counterintuitively, the fact that the Fed appears to be tightening more aggressively may ultimately make long-term Treasuries in particular more attractive, with the Fed’s determination to defeat inflation through more aggressive monetary policy leading to a disinflationary/deflationary economic slowdown toward if not into recession bolstering their safe haven appeal.


Be the first to comment