

ismagilov
The overnight anomaly in the US stock market has been known since the 90s. In a nutshell, regular trading hours activity has had a minimum effect on the long-term performance of indexes, such as the S&P 500 (SPX).
Below is a chart of SPY ETF (NYSEARCA:SPY) since inception.
Daily SPY ETF Chart with Regular Trading Hours and Overnight Accumulation Lines (Price Action Lab Blog – Norgate Data)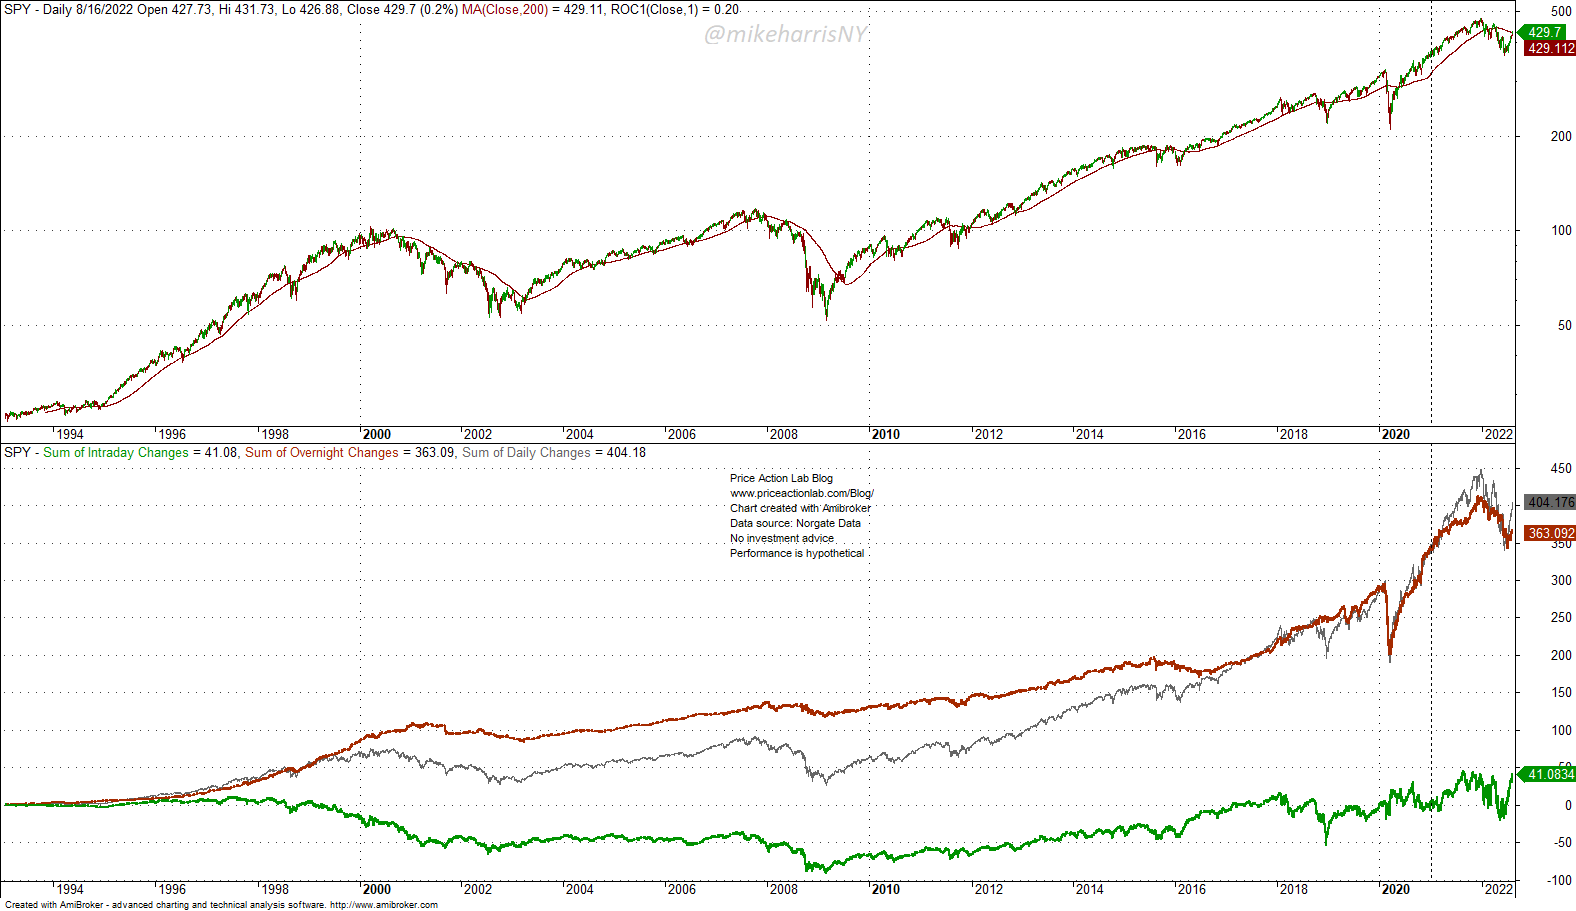
In the bottom chart, the red line shows the overnight accumulation in points, the green line shows the regular trading hours accumulation in points, and the gray line is the daily accumulation. As of the close of Tuesday, August 16, 2022, the regular trading hours have contributed only 41.1 points to a total rise of 404.2 points.
Until about March 2017, the impact of regular trading hours on performance was negative. Afterward, the impact became mostly neutral until 2018, i.e., regular trading hours did not have any effect on performance and all gains in the ETF were due to overnight changes.
Between August and December 2018 the effect of regular trading hours become again negative, and slowly turned neutral by January 2020. Since March 2021, the impact of regular trading hours has increased but has been volatile. After the recent bottom in stocks on June 17, 2022, there is a notable uptrend in regular trading hours gains, as shown below.
Daily SPY ETF Chart with Regular Trading Hours and Overnight Accumulation Lines Since June 17, 2022 (Price Action Lab Blog – Norgate Data)
Since June 17, 2022, the regular trading hours (green line) have contributed 58.4 points, while the overnight (red line) has contributed only 6.3 points. Therefore, there has been significant action during regular training hours pushing the market higher.
Below is the year-to-date daily price action of the stock of Apple Inc. (AAPL).
Daily AAPL Chart with Regular Trading Hours and Overnight Accumulation Lines (Price Action Lab Blog – Norgate Data)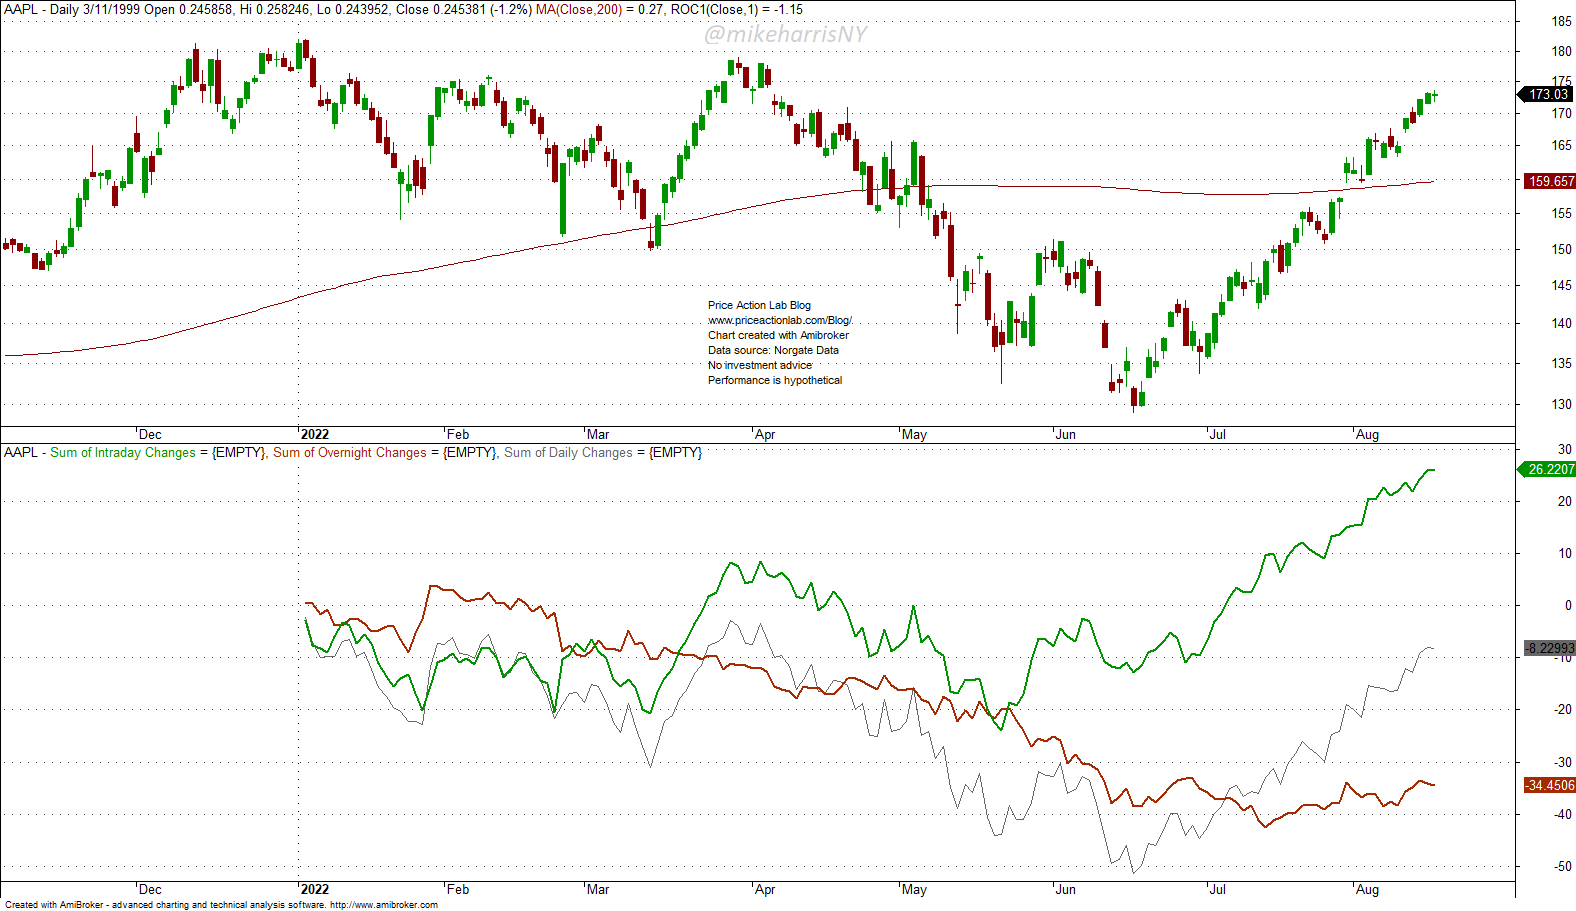
The regular trading hours (green line) have contributed 26.2 points, while the overnight had a negative effect of -34.5 points. Traders and investors have been buying the stock during the day after it was falling overnight. This is a significant regime change.
Note that the overnight effect was pronounced in AAPL stock until mid-2019, with regular trading hours having contributed nothing to the rise in the price of the stock. This seems to have changed afterward, especially this year.
Daily AAPL Chart with Regular Trading Hours and Overnight Accumulation Lines (Price Action Lab Blog – Norgate Data)
In 2020, and especially during the pandemic crash, action in regular trading hours increased, only to subside when the market recovered. The regular trading hours activity increased again in mid-2021. In the case of AAPL, there may be a regime shift in this context.
This author is not particularly interested in the causes of these price action anomalies, or whether they are the result of manipulation as some traders claim. For investors and traders, a regime change, especially after the emergence of ETFs that attempt to profit from overnight changes in SPY ETF, may have some important ramifications. For example, the closing price of regular trading hours may lose its relative importance to the opening of the next session. Markets will become more efficient and rebalancing costs due to slippage may decrease.
Summary
There are preliminary indications that the overnight anomaly in the stock market may be slowly disappearing, or at least its effect is diminishing.
A more efficient market will offer more flexibility to investors for rebalancing portfolios and reduce the impact and cost due to overnight gaps.
The overnight anomaly has persisted for decades and the causes for it are mere speculations. As the market becomes more efficient, this and other market anomalies will disappear.
Be the first to comment